| Param | Original file | Final file |
|---|---|---|
| Filename | modeM0/AS1A14_039T06_9000006526_54883cztM0_level2.fits | modeM0/AS1A14_039T06_9000006526_54883cztM0_level2_quad_clean.evt |
| Size (bytes) | 524,949,120 | 97,387,200 |
| Size | 500.6 MB | 92.9 MB |
| Events in quadrant A | 3,950,987 | 646,352 |
| Events in quadrant B | 3,509,286 | 682,626 |
| Events in quadrant C | 5,795,512 | 585,095 |
| Events in quadrant D | 5,642,503 | 555,876 |
| Mode M9 | |||
|---|---|---|---|
| Quadrant | BADHDUFLAG | Total packets | Discarded packets |
| A | 0 | 2 | 0 |
| B | 0 | 2 | 0 |
| C | 0 | 2 | 0 |
| D | 0 | 2 | 0 |
| Mode M0 | |||
|---|---|---|---|
| Quadrant | BADHDUFLAG | Total packets | Discarded packets |
| A | 0 | 16360 | 1 |
| B | 0 | 15478 | 2 |
| C | 0 | 22140 | 23 |
| D | 0 | 21634 | 7 |
| Mode SS | |||
|---|---|---|---|
| Quadrant | BADHDUFLAG | Total packets | Discarded packets |
| A | 0 | 138 | 0 |
| B | 0 | 138 | 0 |
| C | 0 | 138 | 0 |
| D | 0 | 138 | 0 |
| Quadrant | Total seconds | Saturated seconds | Saturation percentage |
|---|---|---|---|
| A | 6877 | 130 | 1.890359% |
| B | 6877 | 223 | 3.242693% |
| C | 6871 | 515 | 7.495270% |
| D | 6875 | 489 | 7.112727% |
Noise dominated data is calculated using 1-second bins in cleaned event files. If a bin has >2000 counts, and if more than 50% of those come from <1% of pixels, then it is considered to be noise-dominated and hence unusable.
| Quadrant | # 1 sec bins | Bins with >0 counts | Bins with >2000 counts | High rate bins dominated by noise | Noise dominated (total time) | Noise dominated (detector-on time) | Marked lightcurve |
|---|---|---|---|---|---|---|---|
| A | 7072 | 6879 | 28 | 28 | 0.40% | 0.41% | 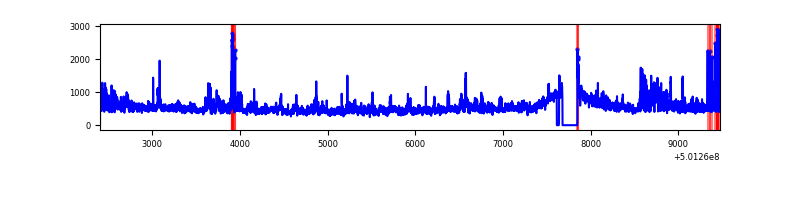 |
| B | 7071 | 6878 | 55 | 55 | 0.78% | 0.80% | 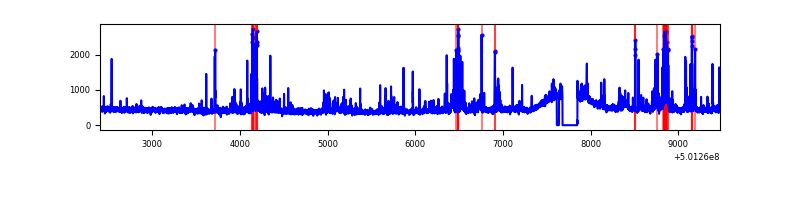 |
| C | 7072 | 6876 | 407 | 407 | 5.76% | 5.92% | 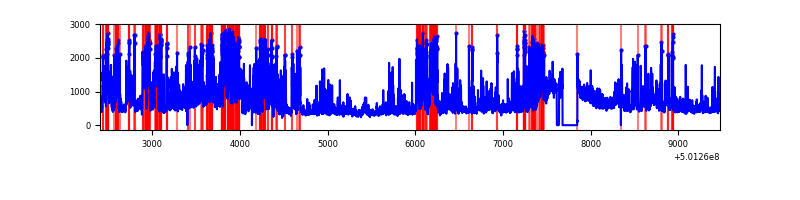 |
| D | 7072 | 6878 | 349 | 349 | 4.93% | 5.07% | 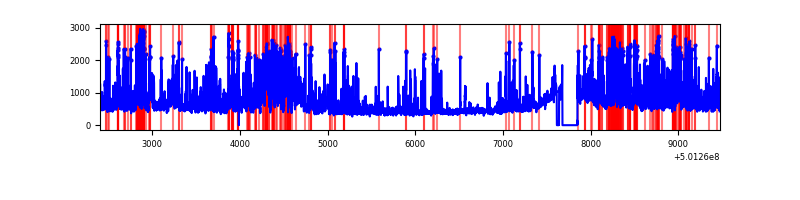 |
Top three noisy pixels from each quadrant. If the there are fewer than three noisy pixels in the level2.evt file, extra rows are filled as -1
| Pixel properties | Quadrant properties | ||||||
|---|---|---|---|---|---|---|---|
| Quadrant | DetID | PixID | Counts | Sigma | Mean | Median | Sigma |
| A | 3 | 14 | 796761 | 4270.48 | 756 | 738 | 186.4 |
| A | 13 | 248 | 57795 | 306.1 | 756 | 738 | 186.4 |
| A | 8 | 246 | 50714 | 268.11 | 756 | 738 | 186.4 |
| B | 5 | 185 | 278572 | 1735.48 | 743 | 715 | 160.1 |
| B | 10 | 247 | 185884 | 1156.56 | 743 | 715 | 160.1 |
| B | 2 | 249 | 50483 | 310.85 | 743 | 715 | 160.1 |
| C | 12 | 252 | 2314441 | 11687.69 | 725 | 720 | 198.0 |
| C | 6 | 223 | 279413 | 1407.81 | 725 | 720 | 198.0 |
| C | 14 | 254 | 108846 | 546.19 | 725 | 720 | 198.0 |
| D | 2 | 172 | 647068 | 3150.27 | 725 | 694 | 205.2 |
| D | 6 | 46 | 501875 | 2442.63 | 725 | 694 | 205.2 |
| D | 15 | 94 | 388268 | 1888.94 | 725 | 694 | 205.2 |
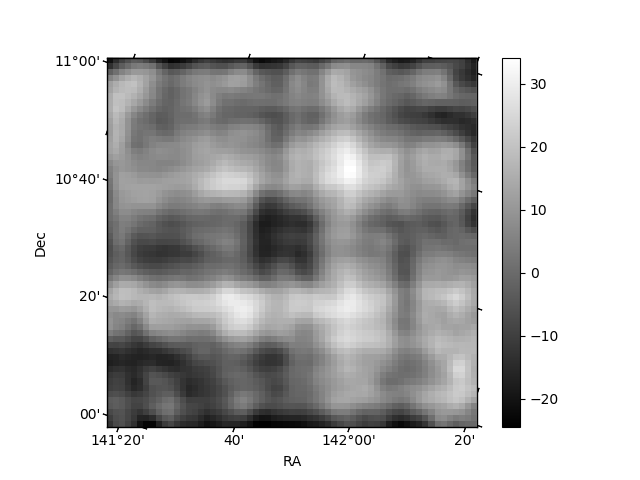
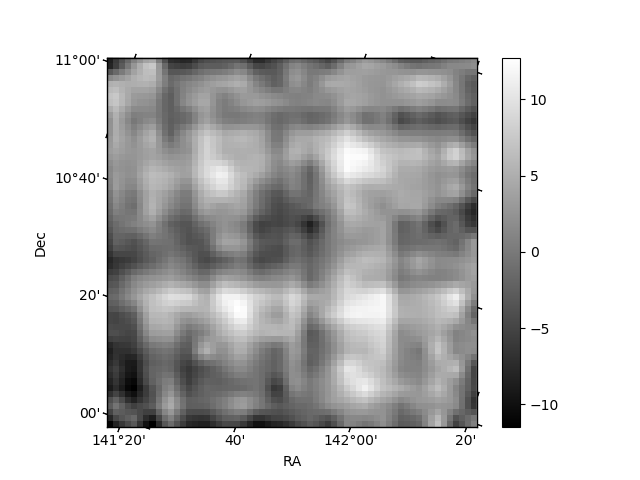
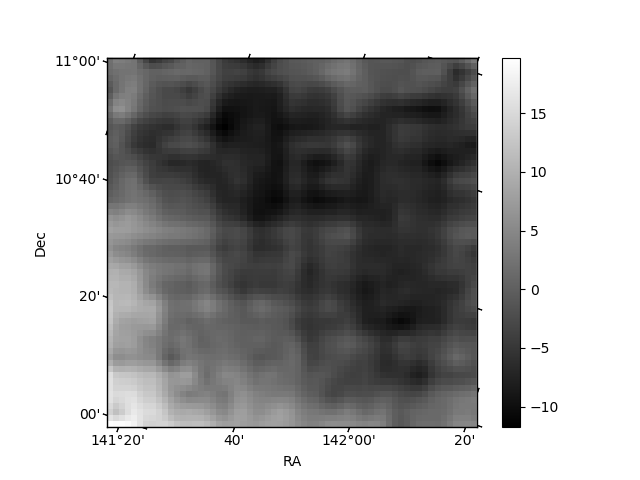
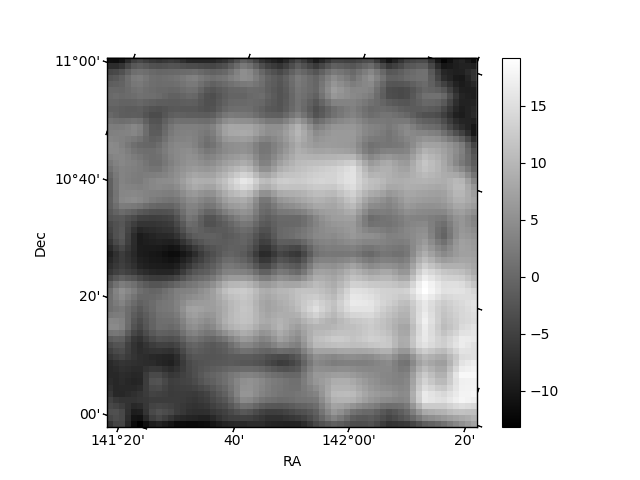
Histogram calculated using DETX and DETY for each event in the final _common_clean file
| Quadrant A | 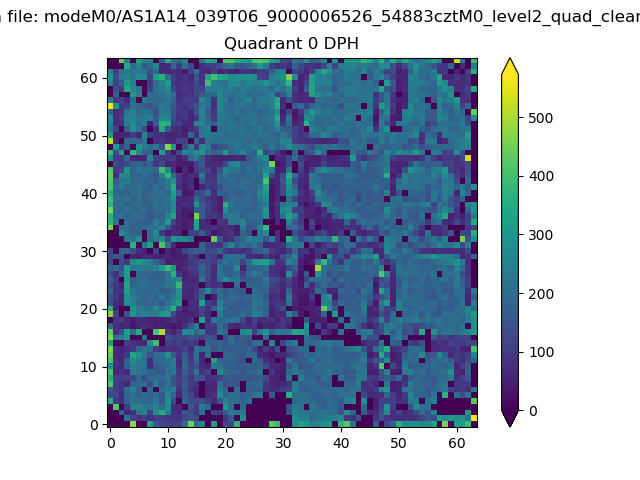 |
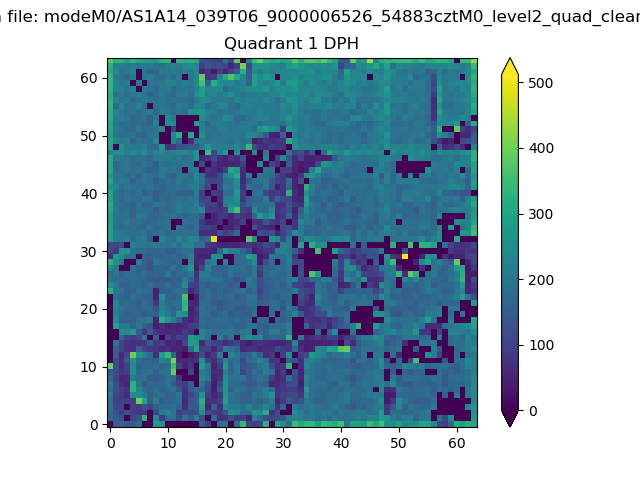 |
Quadrant B |
|---|---|---|---|
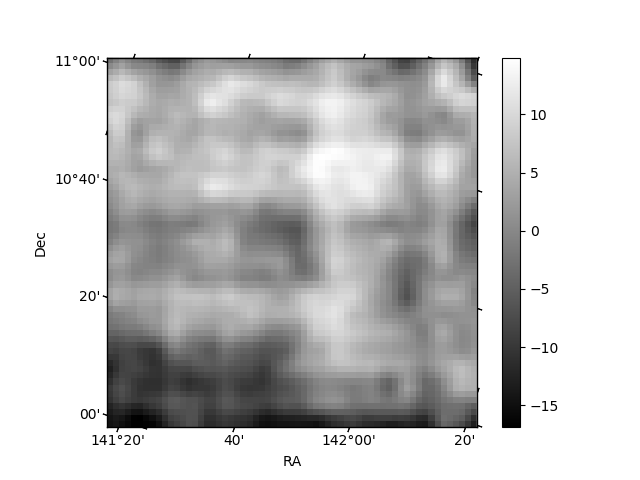
| Quadrant D | 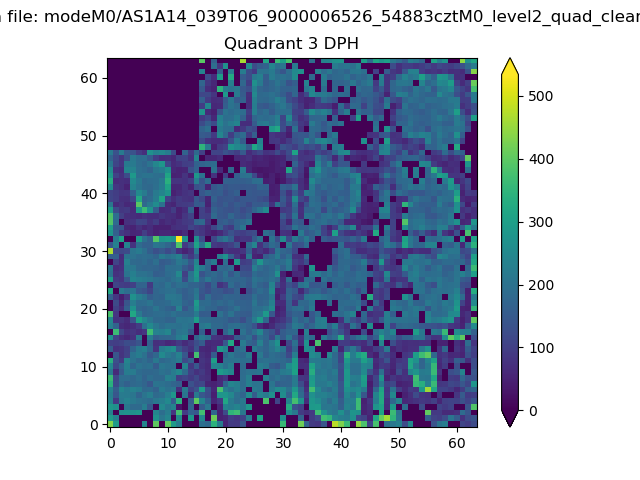 |
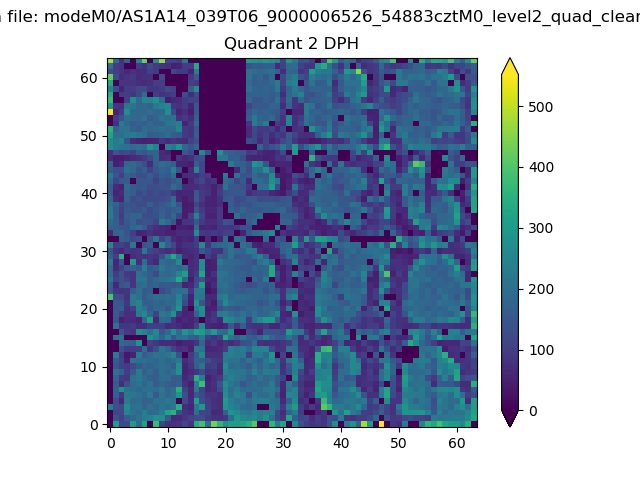 |
Quadrant C |
| Plot type | Count rate plots | Images |
|---|---|---|
| Comparison with Poisson distribution Blue bars denote a histogram of data divided into 1 sec bins. Red curve is a Poisson curve with rate = median count rate of data. |
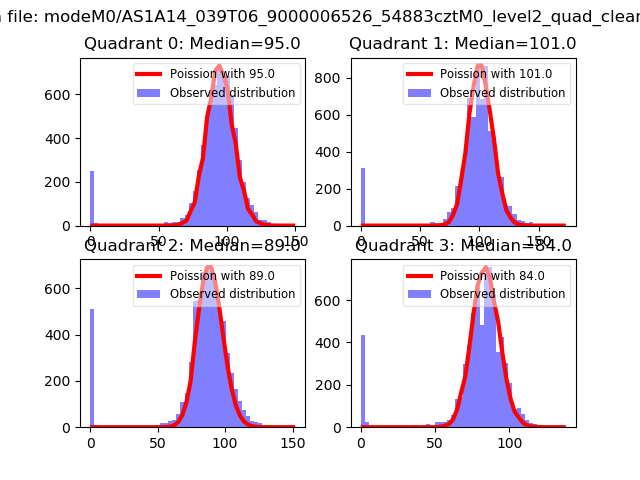 |
 |
| Quadrant-wise count rates Data is divided into 100 sec bins |
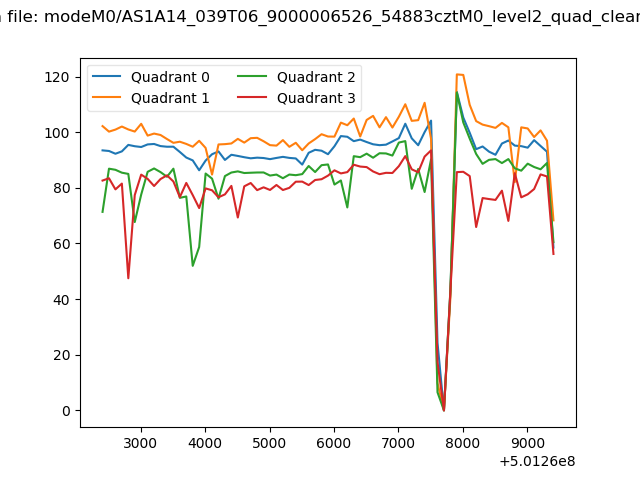 |
|
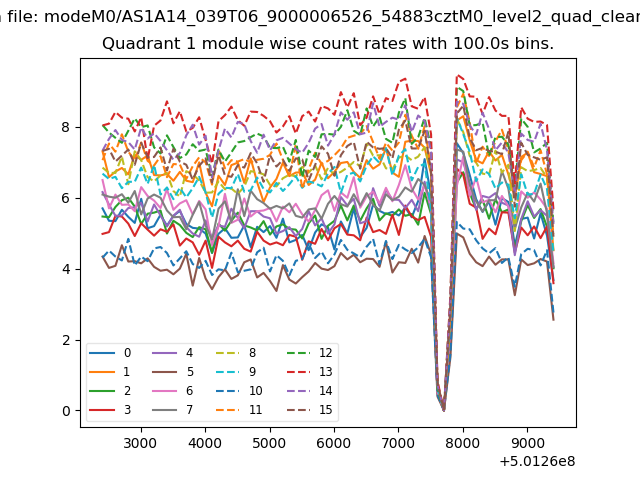
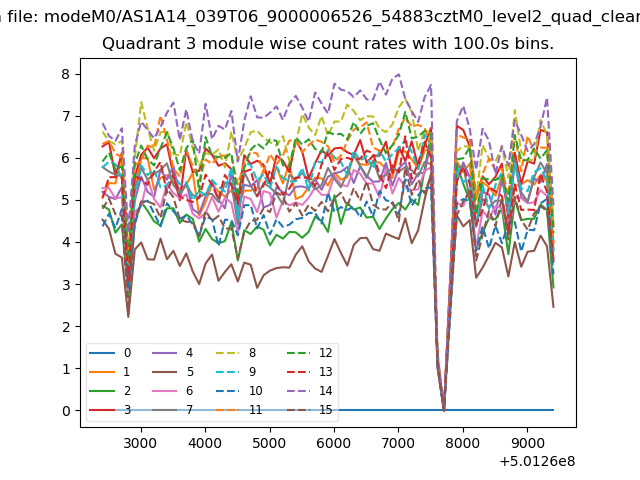
| Module-wise count rates for Quadrant A Data is divided into 100 sec bins |
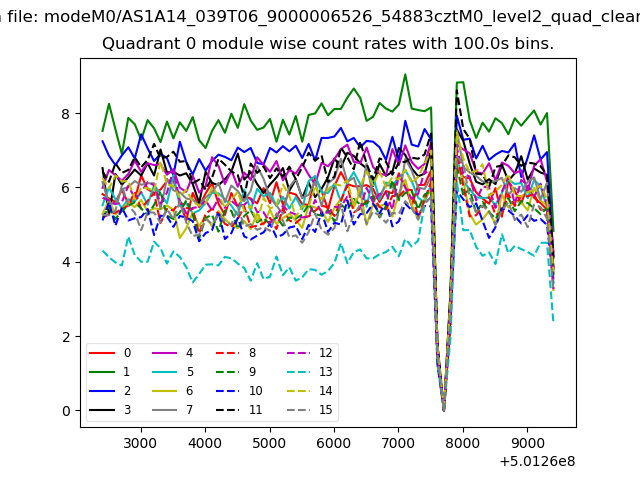 |
 |
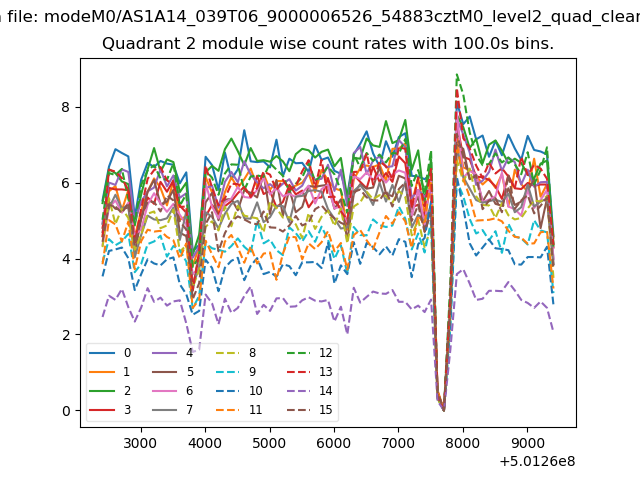
| Module-wise count rates for Quadrant B Data is divided into 100 sec bins |
 |
 |
| Module-wise count rates for Quadrant C Data is divided into 100 sec bins |
 |
 |
| Module-wise count rates for Quadrant D Data is divided into 100 sec bins |
 |
 |
| Parameter | Plot |
|---|---|
| CZT HV Monitor | 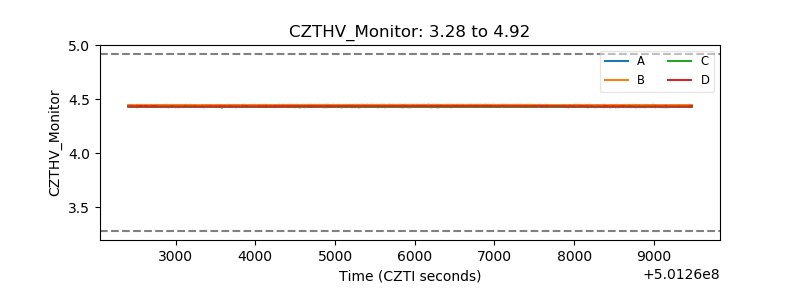 |
| D_VDD | 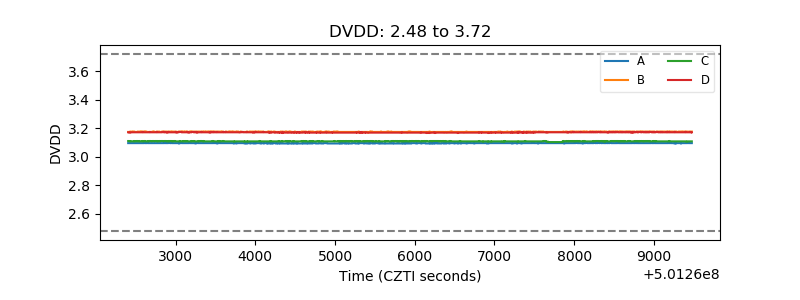 |
| Temperature 1 | 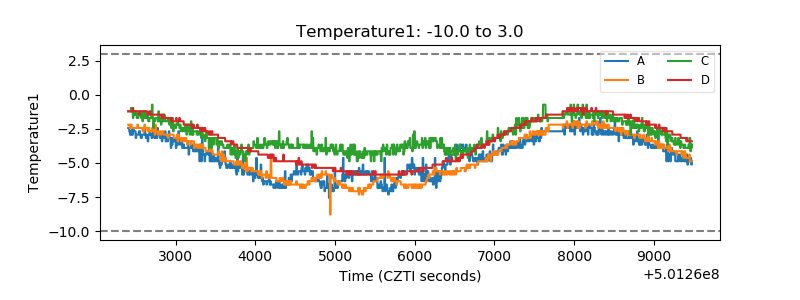 |
| Veto HV Monitor | 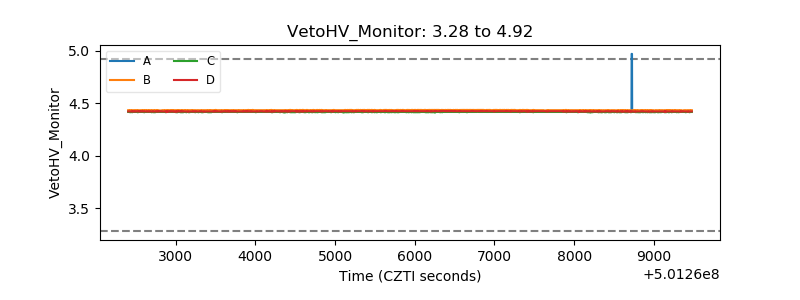 |
| Veto LLD | 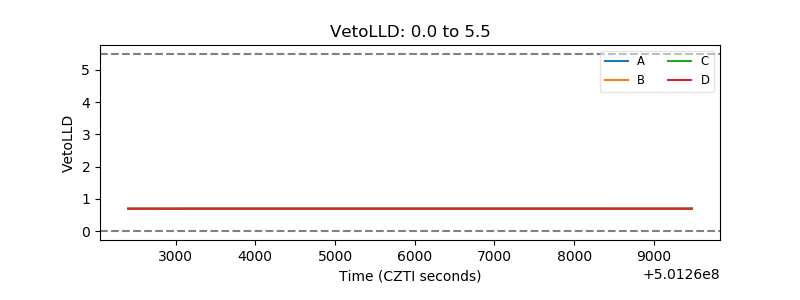 |
| Alpha Counter | 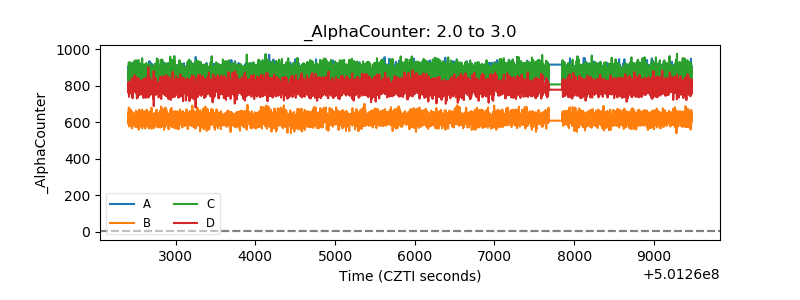 |
| _CPM_Rate | 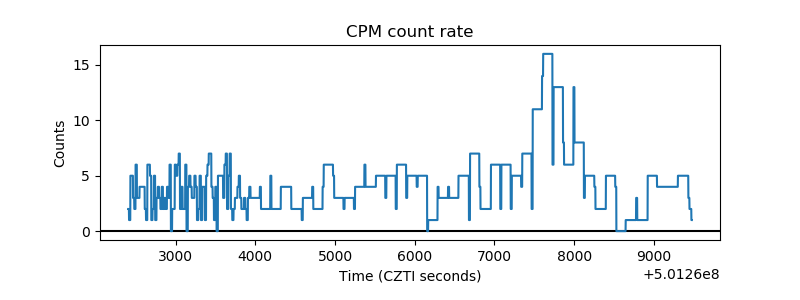 |
| CZT Counter | 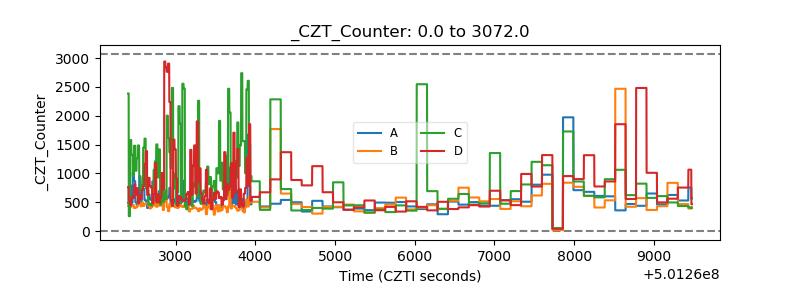 |
| +2.5 Volts monitor |  |
| +5 Volts monitor |  |
| _ROLL_ROT | 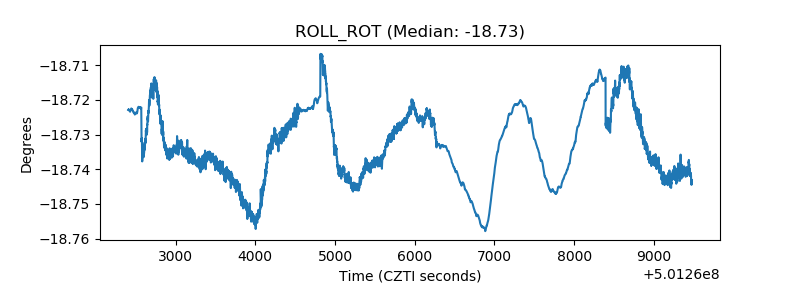 |
| _Roll_DEC | 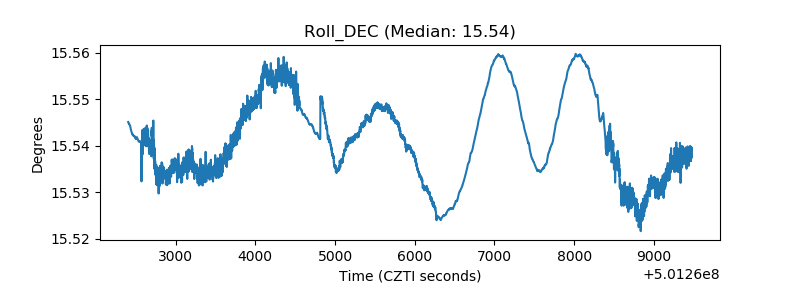 |
| _Roll_RA | 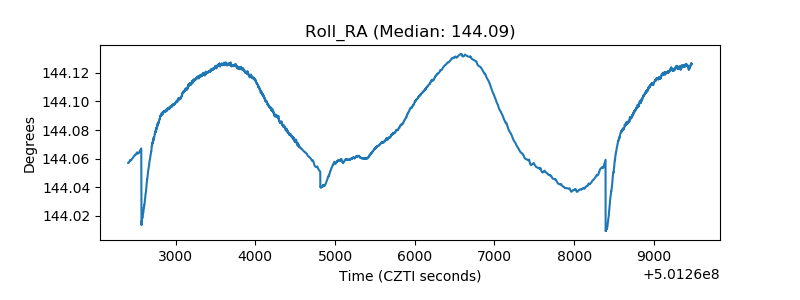 |
| Veto Counter | 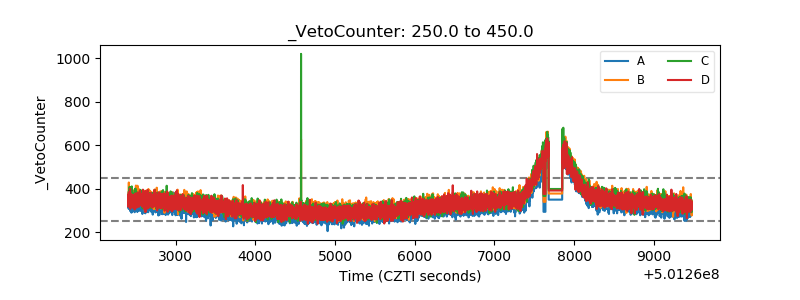 |