| Param | Original file | Final file |
|---|---|---|
| Filename | modeM0/AS1A14_039T06_9000006526_54885cztM0_level2.fits | modeM0/AS1A14_039T06_9000006526_54885cztM0_level2_quad_clean.evt |
| Size (bytes) | 609,595,200 | 127,327,680 |
| Size | 581.4 MB | 121.4 MB |
| Events in quadrant A | 4,439,195 | 848,284 |
| Events in quadrant B | 4,932,718 | 888,590 |
| Events in quadrant C | 5,740,892 | 780,696 |
| Events in quadrant D | 6,764,041 | 721,600 |
| Mode M0 | |||
|---|---|---|---|
| Quadrant | BADHDUFLAG | Total packets | Discarded packets |
| A | 0 | 19643 | 4 |
| B | 0 | 21209 | 4 |
| C | 0 | 23465 | 5 |
| D | 0 | 26549 | 0 |
| Mode SS | |||
|---|---|---|---|
| Quadrant | BADHDUFLAG | Total packets | Discarded packets |
| A | 0 | 178 | 0 |
| B | 0 | 178 | 0 |
| C | 0 | 178 | 0 |
| D | 0 | 178 | 0 |
| Quadrant | Total seconds | Saturated seconds | Saturation percentage |
|---|---|---|---|
| A | 8875 | 30 | 0.338028% |
| B | 8875 | 257 | 2.895775% |
| C | 8874 | 362 | 4.079333% |
| D | 8877 | 590 | 6.646390% |
Noise dominated data is calculated using 1-second bins in cleaned event files. If a bin has >2000 counts, and if more than 50% of those come from <1% of pixels, then it is considered to be noise-dominated and hence unusable.
| Quadrant | # 1 sec bins | Bins with >0 counts | Bins with >2000 counts | High rate bins dominated by noise | Noise dominated (total time) | Noise dominated (detector-on time) | Marked lightcurve |
|---|---|---|---|---|---|---|---|
| A | 8877 | 8876 | 9 | 9 | 0.10% | 0.10% | 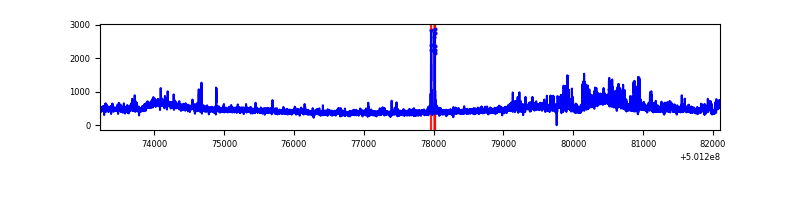 |
| B | 8878 | 8877 | 161 | 161 | 1.81% | 1.81% | 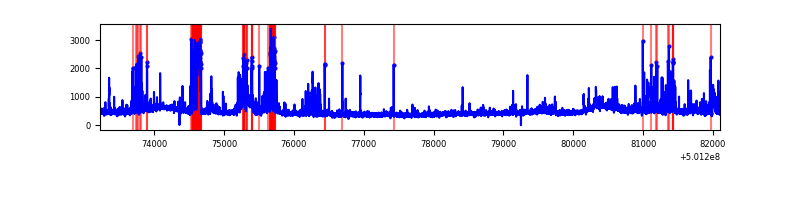 |
| C | 8877 | 8876 | 318 | 318 | 3.58% | 3.58% |  |
| D | 8877 | 8877 | 438 | 438 | 4.93% | 4.93% | 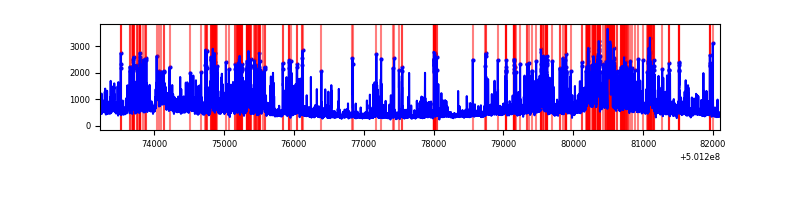 |
Top three noisy pixels from each quadrant. If the there are fewer than three noisy pixels in the level2.evt file, extra rows are filled as -1
| Pixel properties | Quadrant properties | ||||||
|---|---|---|---|---|---|---|---|
| Quadrant | DetID | PixID | Counts | Sigma | Mean | Median | Sigma |
| A | 3 | 14 | 521559 | 2152.79 | 980 | 954 | 241.8 |
| A | 0 | 8 | 43882 | 177.51 | 980 | 954 | 241.8 |
| A | 13 | 254 | 25560 | 101.75 | 980 | 954 | 241.8 |
| B | 10 | 247 | 448806 | 2178.69 | 956 | 921 | 205.6 |
| B | 5 | 185 | 310233 | 1504.62 | 956 | 921 | 205.6 |
| B | 2 | 249 | 172777 | 835.98 | 956 | 921 | 205.6 |
| C | 4 | 5 | 613507 | 2403.71 | 938 | 931 | 254.8 |
| C | 15 | 147 | 481632 | 1886.24 | 938 | 931 | 254.8 |
| C | 12 | 252 | 467586 | 1831.12 | 938 | 931 | 254.8 |
| D | 15 | 58 | 495088 | 1876.64 | 924 | 884 | 263.3 |
| D | 6 | 239 | 491495 | 1863.0 | 924 | 884 | 263.3 |
| D | 10 | 181 | 481420 | 1824.74 | 924 | 884 | 263.3 |
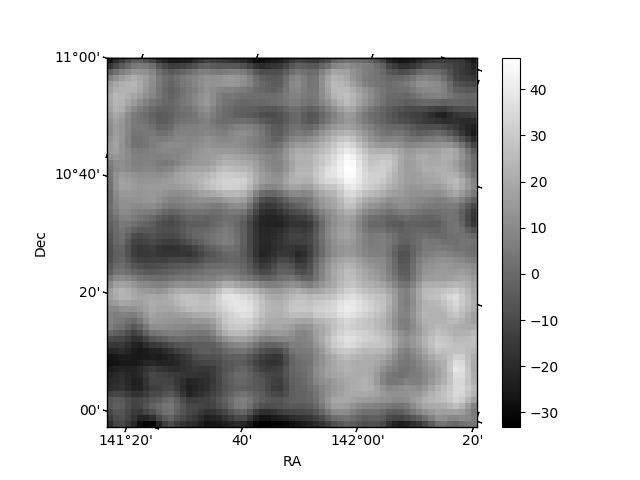
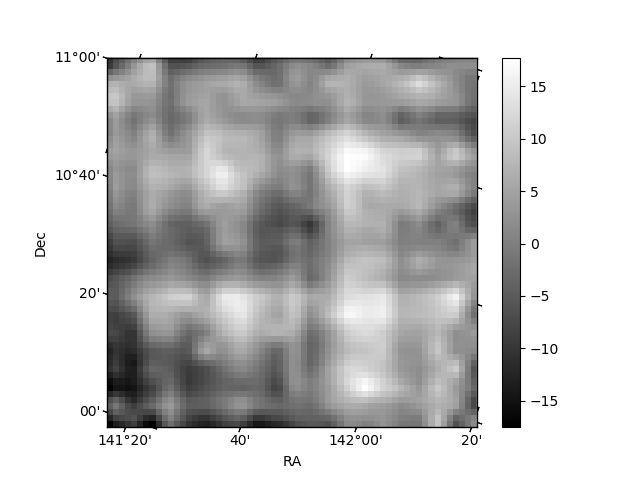
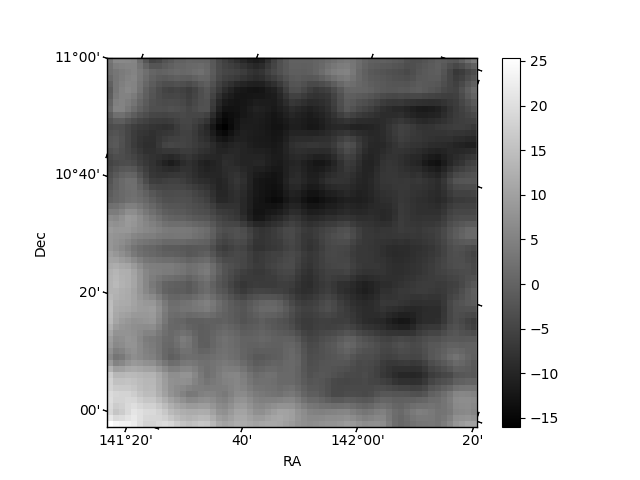
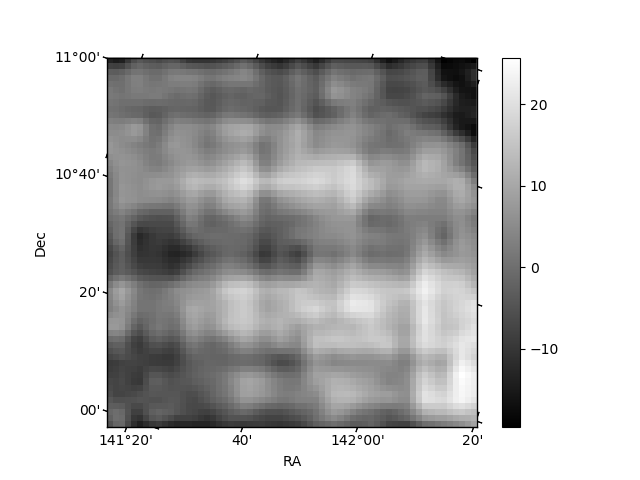
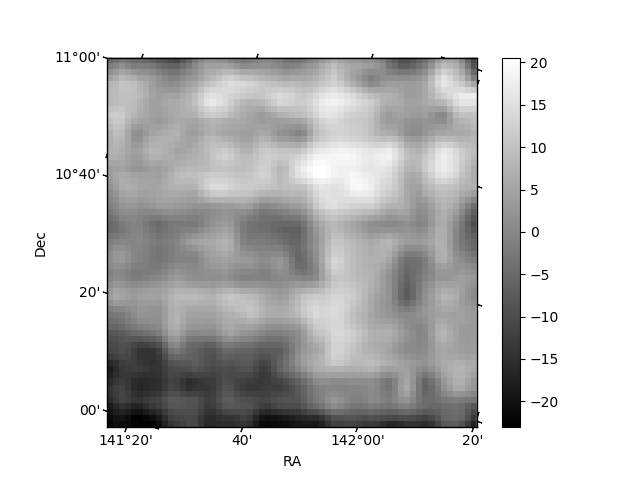
Histogram calculated using DETX and DETY for each event in the final _common_clean file
| Quadrant A | 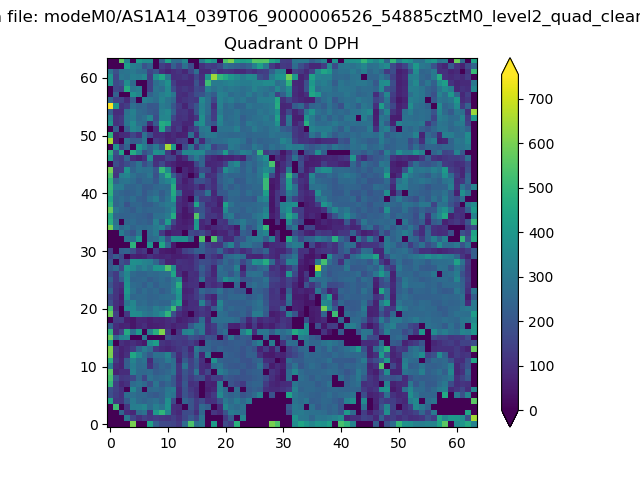 |
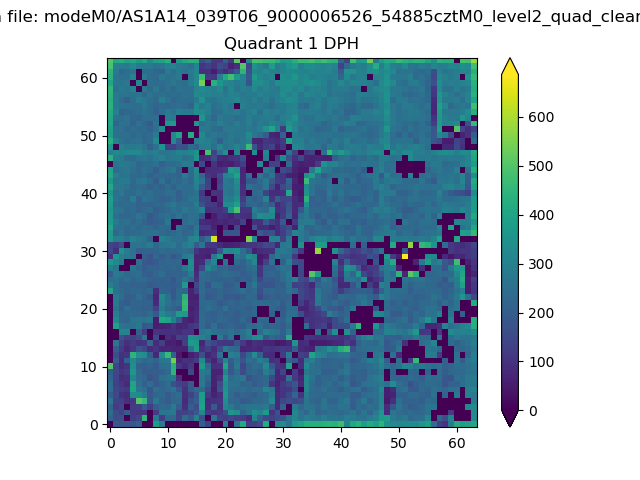 |
Quadrant B |
|---|---|---|---|
| Quadrant D | 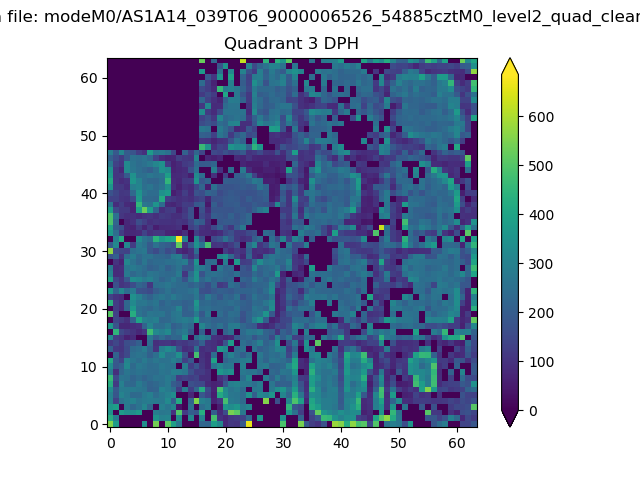 |
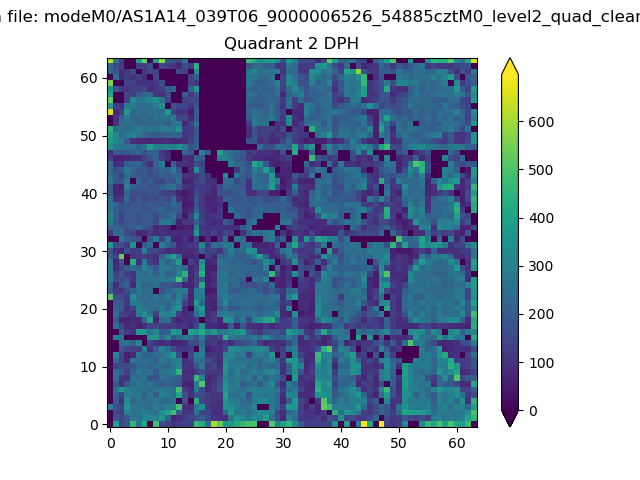 |
Quadrant C |
| Plot type | Count rate plots | Images |
|---|---|---|
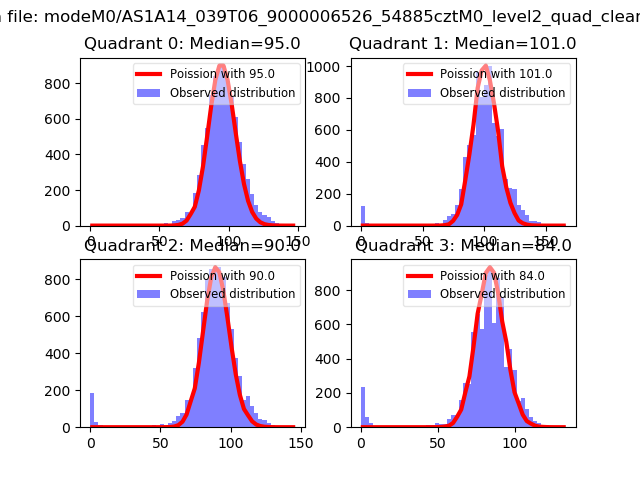
| Comparison with Poisson distribution Blue bars denote a histogram of data divided into 1 sec bins. Red curve is a Poisson curve with rate = median count rate of data. |
 |
 |
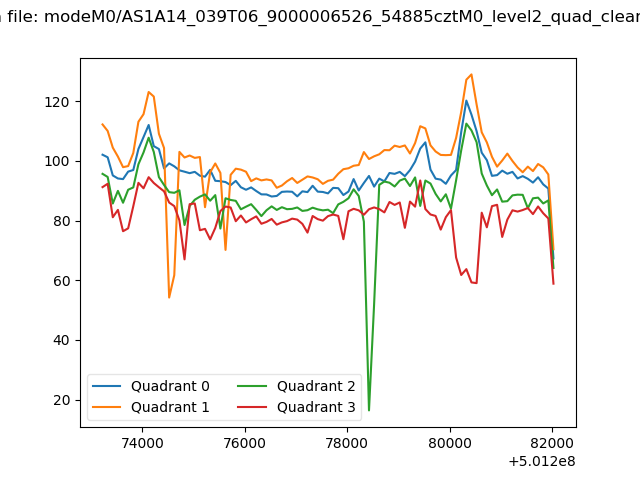
| Quadrant-wise count rates Data is divided into 100 sec bins |
 |
|
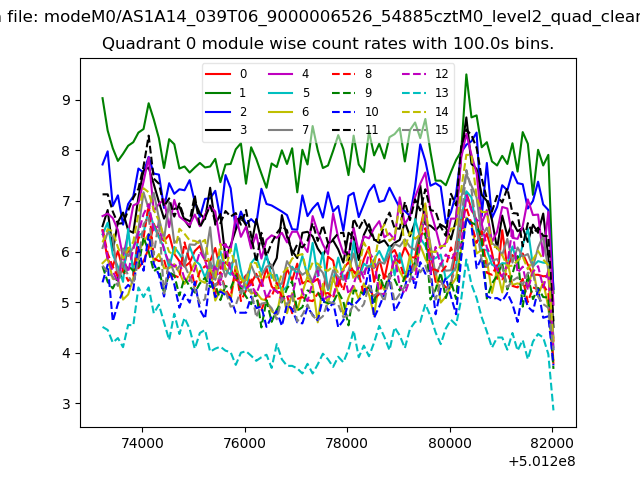
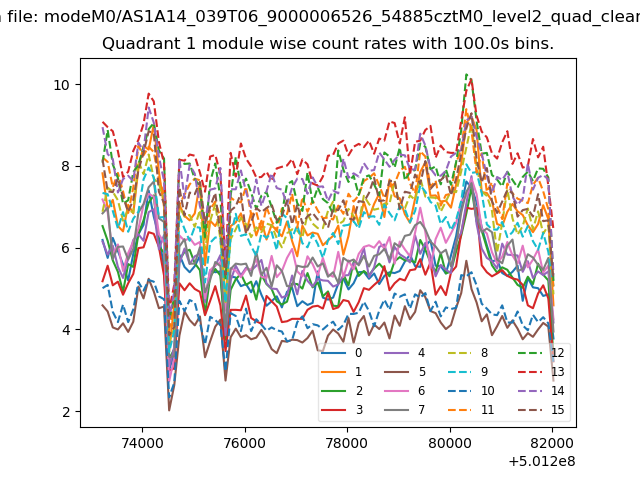
| Module-wise count rates for Quadrant A Data is divided into 100 sec bins |
 |
 |
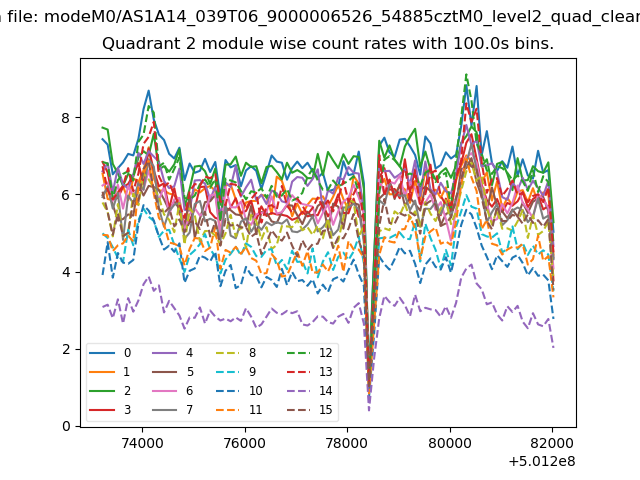
| Module-wise count rates for Quadrant B Data is divided into 100 sec bins |
 |
 |
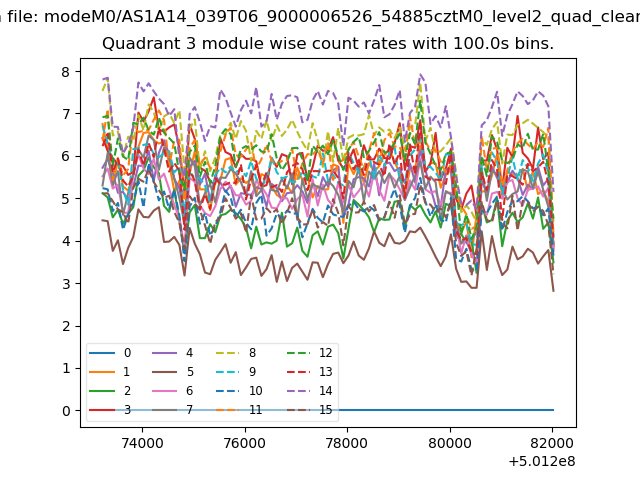
| Module-wise count rates for Quadrant C Data is divided into 100 sec bins |
 |
 |
| Module-wise count rates for Quadrant D Data is divided into 100 sec bins |
 |
 |
| Parameter | Plot |
|---|---|
| CZT HV Monitor | 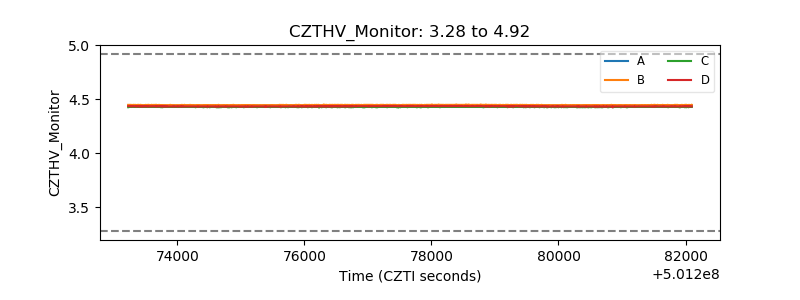 |
| D_VDD | 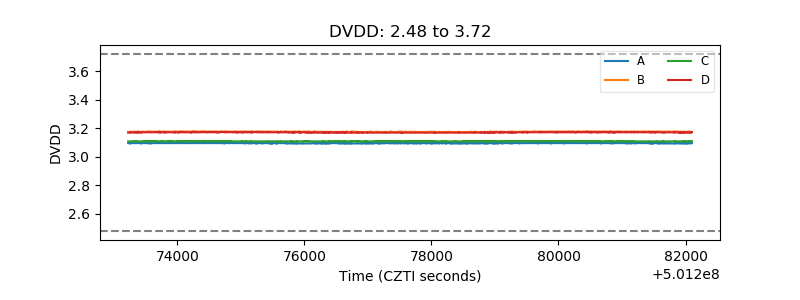 |
| Temperature 1 | 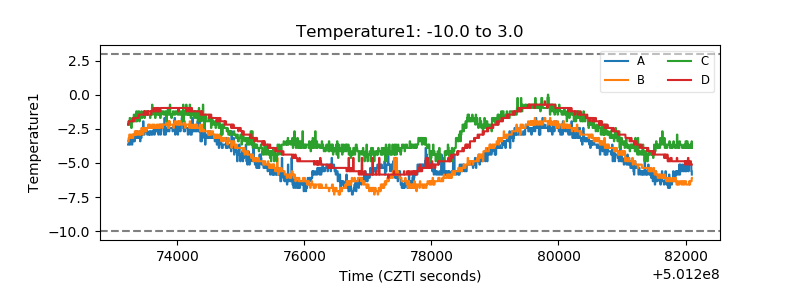 |
| Veto HV Monitor | 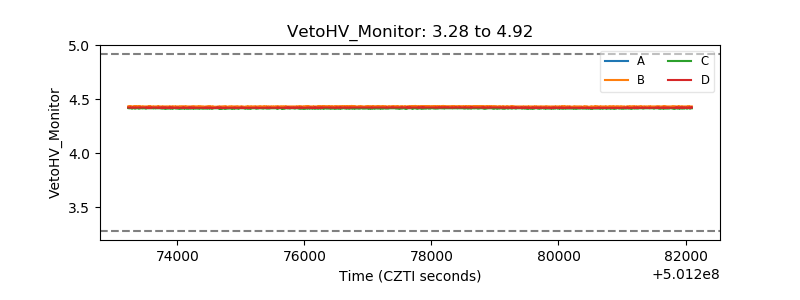 |
| Veto LLD | 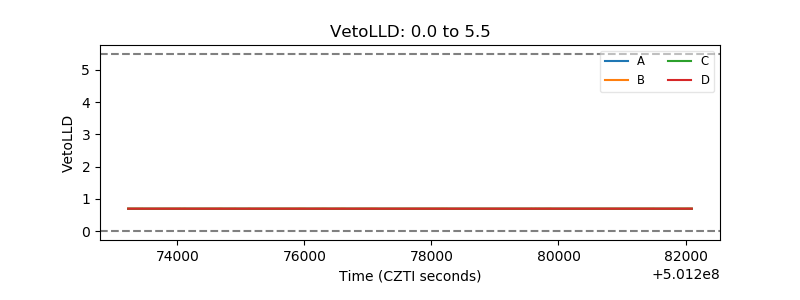 |
| Alpha Counter | 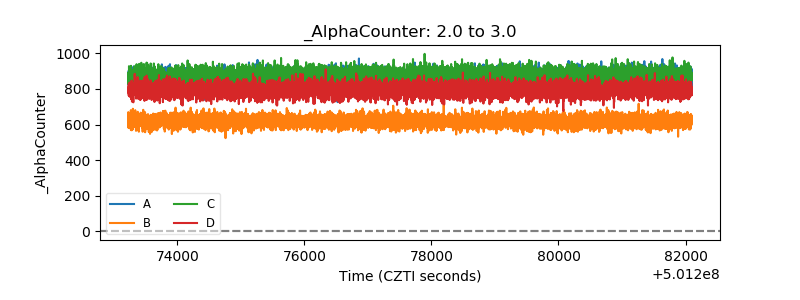 |
| _CPM_Rate | 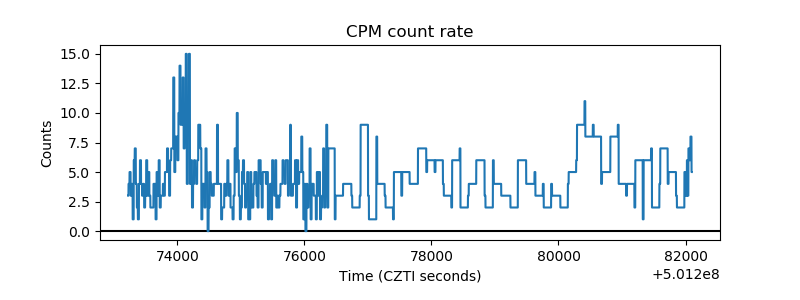 |
| CZT Counter | 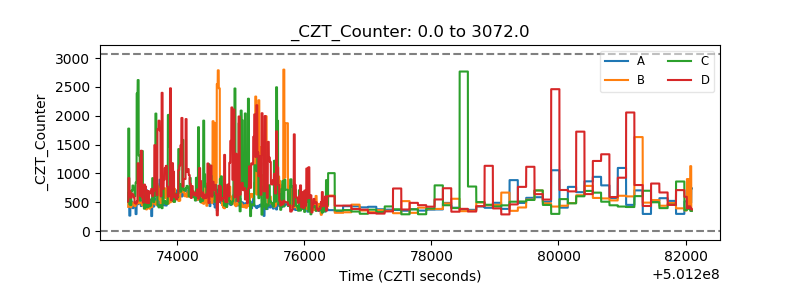 |
| +2.5 Volts monitor | 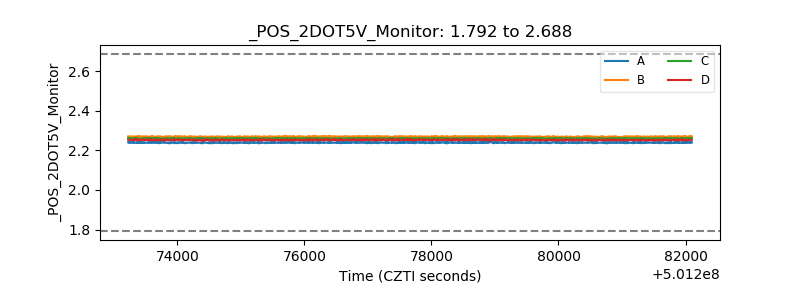 |
| +5 Volts monitor |  |
| _ROLL_ROT | 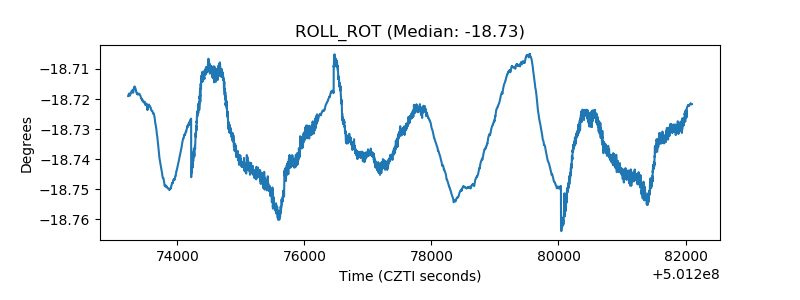 |
| _Roll_DEC | 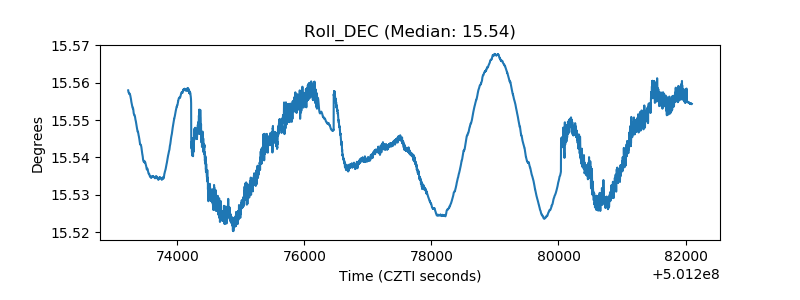 |
| _Roll_RA | 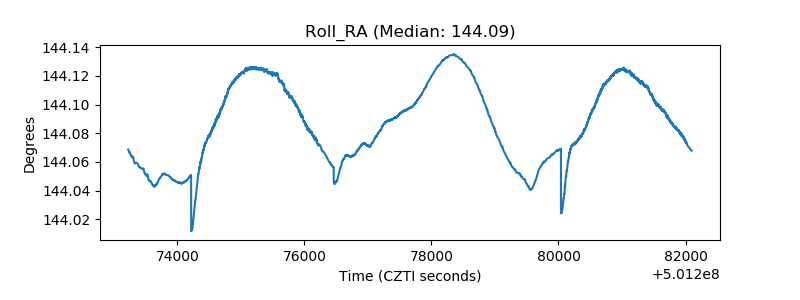 |
| Veto Counter | 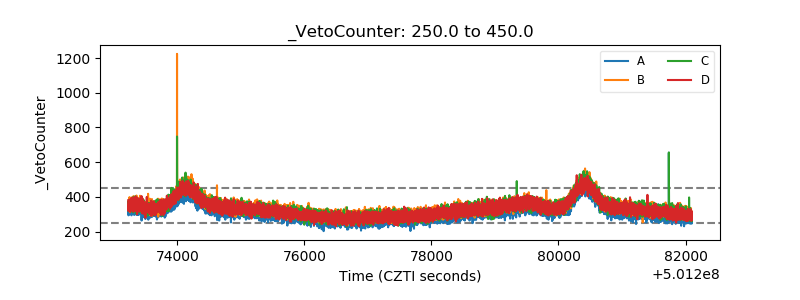 |