| Param | Original file | Final file |
|---|---|---|
| Filename | modeM0/AS1A14_039T06_9000006526_54888cztM0_level2.fits | modeM0/AS1A14_039T06_9000006526_54888cztM0_level2_quad_clean.evt |
| Size (bytes) | 810,267,840 | 174,784,320 |
| Size | 772.7 MB | 166.7 MB |
| Events in quadrant A | 7,340,677 | 1,137,238 |
| Events in quadrant B | 6,378,969 | 1,232,475 |
| Events in quadrant C | 6,724,544 | 1,076,267 |
| Events in quadrant D | 8,592,821 | 992,536 |
| Mode M9 | |||
|---|---|---|---|
| Quadrant | BADHDUFLAG | Total packets | Discarded packets |
| A | 0 | 2 | 0 |
| B | 0 | 2 | 0 |
| C | 0 | 2 | 0 |
| D | 0 | 2 | 0 |
| Mode M0 | |||
|---|---|---|---|
| Quadrant | BADHDUFLAG | Total packets | Discarded packets |
| A | 0 | 30655 | 42 |
| B | 0 | 28118 | 39 |
| C | 0 | 29216 | 42 |
| D | 0 | 34650 | 64 |
| Mode SS | |||
|---|---|---|---|
| Quadrant | BADHDUFLAG | Total packets | Discarded packets |
| A | 0 | 250 | 0 |
| B | 0 | 250 | 0 |
| C | 0 | 250 | 0 |
| D | 0 | 250 | 0 |
| Quadrant | Total seconds | Saturated seconds | Saturation percentage |
|---|---|---|---|
| A | 12343 | 267 | 2.163169% |
| B | 12341 | 189 | 1.531480% |
| C | 12341 | 319 | 2.584880% |
| D | 12338 | 716 | 5.803210% |
Noise dominated data is calculated using 1-second bins in cleaned event files. If a bin has >2000 counts, and if more than 50% of those come from <1% of pixels, then it is considered to be noise-dominated and hence unusable.
| Quadrant | # 1 sec bins | Bins with >0 counts | Bins with >2000 counts | High rate bins dominated by noise | Noise dominated (total time) | Noise dominated (detector-on time) | Marked lightcurve |
|---|---|---|---|---|---|---|---|
| A | 12567 | 12358 | 97 | 97 | 0.77% | 0.78% |  |
| B | 12567 | 12356 | 73 | 73 | 0.58% | 0.59% |  |
| C | 12568 | 12356 | 266 | 266 | 2.12% | 2.15% | 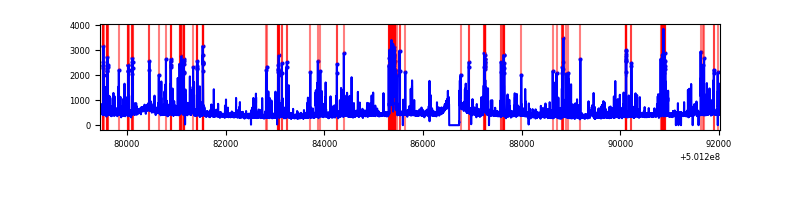 |
| D | 12568 | 12354 | 490 | 490 | 3.90% | 3.97% | 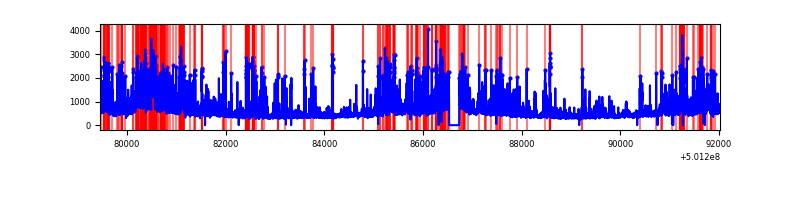 |
Top three noisy pixels from each quadrant. If the there are fewer than three noisy pixels in the level2.evt file, extra rows are filled as -1
| Pixel properties | Quadrant properties | ||||||
|---|---|---|---|---|---|---|---|
| Quadrant | DetID | PixID | Counts | Sigma | Mean | Median | Sigma |
| A | 3 | 14 | 1553441 | 4751.81 | 1316 | 1280 | 326.6 |
| A | 0 | 8 | 292483 | 891.49 | 1316 | 1280 | 326.6 |
| A | 7 | 14 | 172557 | 524.35 | 1316 | 1280 | 326.6 |
| B | 2 | 249 | 615171 | 2186.34 | 1305 | 1254 | 280.8 |
| B | 5 | 185 | 256786 | 910.02 | 1305 | 1254 | 280.8 |
| B | 7 | 0 | 122770 | 432.75 | 1305 | 1254 | 280.8 |
| C | 15 | 147 | 654620 | 1903.11 | 1268 | 1260 | 343.3 |
| C | 14 | 254 | 308598 | 895.22 | 1268 | 1260 | 343.3 |
| C | 4 | 5 | 290381 | 842.15 | 1268 | 1260 | 343.3 |
| D | 11 | 176 | 547407 | 1545.19 | 1248 | 1194 | 353.5 |
| D | 15 | 94 | 468363 | 1321.58 | 1248 | 1194 | 353.5 |
| D | 6 | 239 | 397822 | 1122.03 | 1248 | 1194 | 353.5 |
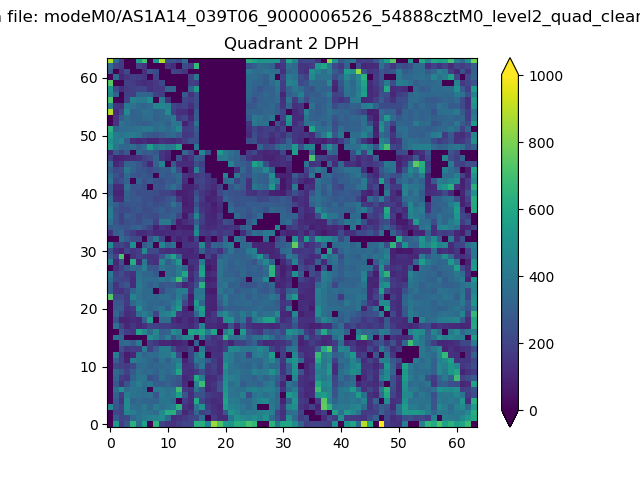
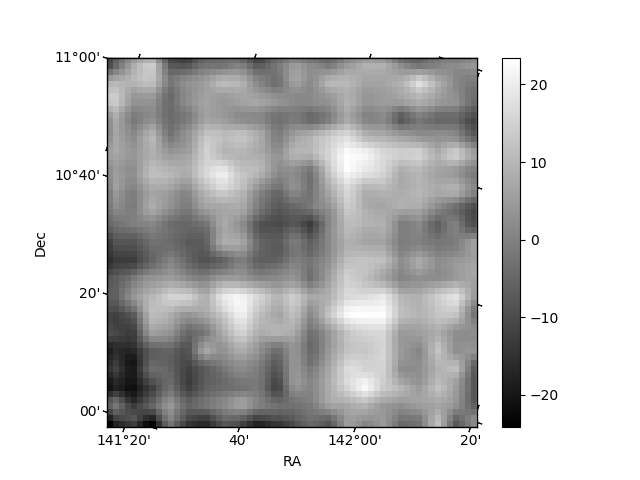
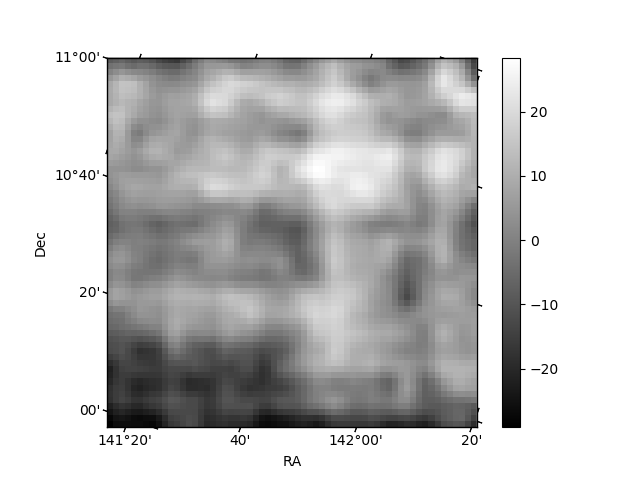
Histogram calculated using DETX and DETY for each event in the final _common_clean file
| Quadrant A | 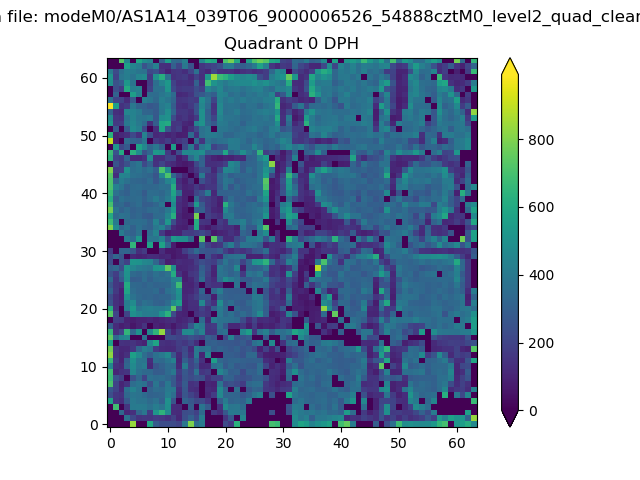 |
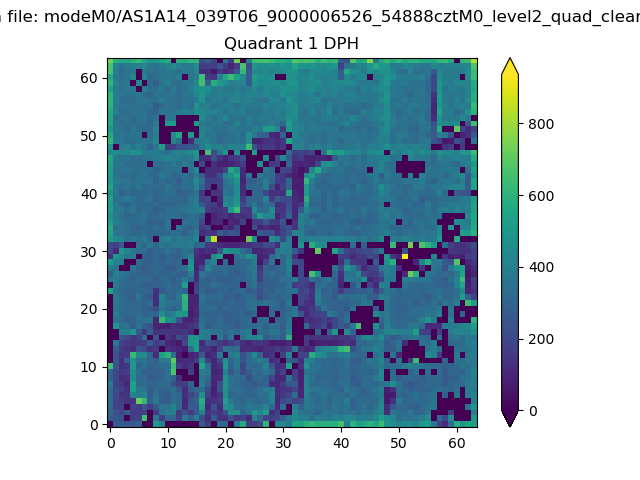 |
Quadrant B |
|---|---|---|---|
| Quadrant D | 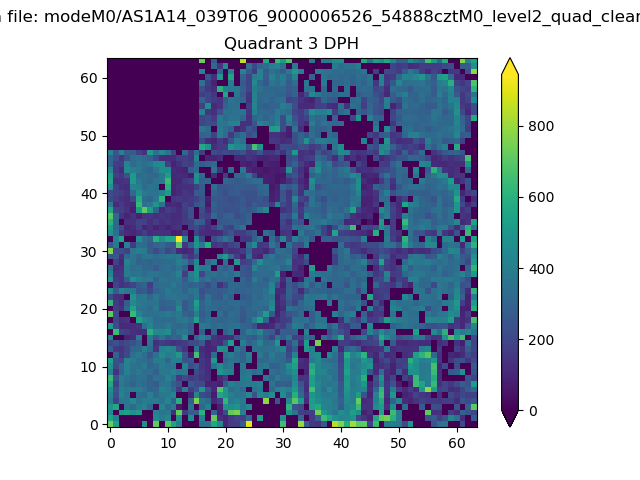 |
 |
Quadrant C |
| Plot type | Count rate plots | Images |
|---|---|---|
| Comparison with Poisson distribution Blue bars denote a histogram of data divided into 1 sec bins. Red curve is a Poisson curve with rate = median count rate of data. |
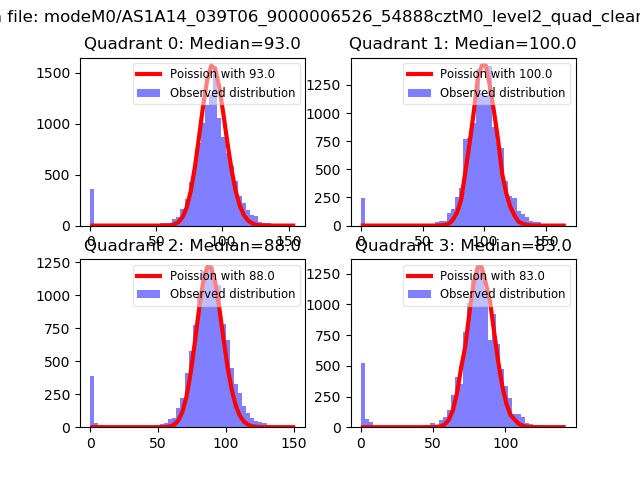 |
 |
| Quadrant-wise count rates Data is divided into 100 sec bins |
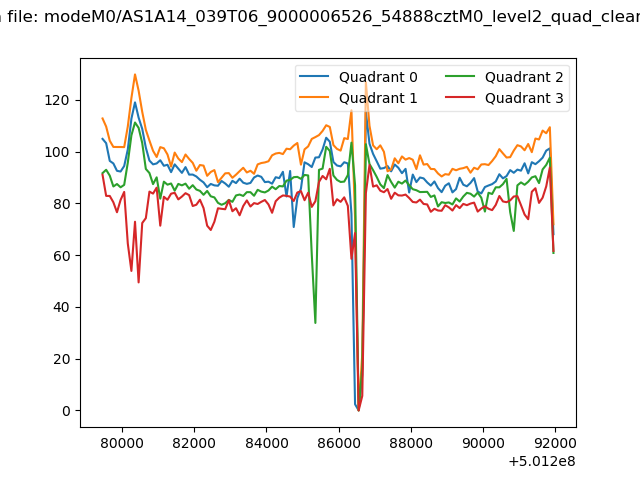 |
|
| Module-wise count rates for Quadrant A Data is divided into 100 sec bins |
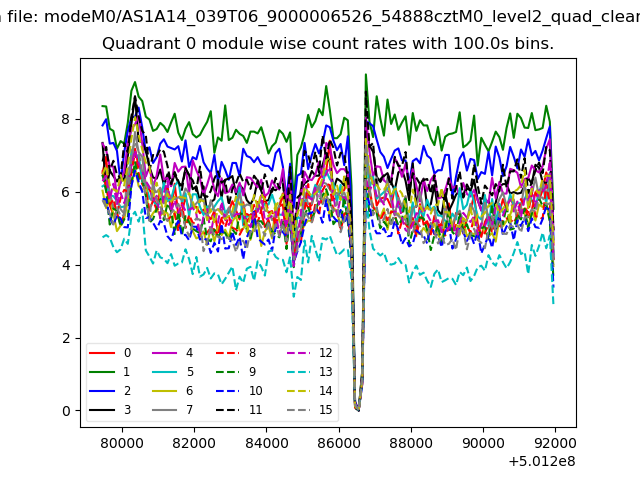 |
 |
| Module-wise count rates for Quadrant B Data is divided into 100 sec bins |
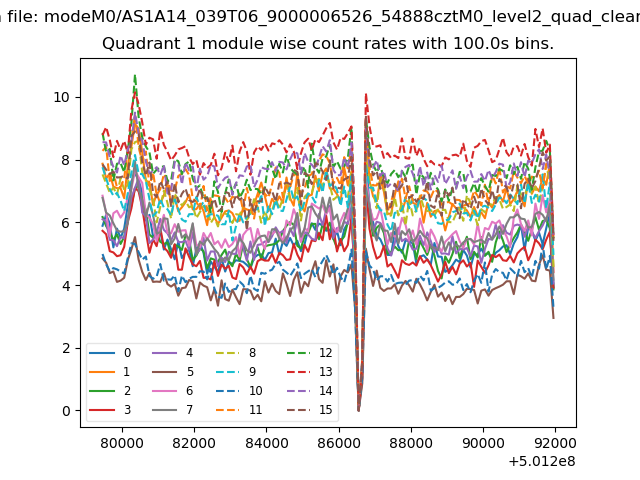 |
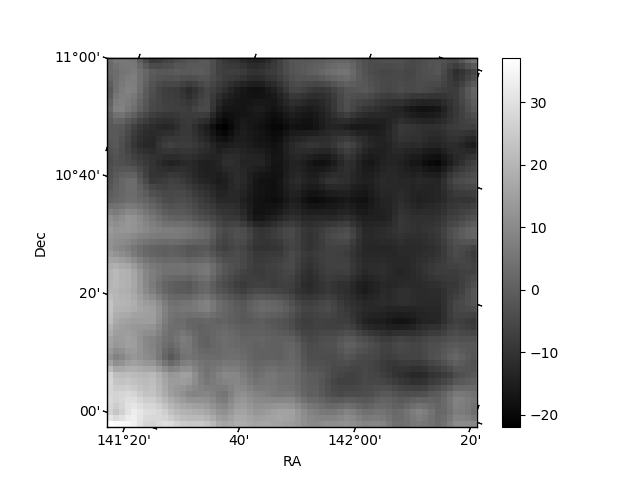 |
| Module-wise count rates for Quadrant C Data is divided into 100 sec bins |
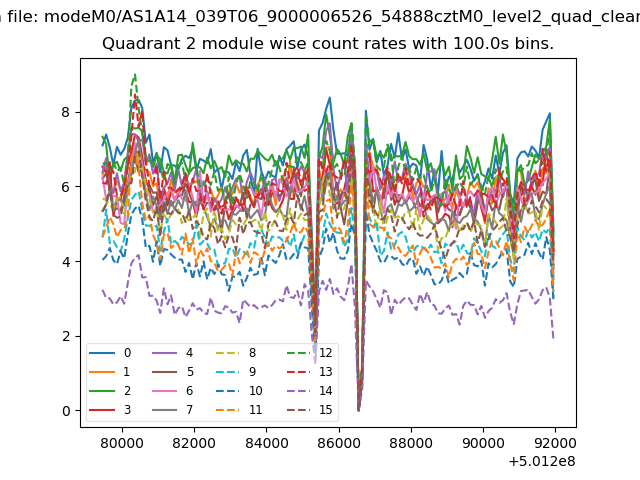 |
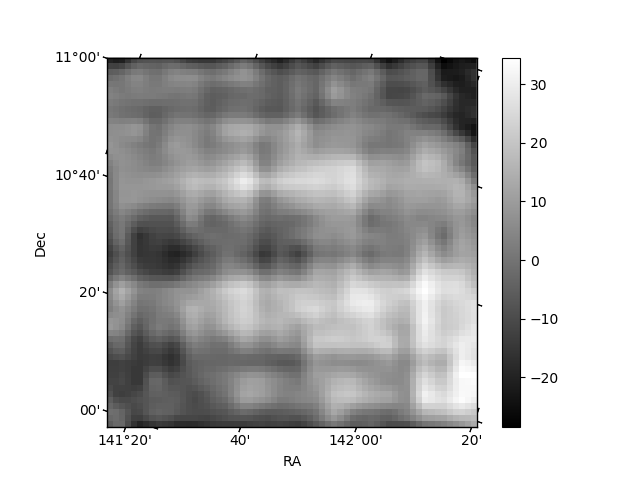 |
| Module-wise count rates for Quadrant D Data is divided into 100 sec bins |
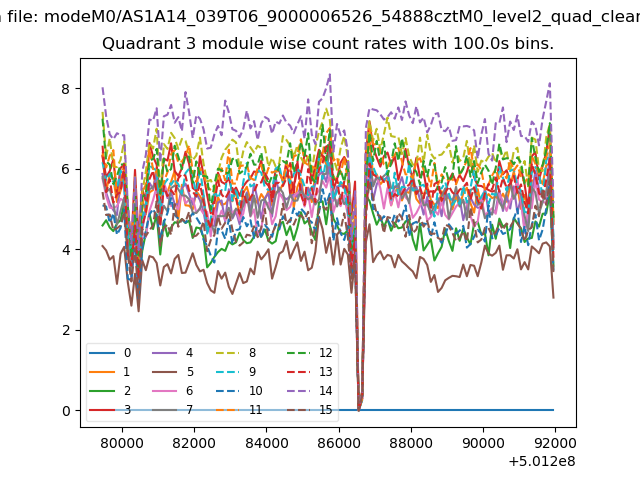 |
 |
| Parameter | Plot |
|---|---|
| CZT HV Monitor | 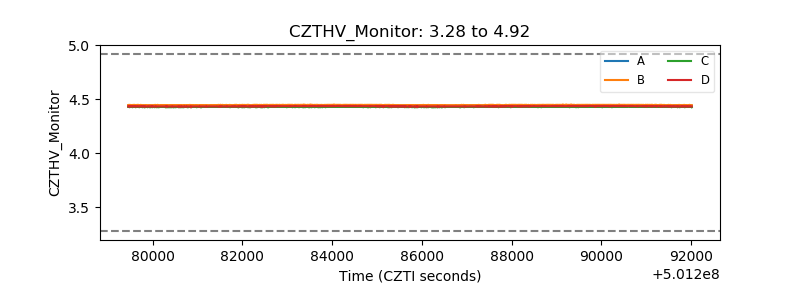 |
| D_VDD | 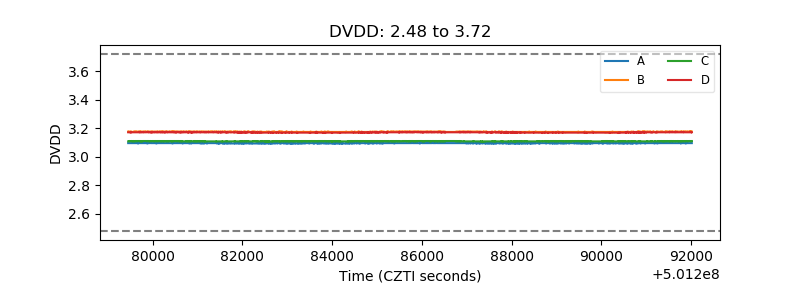 |
| Temperature 1 | 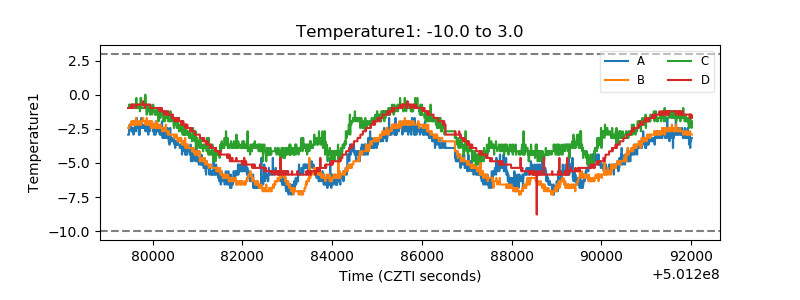 |
| Veto HV Monitor |  |
| Veto LLD | 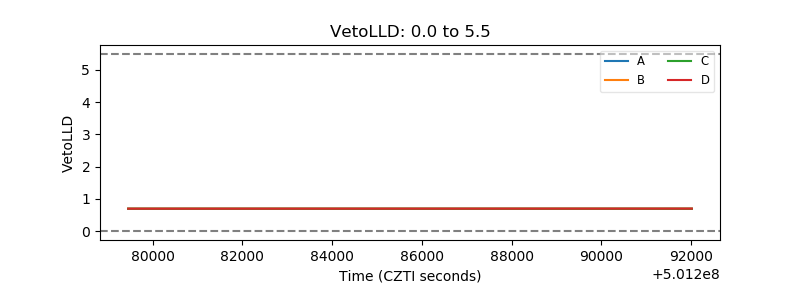 |
| Alpha Counter | 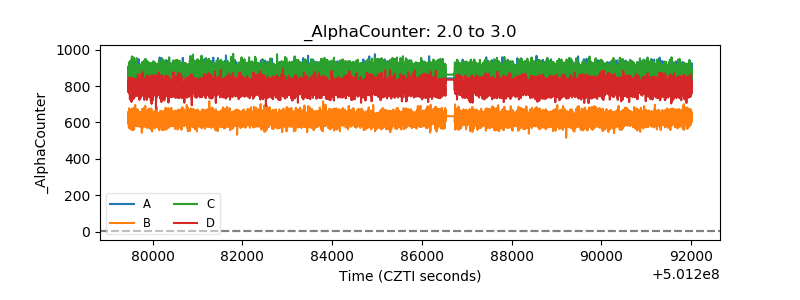 |
| _CPM_Rate | 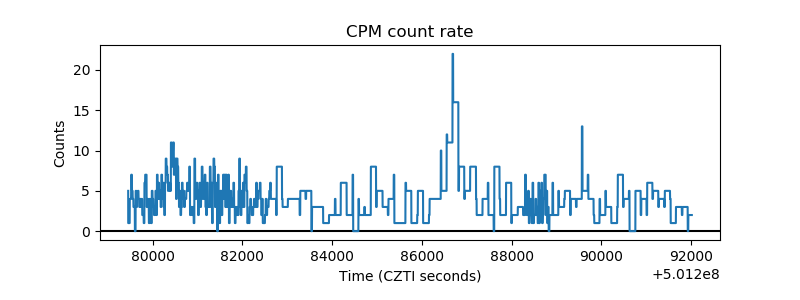 |
| CZT Counter | 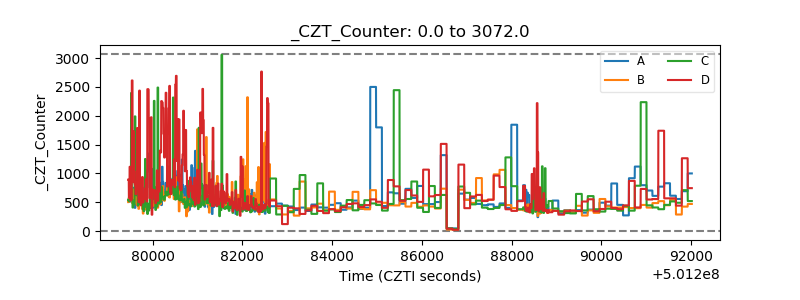 |
| +2.5 Volts monitor |  |
| +5 Volts monitor |  |
| _ROLL_ROT | 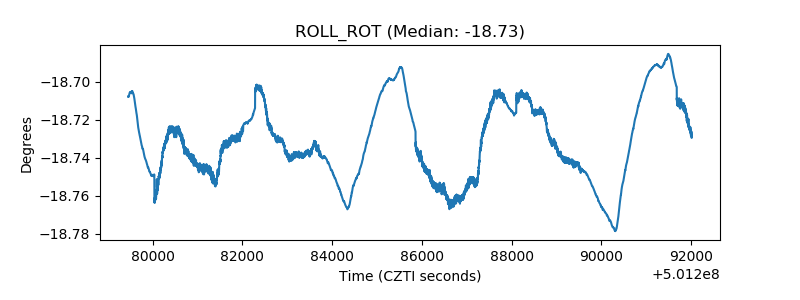 |
| _Roll_DEC | 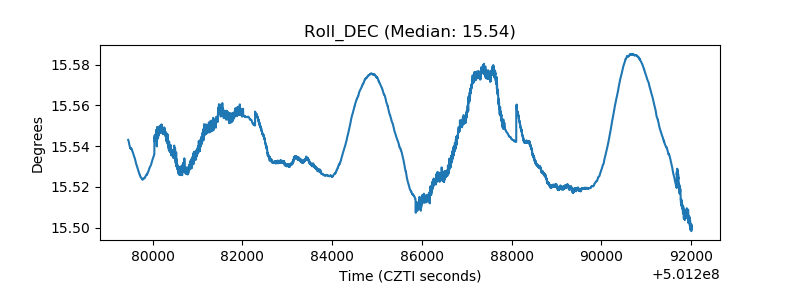 |
| _Roll_RA | 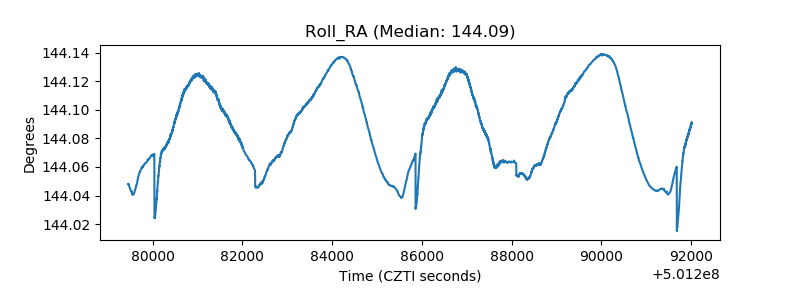 |
| Veto Counter | 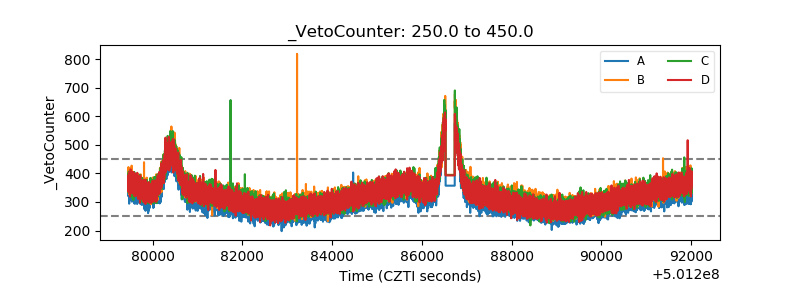 |