| Param | Original file | Final file |
|---|---|---|
| Filename | modeM0/AS1A14_039T06_9000006526_54889cztM0_level2.fits | modeM0/AS1A14_039T06_9000006526_54889cztM0_level2_quad_clean.evt |
| Size (bytes) | 856,327,680 | 185,146,560 |
| Size | 816.7 MB | 176.6 MB |
| Events in quadrant A | 6,723,758 | 1,222,548 |
| Events in quadrant B | 6,300,084 | 1,274,172 |
| Events in quadrant C | 8,779,893 | 1,117,778 |
| Events in quadrant D | 8,863,196 | 1,071,443 |
| Mode M9 | |||
|---|---|---|---|
| Quadrant | BADHDUFLAG | Total packets | Discarded packets |
| A | 0 | 18 | 0 |
| B | 0 | 18 | 0 |
| C | 0 | 18 | 0 |
| D | 0 | 18 | 0 |
| Mode M0 | |||
|---|---|---|---|
| Quadrant | BADHDUFLAG | Total packets | Discarded packets |
| A | 0 | 29520 | 10 |
| B | 0 | 29050 | 11 |
| C | 0 | 35749 | 19 |
| D | 0 | 35955 | 9 |
| Mode SS | |||
|---|---|---|---|
| Quadrant | BADHDUFLAG | Total packets | Discarded packets |
| A | 0 | 274 | 0 |
| B | 0 | 274 | 0 |
| C | 0 | 274 | 0 |
| D | 0 | 274 | 0 |
| Quadrant | Total seconds | Saturated seconds | Saturation percentage |
|---|---|---|---|
| A | 13306 | 119 | 0.894333% |
| B | 13307 | 388 | 2.915759% |
| C | 13303 | 740 | 5.562655% |
| D | 13307 | 489 | 3.674758% |
Noise dominated data is calculated using 1-second bins in cleaned event files. If a bin has >2000 counts, and if more than 50% of those come from <1% of pixels, then it is considered to be noise-dominated and hence unusable.
| Quadrant | # 1 sec bins | Bins with >0 counts | Bins with >2000 counts | High rate bins dominated by noise | Noise dominated (total time) | Noise dominated (detector-on time) | Marked lightcurve |
|---|---|---|---|---|---|---|---|
| A | 15260 | 13313 | 14 | 14 | 0.09% | 0.11% | 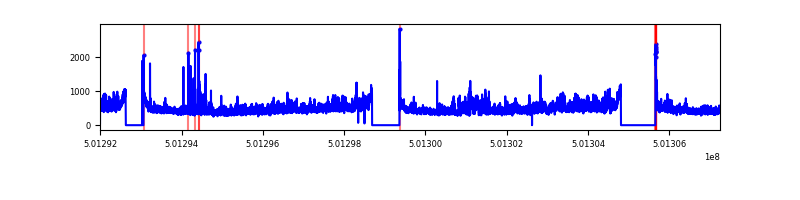 |
| B | 15261 | 13313 | 153 | 153 | 1.00% | 1.15% | 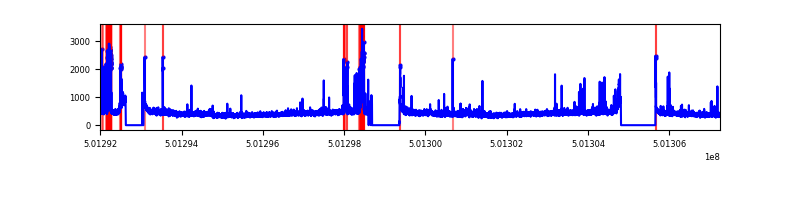 |
| C | 15261 | 13311 | 551 | 551 | 3.61% | 4.14% | 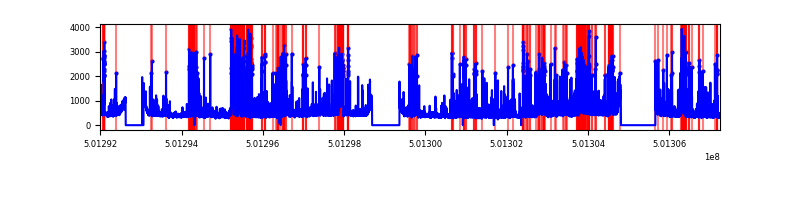 |
| D | 15261 | 13313 | 458 | 458 | 3.00% | 3.44% | 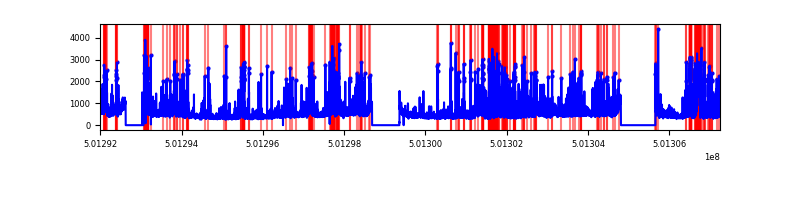 |
Top three noisy pixels from each quadrant. If the there are fewer than three noisy pixels in the level2.evt file, extra rows are filled as -1
| Pixel properties | Quadrant properties | ||||||
|---|---|---|---|---|---|---|---|
| Quadrant | DetID | PixID | Counts | Sigma | Mean | Median | Sigma |
| A | 3 | 14 | 1094763 | 3117.68 | 1413 | 1375 | 350.7 |
| A | 0 | 8 | 69122 | 193.17 | 1413 | 1375 | 350.7 |
| A | 13 | 254 | 39474 | 108.64 | 1413 | 1375 | 350.7 |
| B | 5 | 185 | 606856 | 2039.31 | 1383 | 1330 | 296.9 |
| B | 5 | 236 | 67611 | 223.22 | 1383 | 1330 | 296.9 |
| B | 12 | 111 | 37088 | 120.43 | 1383 | 1330 | 296.9 |
| C | 4 | 5 | 2083579 | 5688.68 | 1341 | 1328 | 366.0 |
| C | 14 | 254 | 407183 | 1108.79 | 1341 | 1328 | 366.0 |
| C | 6 | 223 | 379284 | 1032.57 | 1341 | 1328 | 366.0 |
| D | 8 | 160 | 758970 | 1962.61 | 1348 | 1289 | 386.1 |
| D | 15 | 94 | 618659 | 1599.16 | 1348 | 1289 | 386.1 |
| D | 10 | 181 | 565417 | 1461.25 | 1348 | 1289 | 386.1 |
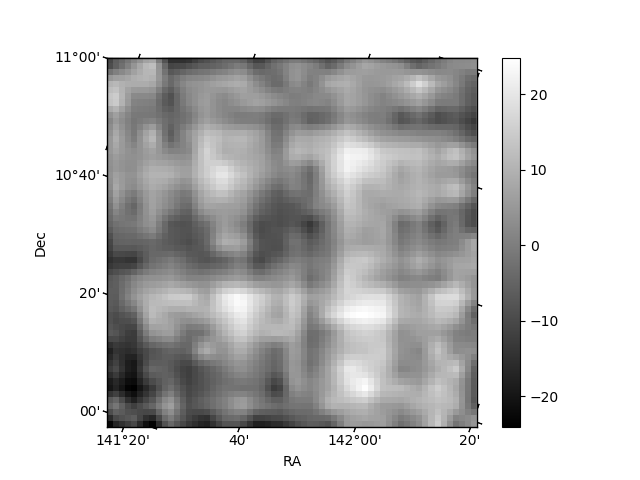
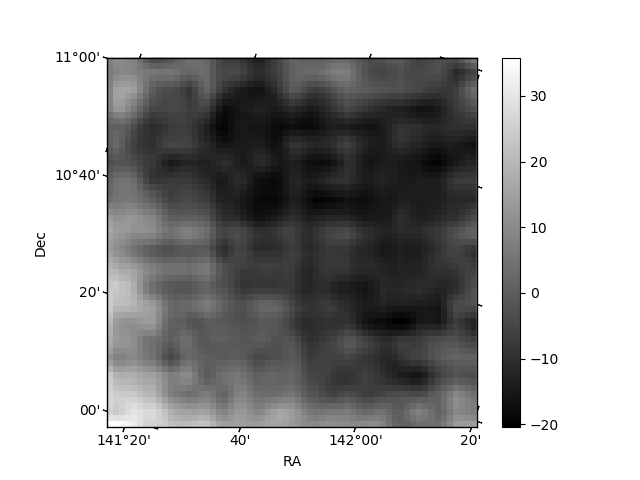
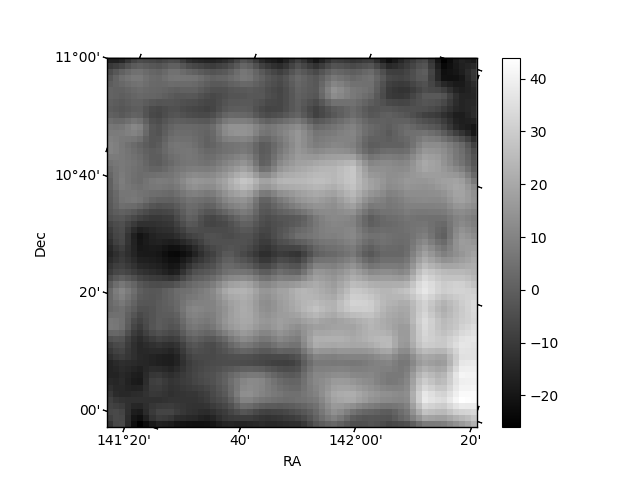
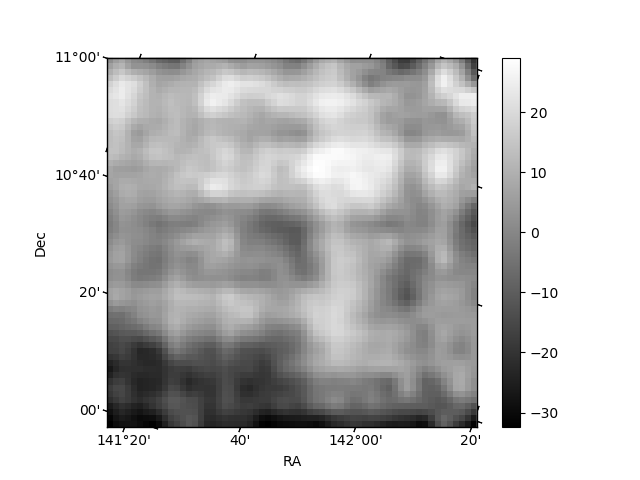
Histogram calculated using DETX and DETY for each event in the final _common_clean file
| Quadrant A | 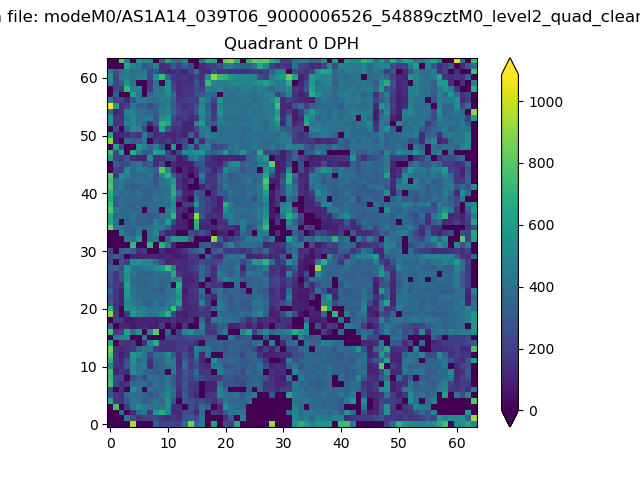 |
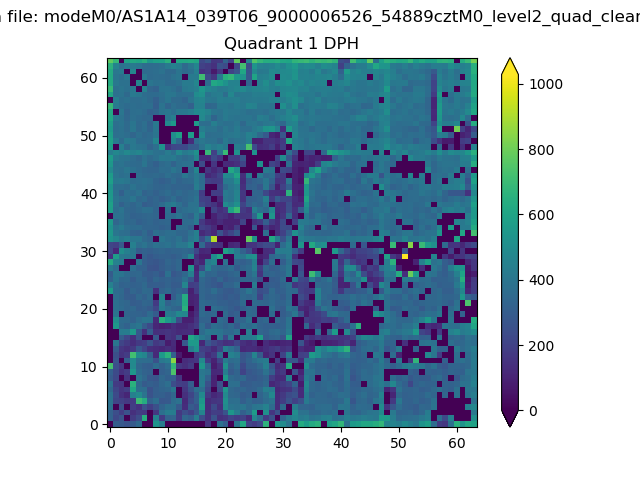 |
Quadrant B |
|---|---|---|---|
| Quadrant D | 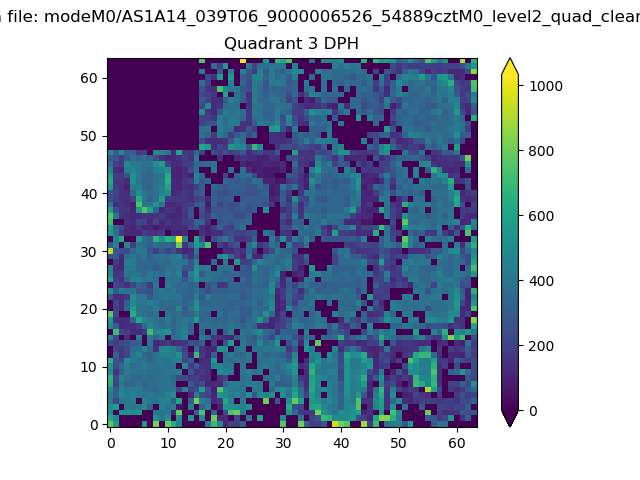 |
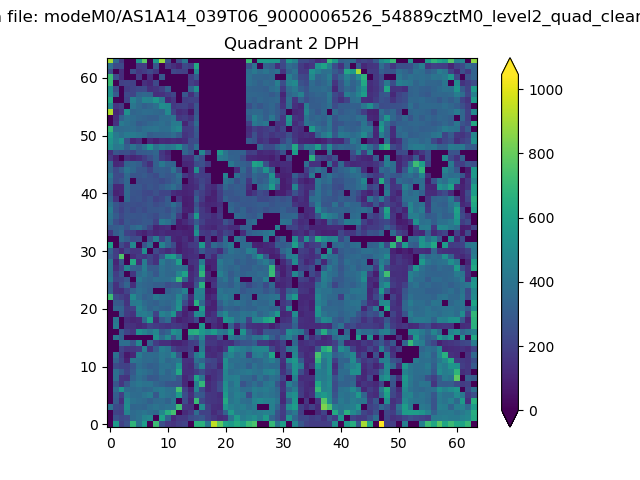 |
Quadrant C |
| Plot type | Count rate plots | Images |
|---|---|---|
| Comparison with Poisson distribution Blue bars denote a histogram of data divided into 1 sec bins. Red curve is a Poisson curve with rate = median count rate of data. |
 |
 |
| Quadrant-wise count rates Data is divided into 100 sec bins |
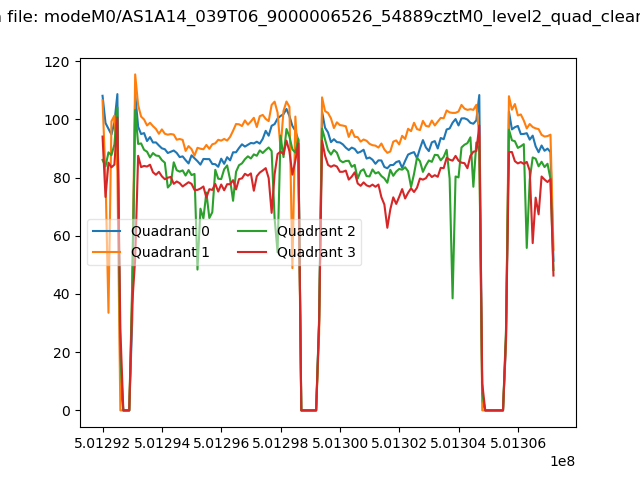 |
|
| Module-wise count rates for Quadrant A Data is divided into 100 sec bins |
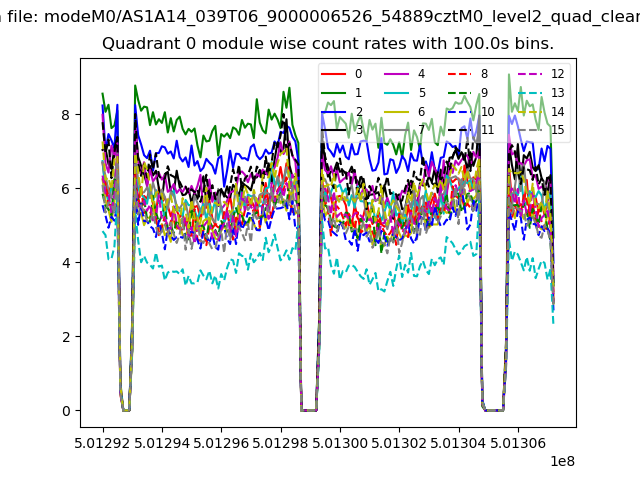 |
 |
| Module-wise count rates for Quadrant B Data is divided into 100 sec bins |
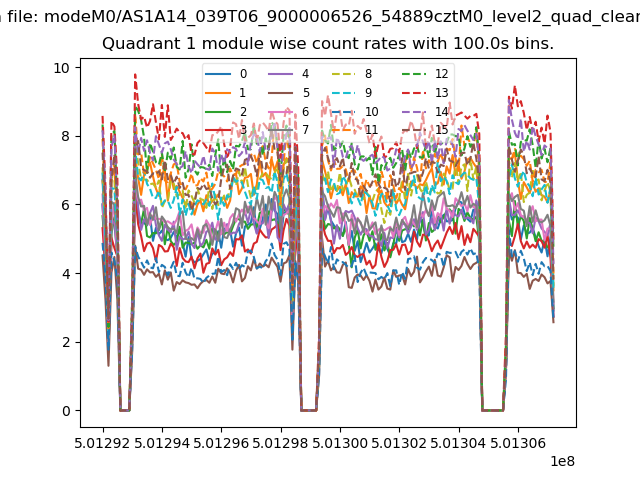 |
 |
| Module-wise count rates for Quadrant C Data is divided into 100 sec bins |
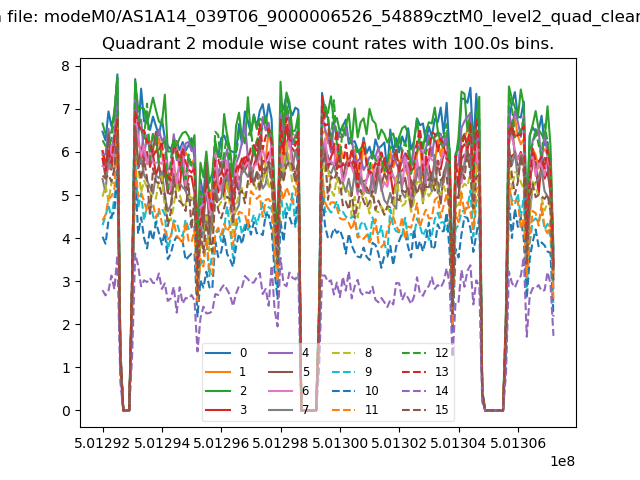 |
 |
| Module-wise count rates for Quadrant D Data is divided into 100 sec bins |
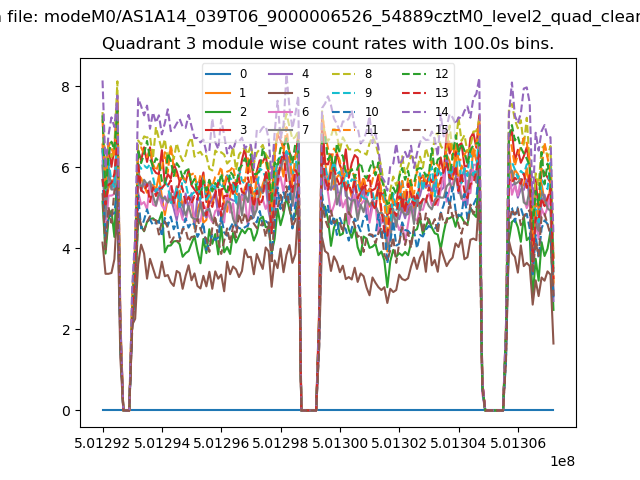 |
 |
| Parameter | Plot |
|---|---|
| CZT HV Monitor | 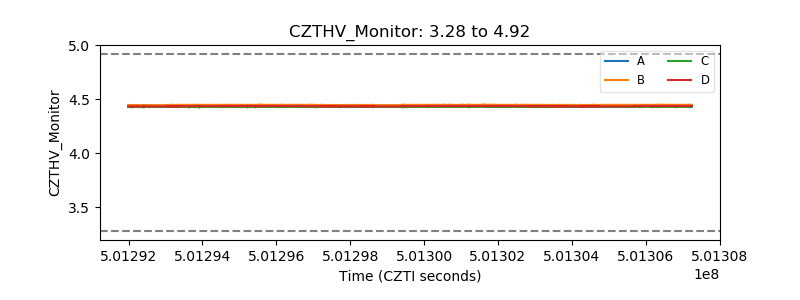 |
| D_VDD |  |
| Temperature 1 | 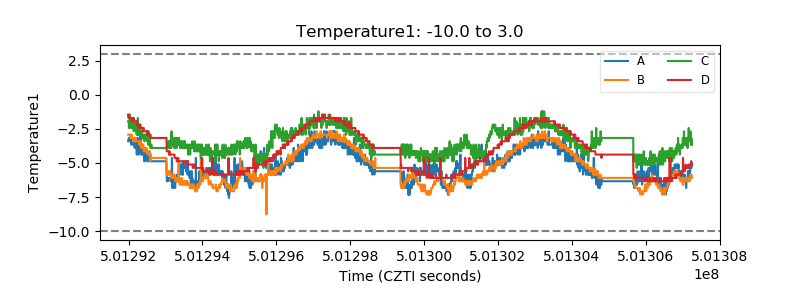 |
| Veto HV Monitor |  |
| Veto LLD | 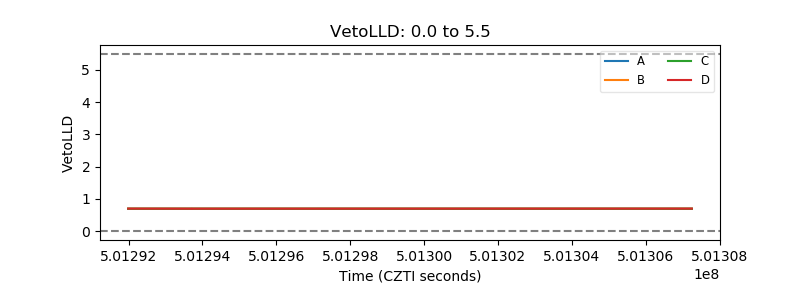 |
| Alpha Counter | 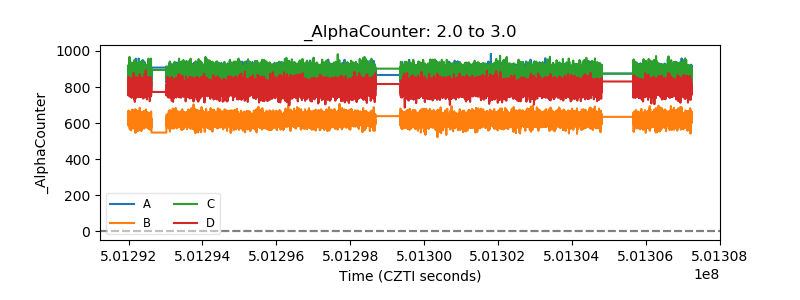 |
| _CPM_Rate | 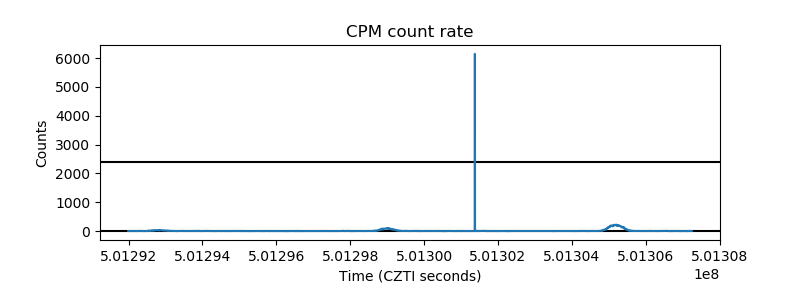 |
| CZT Counter | 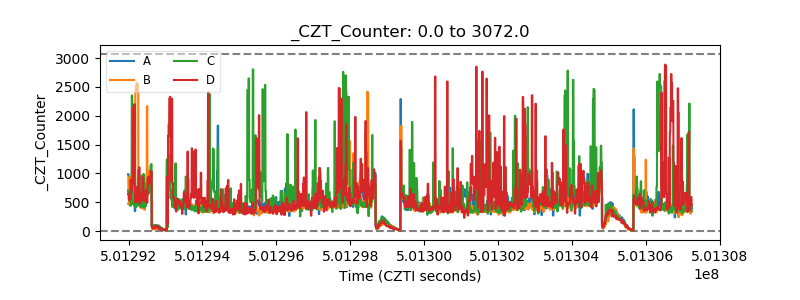 |
| +2.5 Volts monitor |  |
| +5 Volts monitor |  |
| _ROLL_ROT | 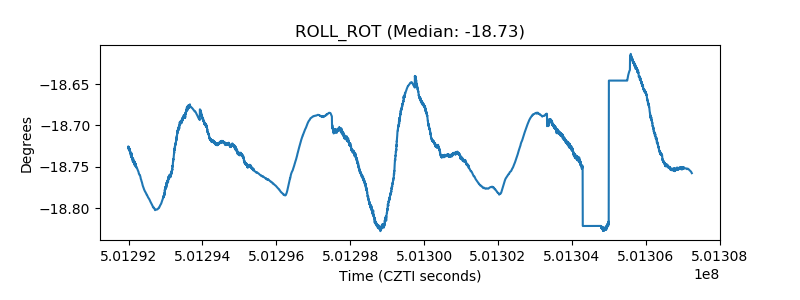 |
| _Roll_DEC | 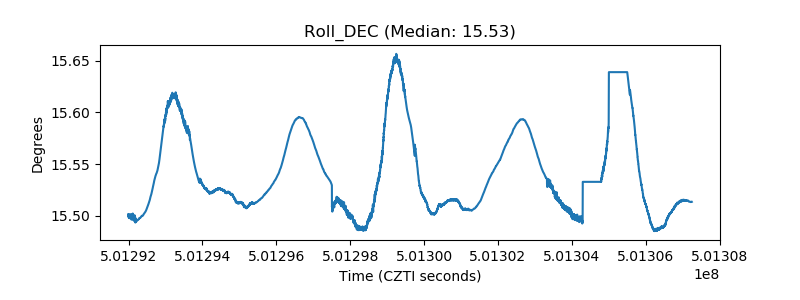 |
| _Roll_RA | 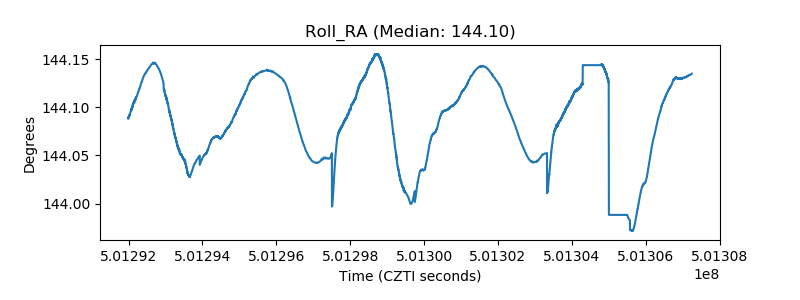 |
| Veto Counter | 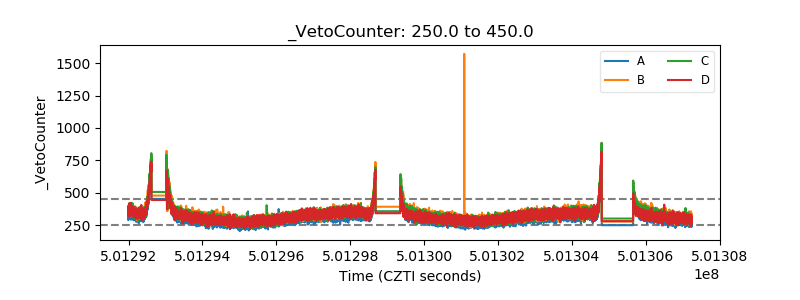 |