| Param | Original file | Final file |
|---|---|---|
| Filename | modeM0/AS1A14_039T06_9000006526_54891cztM0_level2.fits | modeM0/AS1A14_039T06_9000006526_54891cztM0_level2_quad_clean.evt |
| Size (bytes) | 392,391,360 | 99,132,480 |
| Size | 374.2 MB | 94.5 MB |
| Events in quadrant A | 3,129,800 | 646,075 |
| Events in quadrant B | 2,963,857 | 694,926 |
| Events in quadrant C | 3,665,454 | 610,780 |
| Events in quadrant D | 4,230,449 | 570,876 |
| Mode M9 | |||
|---|---|---|---|
| Quadrant | BADHDUFLAG | Total packets | Discarded packets |
| A | 0 | 9 | 0 |
| B | 0 | 9 | 0 |
| C | 0 | 9 | 0 |
| D | 0 | 10 | 0 |
| Mode M0 | |||
|---|---|---|---|
| Quadrant | BADHDUFLAG | Total packets | Discarded packets |
| A | 0 | 14387 | 4 |
| B | 0 | 14154 | 2 |
| C | 0 | 15938 | 7 |
| D | 0 | 17509 | 6 |
| Mode SS | |||
|---|---|---|---|
| Quadrant | BADHDUFLAG | Total packets | Discarded packets |
| A | 0 | 140 | 0 |
| B | 0 | 140 | 0 |
| C | 0 | 140 | 0 |
| D | 0 | 140 | 2 |
| Quadrant | Total seconds | Saturated seconds | Saturation percentage |
|---|---|---|---|
| A | 6879 | 71 | 1.032127% |
| B | 6880 | 74 | 1.075581% |
| C | 6878 | 136 | 1.977319% |
| D | 6878 | 192 | 2.791509% |
Noise dominated data is calculated using 1-second bins in cleaned event files. If a bin has >2000 counts, and if more than 50% of those come from <1% of pixels, then it is considered to be noise-dominated and hence unusable.
| Quadrant | # 1 sec bins | Bins with >0 counts | Bins with >2000 counts | High rate bins dominated by noise | Noise dominated (total time) | Noise dominated (detector-on time) | Marked lightcurve |
|---|---|---|---|---|---|---|---|
| A | 7805 | 6881 | 13 | 13 | 0.17% | 0.19% | 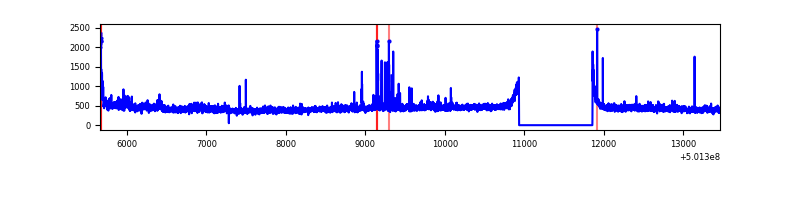 |
| B | 7805 | 6881 | 3 | 3 | 0.04% | 0.04% | 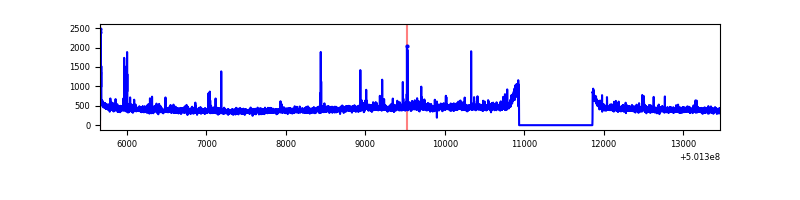 |
| C | 7805 | 6881 | 96 | 96 | 1.23% | 1.40% | 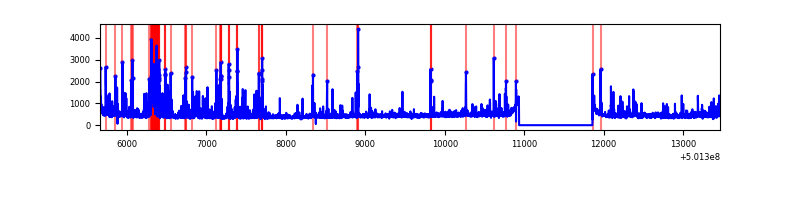 |
| D | 7805 | 6881 | 195 | 195 | 2.50% | 2.83% | 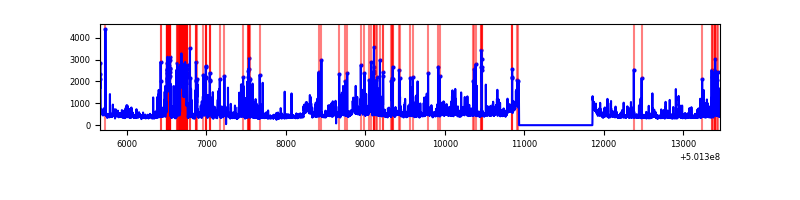 |
Top three noisy pixels from each quadrant. If the there are fewer than three noisy pixels in the level2.evt file, extra rows are filled as -1
| Pixel properties | Quadrant properties | ||||||
|---|---|---|---|---|---|---|---|
| Quadrant | DetID | PixID | Counts | Sigma | Mean | Median | Sigma |
| A | 3 | 14 | 200938 | 1113.46 | 726 | 709 | 179.8 |
| A | 0 | 8 | 59384 | 326.29 | 726 | 709 | 179.8 |
| A | 13 | 254 | 20899 | 112.28 | 726 | 709 | 179.8 |
| B | 5 | 236 | 32972 | 208.16 | 715 | 688 | 155.1 |
| B | 5 | 185 | 28539 | 179.57 | 715 | 688 | 155.1 |
| B | 10 | 247 | 26155 | 164.2 | 715 | 688 | 155.1 |
| C | 15 | 199 | 191691 | 1001.69 | 699 | 695 | 190.7 |
| C | 4 | 5 | 170200 | 888.98 | 699 | 695 | 190.7 |
| C | 6 | 223 | 150693 | 786.67 | 699 | 695 | 190.7 |
| D | 8 | 160 | 470805 | 2348.77 | 696 | 666 | 200.2 |
| D | 10 | 181 | 345151 | 1721.02 | 696 | 666 | 200.2 |
| D | 15 | 94 | 126316 | 627.74 | 696 | 666 | 200.2 |
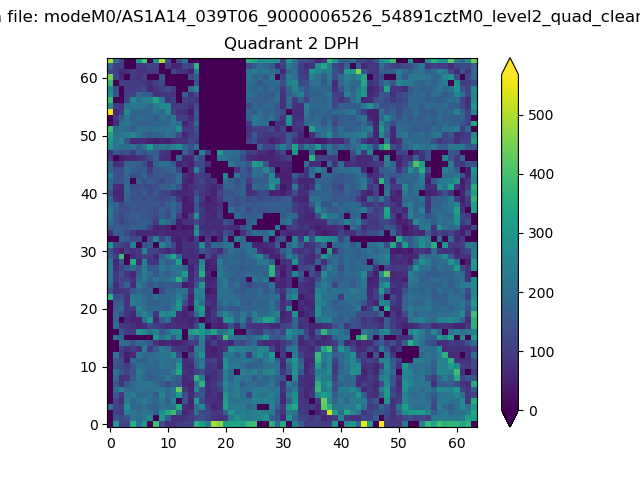
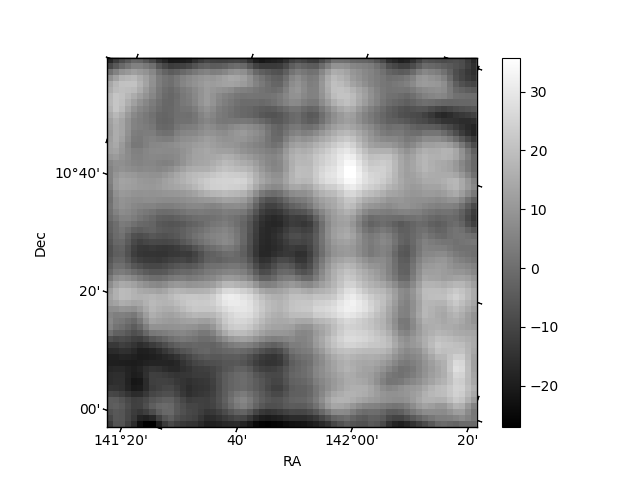
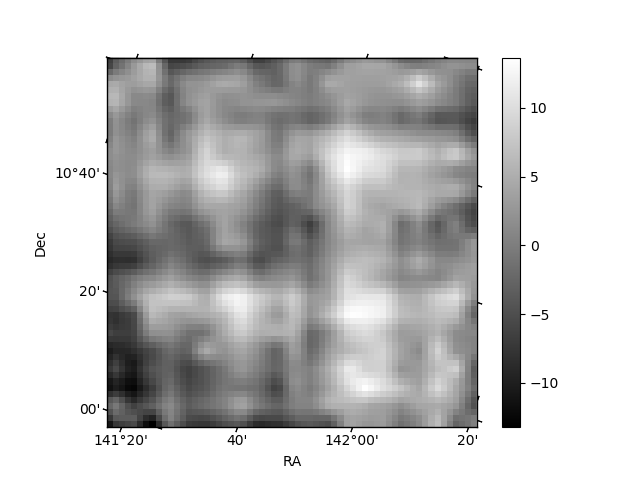
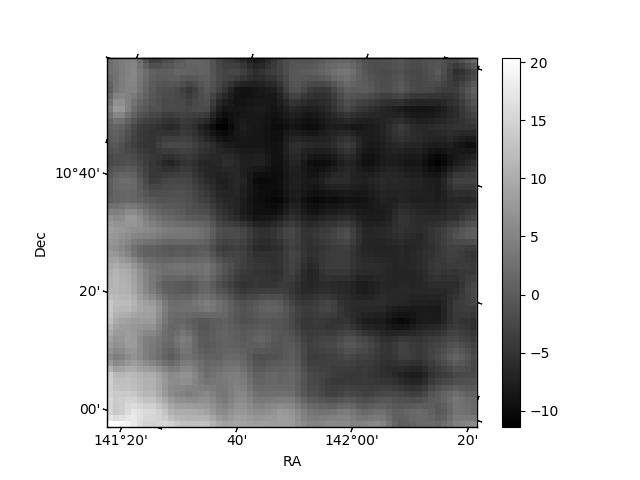
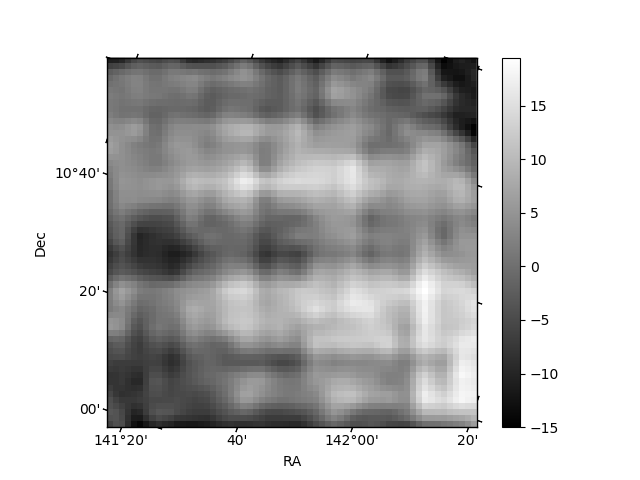
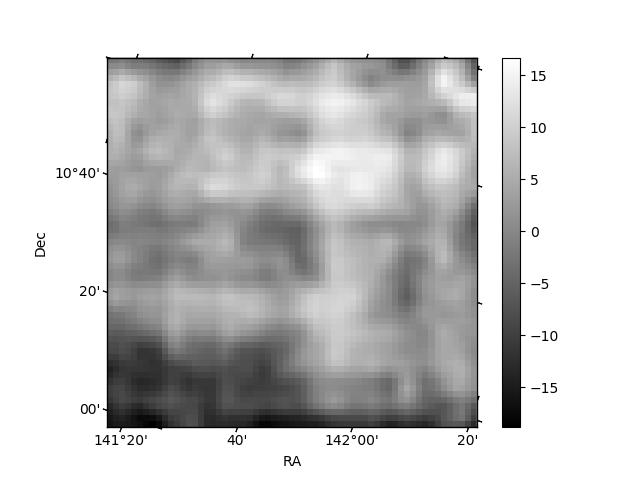
Histogram calculated using DETX and DETY for each event in the final _common_clean file
| Quadrant A | 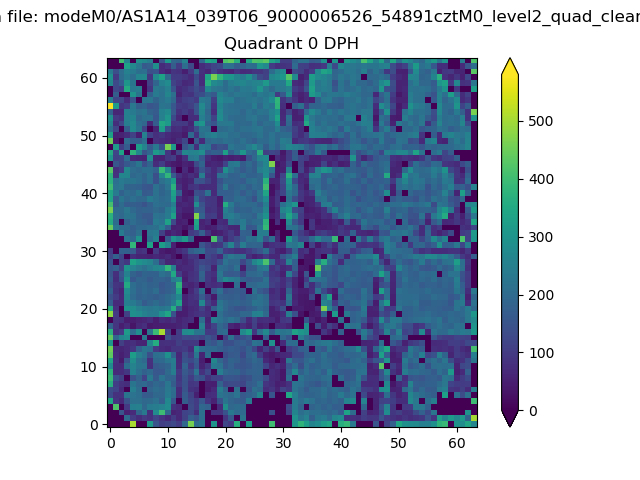 |
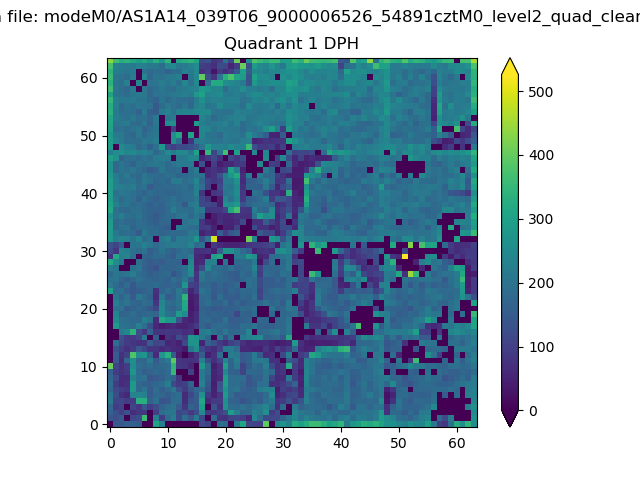 |
Quadrant B |
|---|---|---|---|
| Quadrant D | 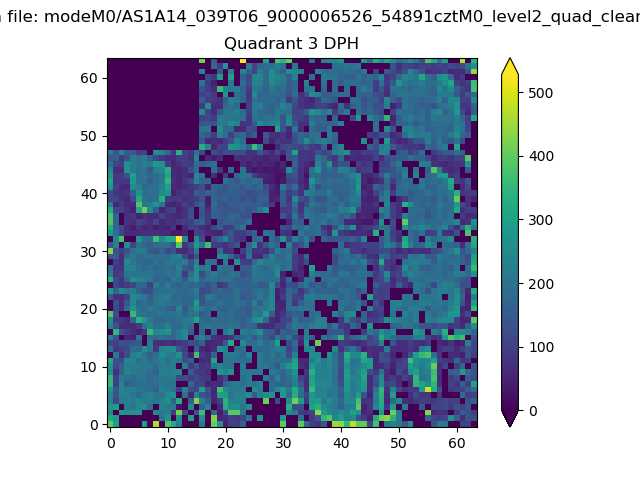 |
 |
Quadrant C |
| Plot type | Count rate plots | Images |
|---|---|---|
| Comparison with Poisson distribution Blue bars denote a histogram of data divided into 1 sec bins. Red curve is a Poisson curve with rate = median count rate of data. |
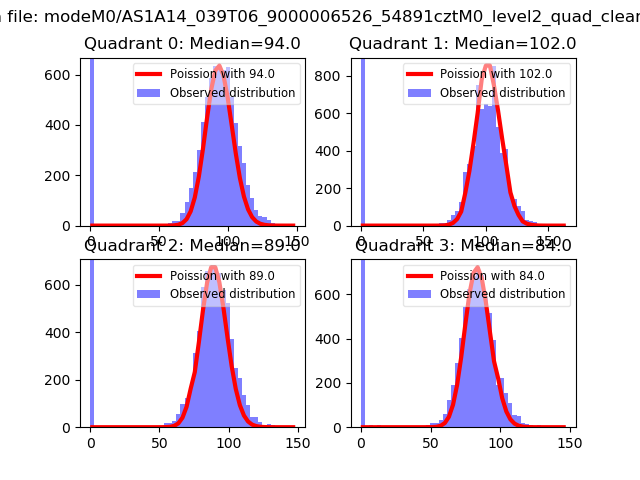 |
 |
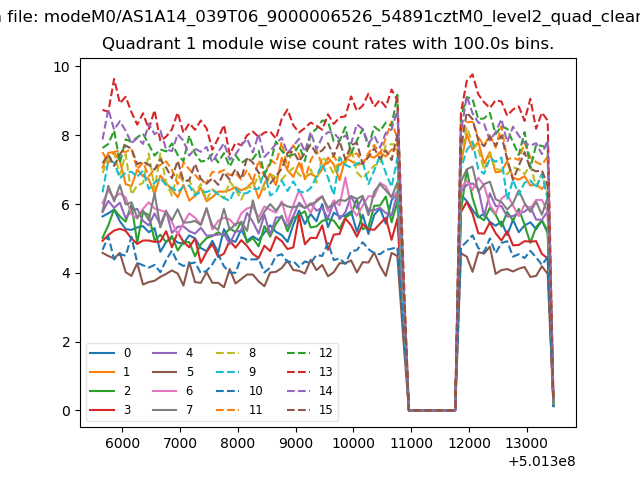
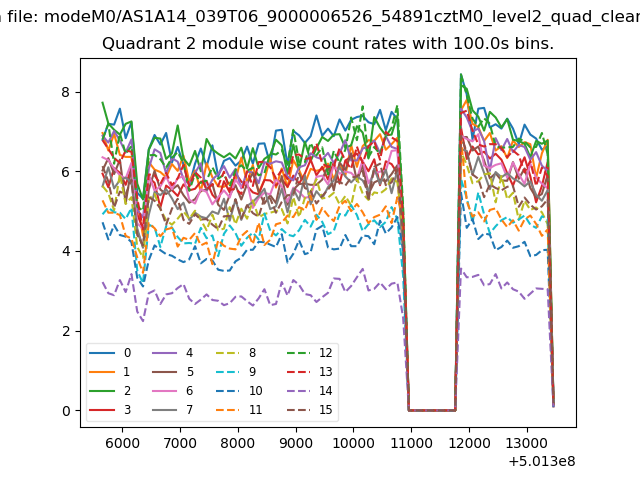
| Quadrant-wise count rates Data is divided into 100 sec bins |
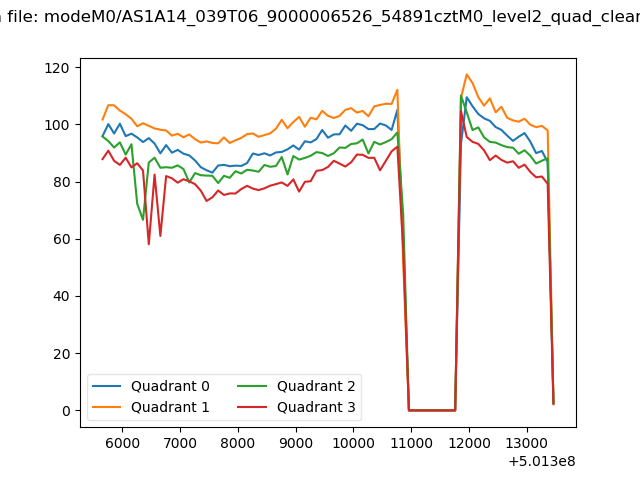 |
|
| Module-wise count rates for Quadrant A Data is divided into 100 sec bins |
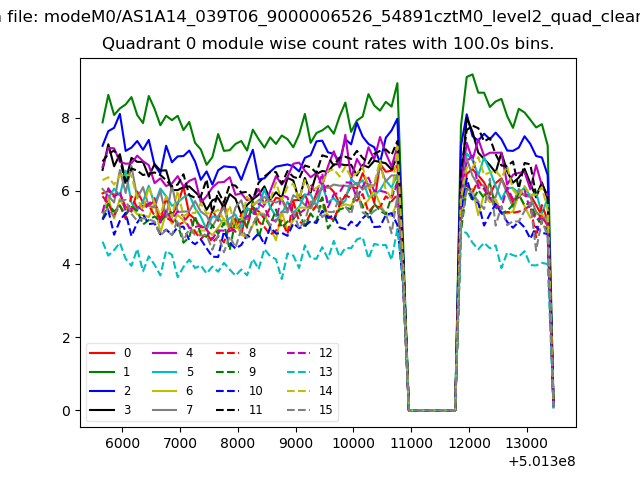 |
 |
| Module-wise count rates for Quadrant B Data is divided into 100 sec bins |
 |
 |
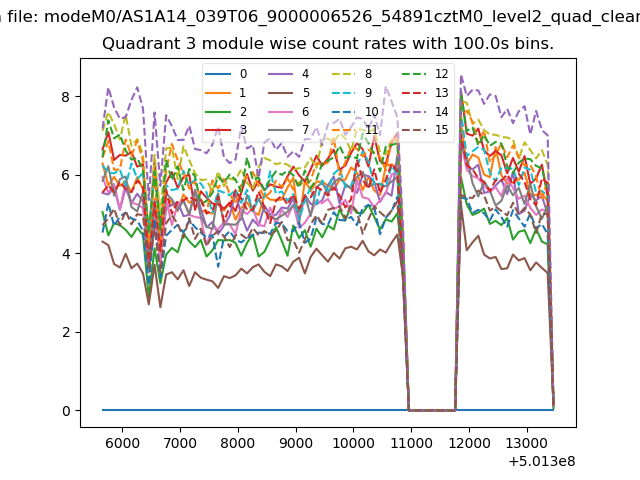
| Module-wise count rates for Quadrant C Data is divided into 100 sec bins |
 |
 |
| Module-wise count rates for Quadrant D Data is divided into 100 sec bins |
 |
 |
| Parameter | Plot |
|---|---|
| CZT HV Monitor | 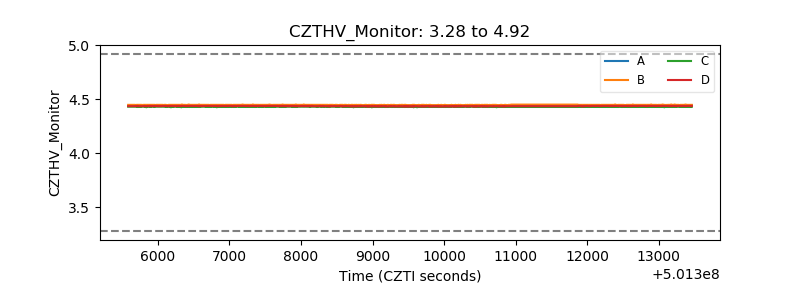 |
| D_VDD | 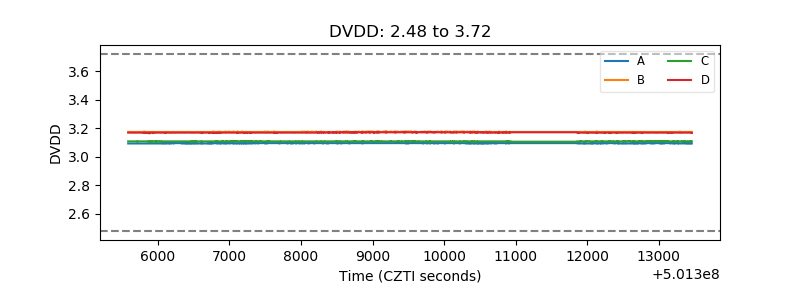 |
| Temperature 1 | 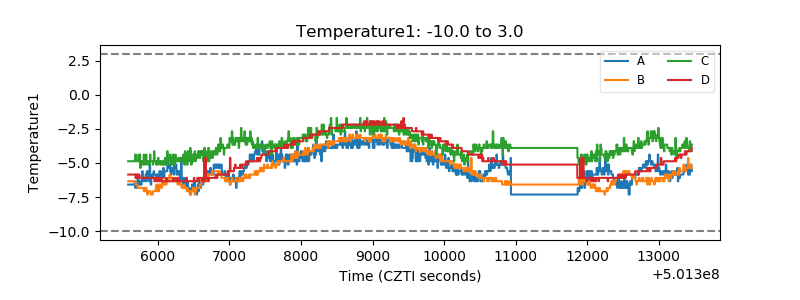 |
| Veto HV Monitor | 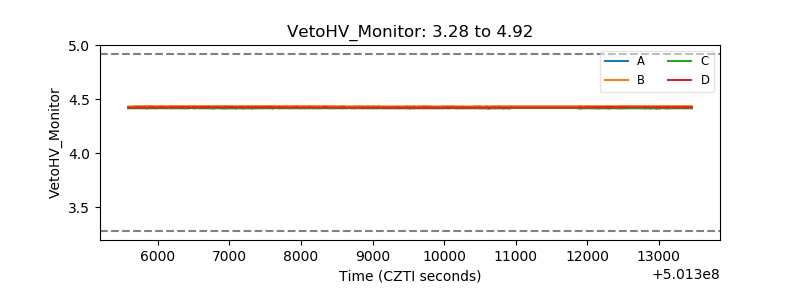 |
| Veto LLD | 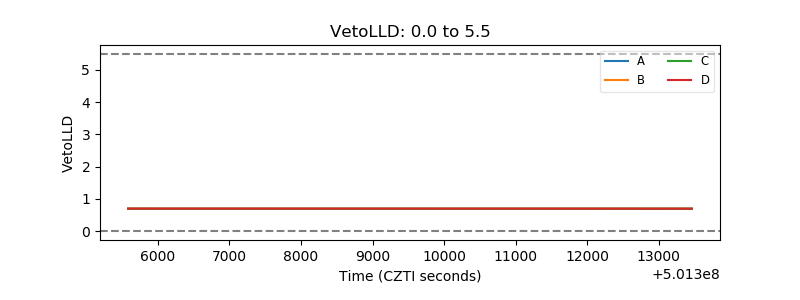 |
| Alpha Counter | 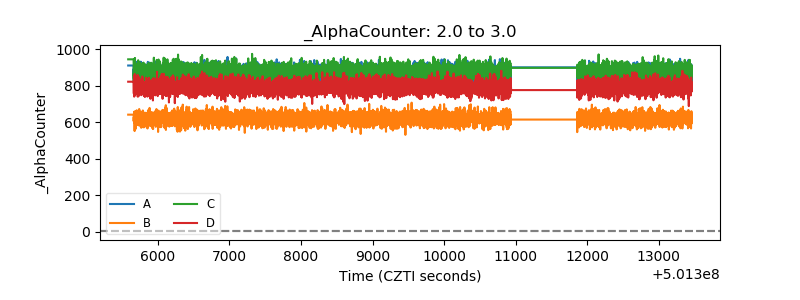 |
| _CPM_Rate | 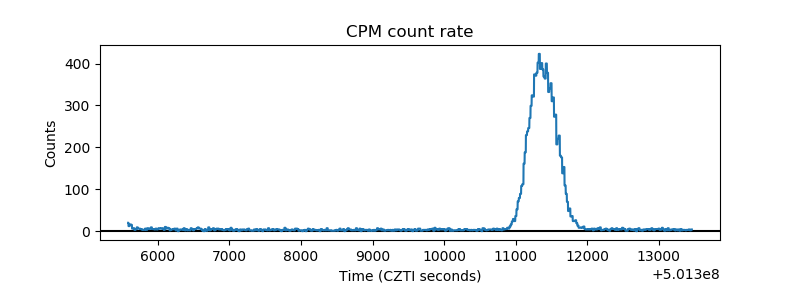 |
| CZT Counter | 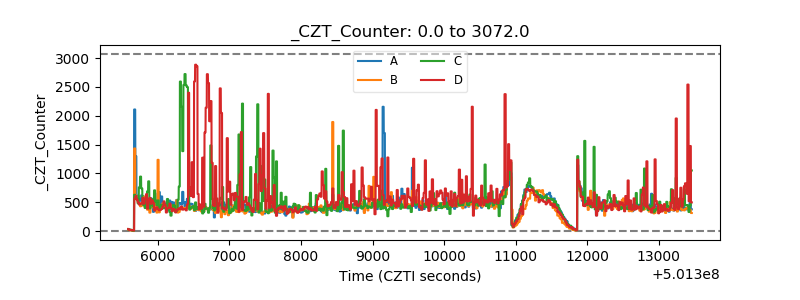 |
| +2.5 Volts monitor |  |
| +5 Volts monitor |  |
| _ROLL_ROT | 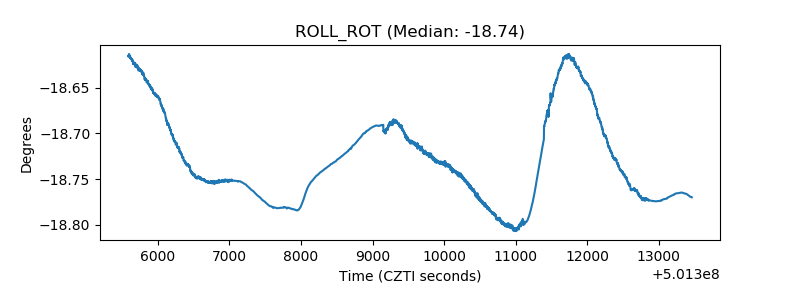 |
| _Roll_DEC | 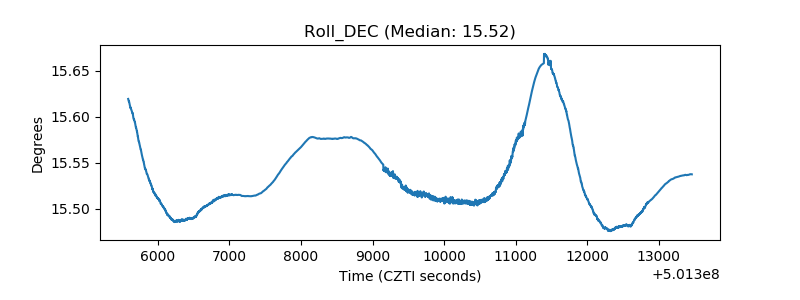 |
| _Roll_RA | 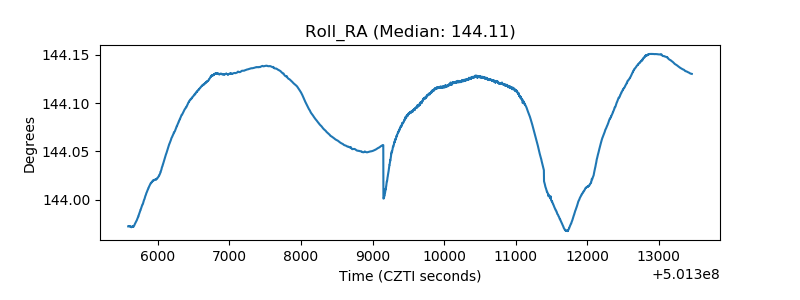 |
| Veto Counter | 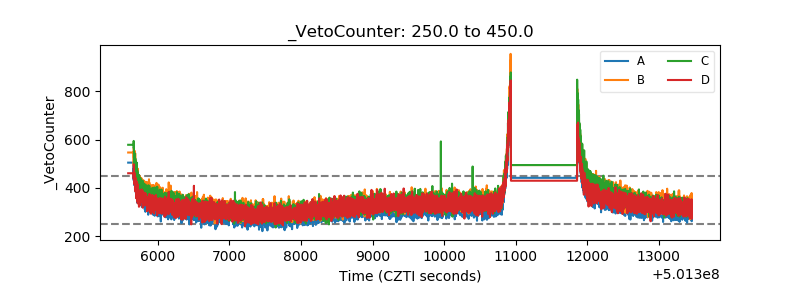 |