| Param | Original file | Final file |
|---|---|---|
| Filename | modeM0/AS1A14_039T06_9000006526_54892cztM0_level2.fits | modeM0/AS1A14_039T06_9000006526_54892cztM0_level2_quad_clean.evt |
| Size (bytes) | 376,133,760 | 87,174,720 |
| Size | 358.7 MB | 83.1 MB |
| Events in quadrant A | 3,579,351 | 564,951 |
| Events in quadrant B | 2,601,166 | 614,444 |
| Events in quadrant C | 3,515,398 | 543,130 |
| Events in quadrant D | 3,764,262 | 501,610 |
| Mode M9 | |||
|---|---|---|---|
| Quadrant | BADHDUFLAG | Total packets | Discarded packets |
| A | 0 | 11 | 0 |
| B | 0 | 11 | 0 |
| C | 0 | 11 | 0 |
| D | 0 | 11 | 0 |
| Mode M0 | |||
|---|---|---|---|
| Quadrant | BADHDUFLAG | Total packets | Discarded packets |
| A | 0 | 14913 | 1 |
| B | 0 | 12221 | 7 |
| C | 0 | 14658 | 1 |
| D | 0 | 15305 | 1 |
| Mode SS | |||
|---|---|---|---|
| Quadrant | BADHDUFLAG | Total packets | Discarded packets |
| A | 0 | 120 | 0 |
| B | 0 | 120 | 0 |
| C | 0 | 120 | 0 |
| D | 0 | 120 | 0 |
| Quadrant | Total seconds | Saturated seconds | Saturation percentage |
|---|---|---|---|
| A | 5952 | 127 | 2.133737% |
| B | 5949 | 64 | 1.075811% |
| C | 5952 | 80 | 1.344086% |
| D | 5952 | 211 | 3.545027% |
Noise dominated data is calculated using 1-second bins in cleaned event files. If a bin has >2000 counts, and if more than 50% of those come from <1% of pixels, then it is considered to be noise-dominated and hence unusable.
| Quadrant | # 1 sec bins | Bins with >0 counts | Bins with >2000 counts | High rate bins dominated by noise | Noise dominated (total time) | Noise dominated (detector-on time) | Marked lightcurve |
|---|---|---|---|---|---|---|---|
| A | 6987 | 5953 | 54 | 54 | 0.77% | 0.91% | 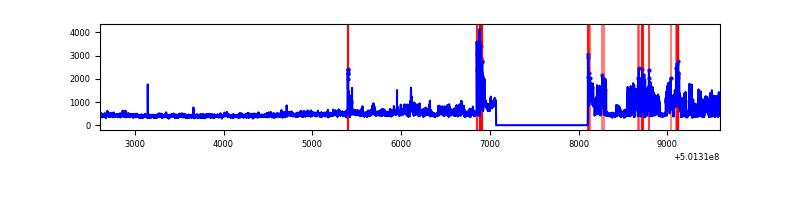 |
| B | 6987 | 5953 | 2 | 2 | 0.03% | 0.03% | 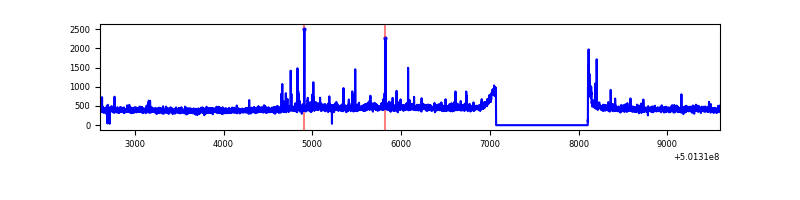 |
| C | 6987 | 5953 | 71 | 71 | 1.02% | 1.19% | 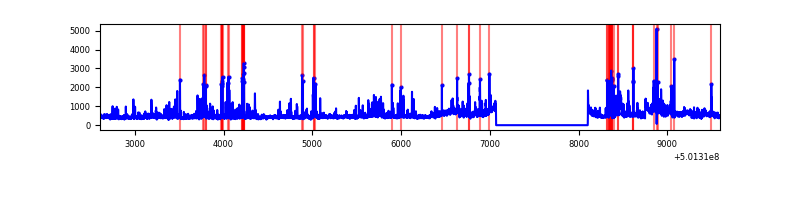 |
| D | 6987 | 5953 | 169 | 169 | 2.42% | 2.84% | 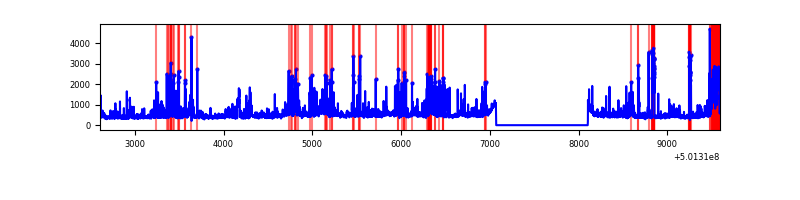 |
Top three noisy pixels from each quadrant. If the there are fewer than three noisy pixels in the level2.evt file, extra rows are filled as -1
| Pixel properties | Quadrant properties | ||||||
|---|---|---|---|---|---|---|---|
| Quadrant | DetID | PixID | Counts | Sigma | Mean | Median | Sigma |
| A | 3 | 14 | 907760 | 5777.66 | 636 | 622 | 157.0 |
| A | 0 | 117 | 89033 | 563.1 | 636 | 622 | 157.0 |
| A | 0 | 250 | 57646 | 363.19 | 636 | 622 | 157.0 |
| B | 10 | 247 | 29541 | 216.39 | 627 | 606 | 133.7 |
| B | 5 | 236 | 25385 | 185.31 | 627 | 606 | 133.7 |
| B | 12 | 111 | 16377 | 117.94 | 627 | 606 | 133.7 |
| C | 4 | 5 | 654749 | 3854.41 | 616 | 611 | 169.7 |
| C | 6 | 223 | 119627 | 701.28 | 616 | 611 | 169.7 |
| C | 12 | 252 | 90798 | 531.41 | 616 | 611 | 169.7 |
| D | 10 | 181 | 200515 | 1149.53 | 611 | 585 | 173.9 |
| D | 11 | 176 | 184339 | 1056.53 | 611 | 585 | 173.9 |
| D | 6 | 46 | 164598 | 943.02 | 611 | 585 | 173.9 |
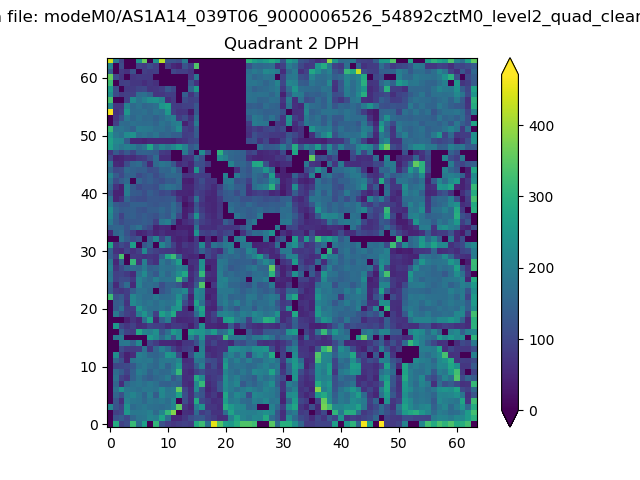
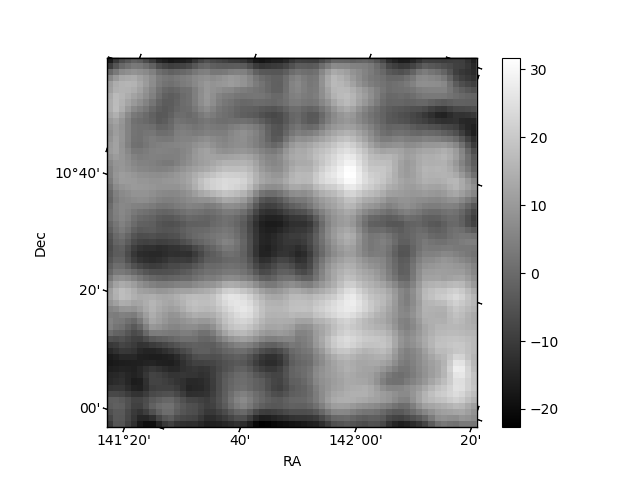
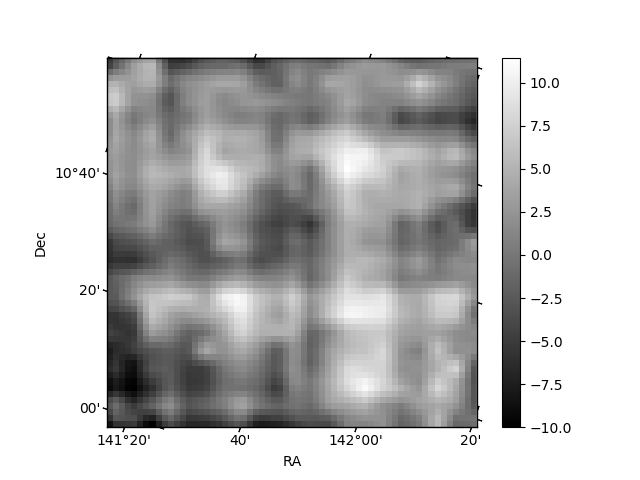
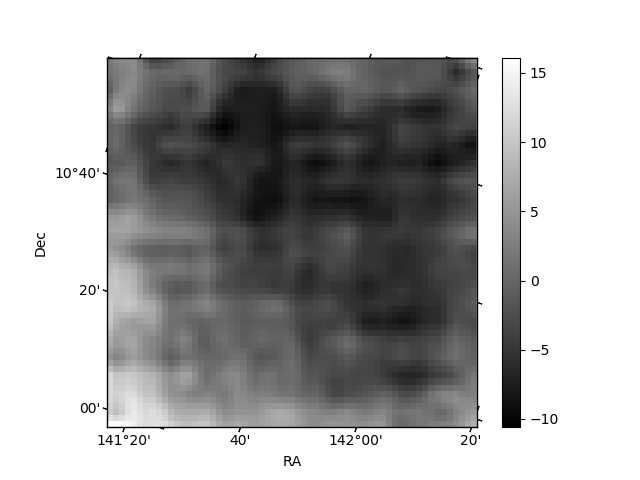
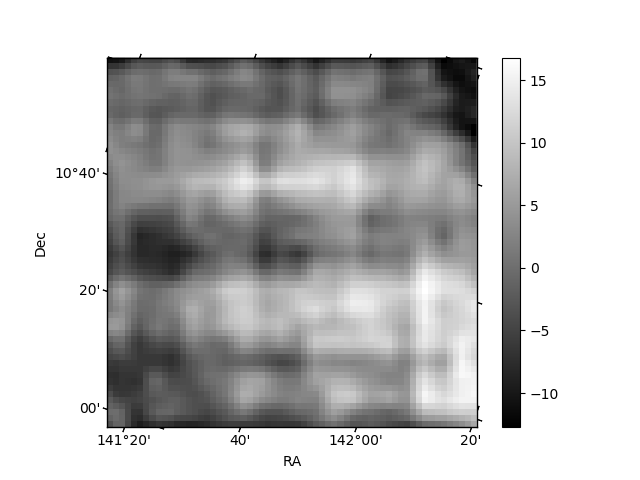
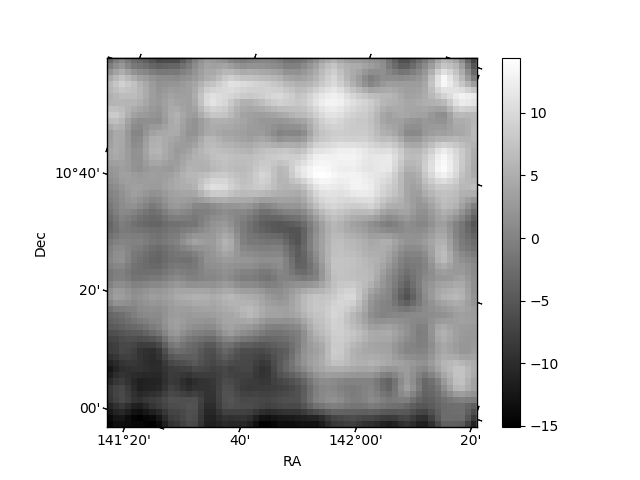
Histogram calculated using DETX and DETY for each event in the final _common_clean file
| Quadrant A | 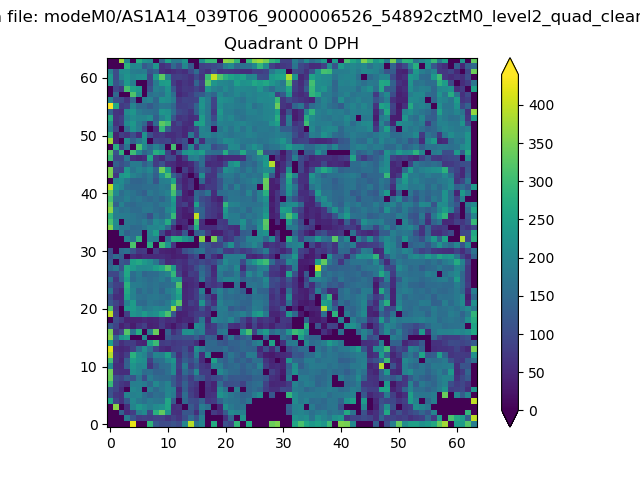 |
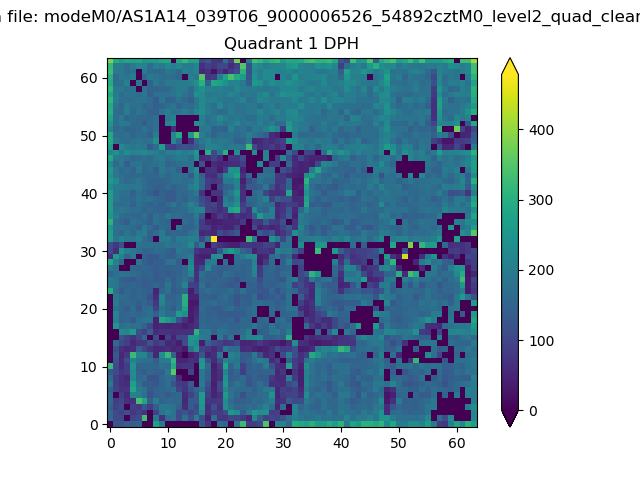 |
Quadrant B |
|---|---|---|---|
| Quadrant D | 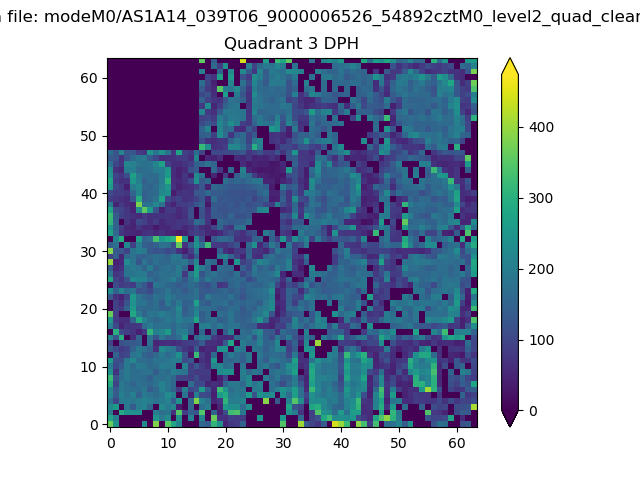 |
 |
Quadrant C |
| Plot type | Count rate plots | Images |
|---|---|---|
| Comparison with Poisson distribution Blue bars denote a histogram of data divided into 1 sec bins. Red curve is a Poisson curve with rate = median count rate of data. |
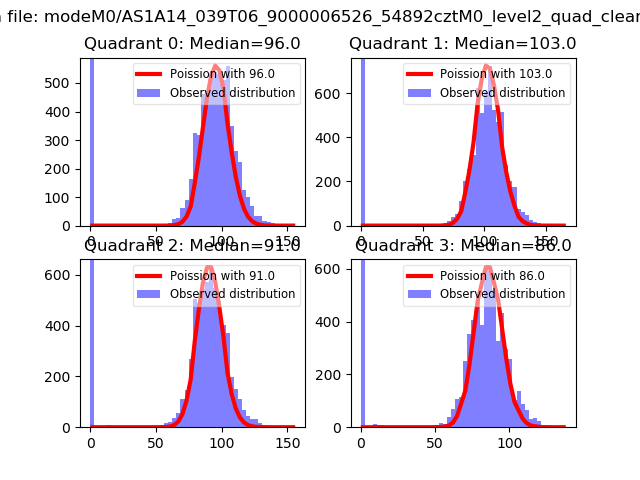 |
 |
| Quadrant-wise count rates Data is divided into 100 sec bins |
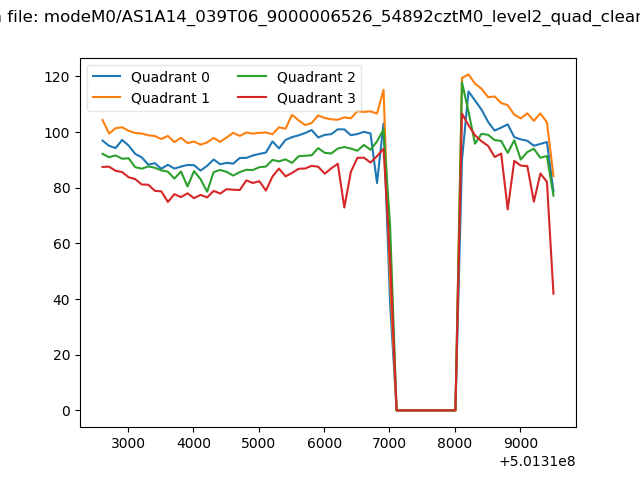 |
|
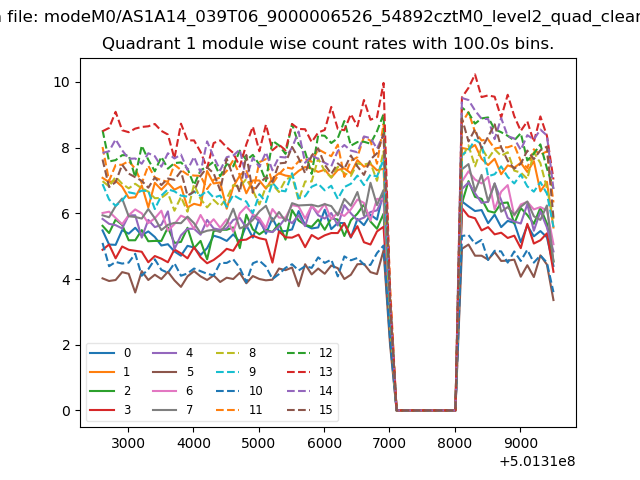
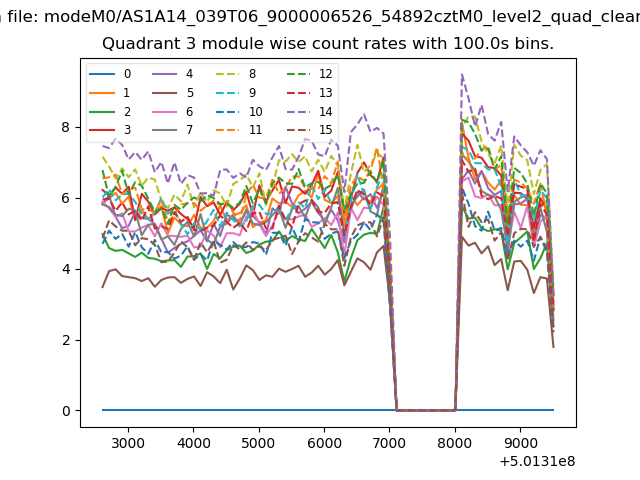
| Module-wise count rates for Quadrant A Data is divided into 100 sec bins |
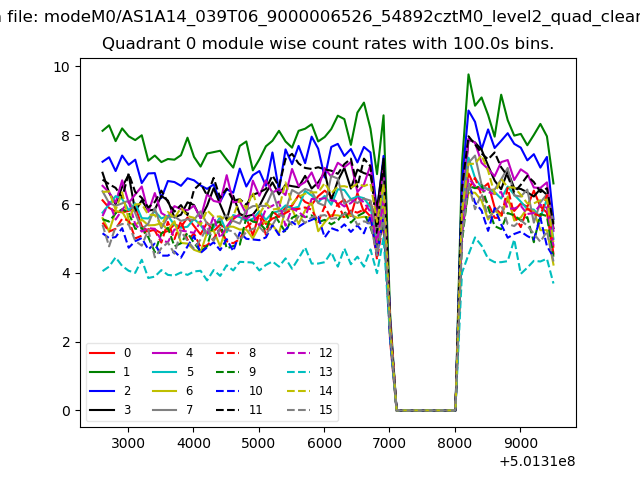 |
 |
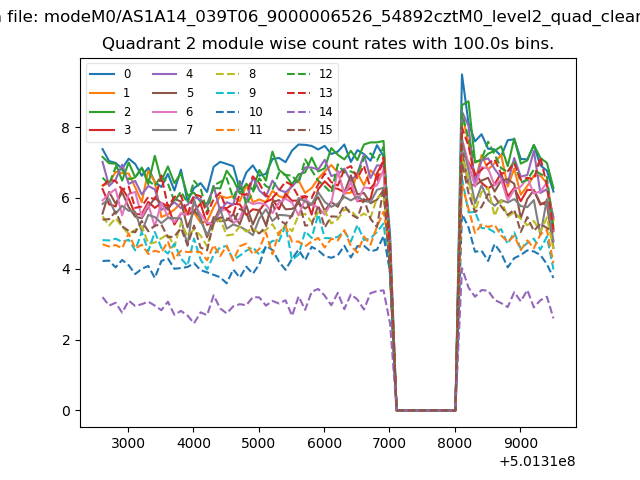
| Module-wise count rates for Quadrant B Data is divided into 100 sec bins |
 |
 |
| Module-wise count rates for Quadrant C Data is divided into 100 sec bins |
 |
 |
| Module-wise count rates for Quadrant D Data is divided into 100 sec bins |
 |
 |
| Parameter | Plot |
|---|---|
| CZT HV Monitor | 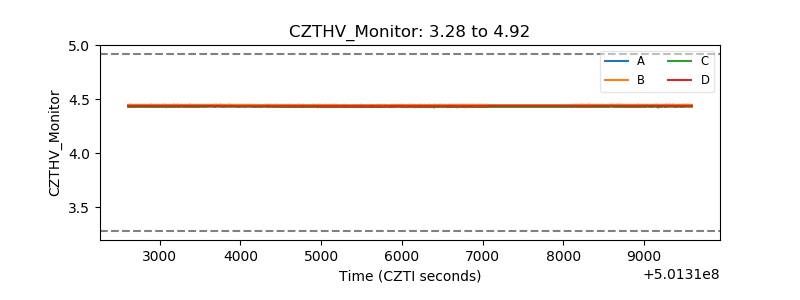 |
| D_VDD | 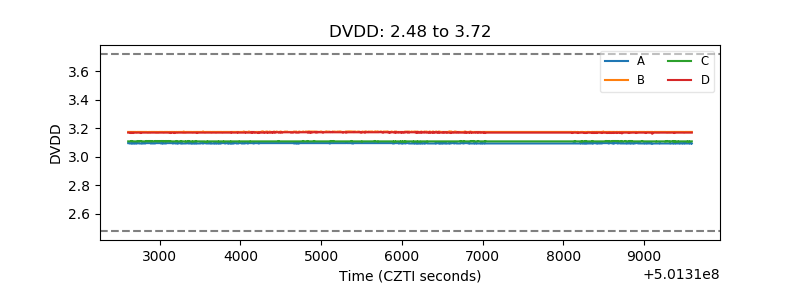 |
| Temperature 1 | 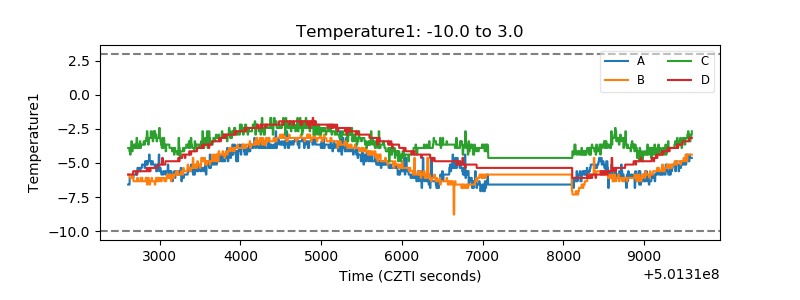 |
| Veto HV Monitor |  |
| Veto LLD | 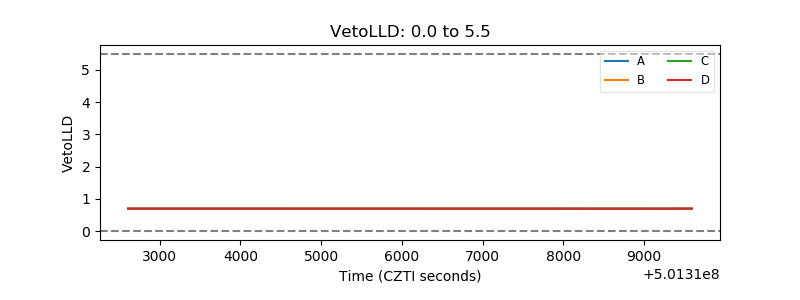 |
| Alpha Counter | 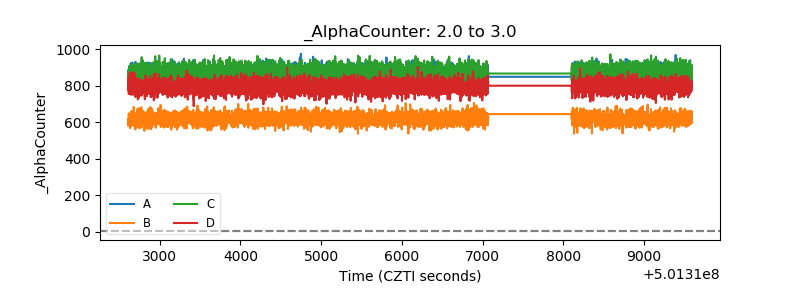 |
| _CPM_Rate | 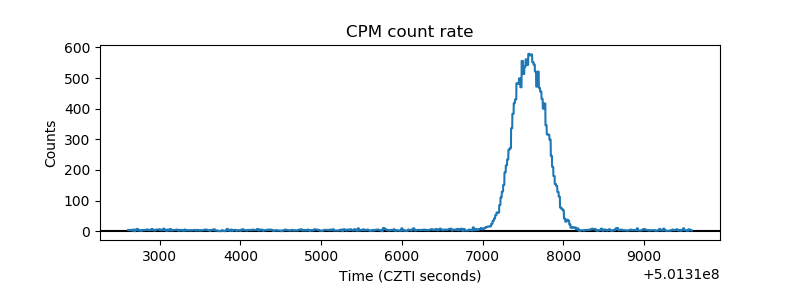 |
| CZT Counter | 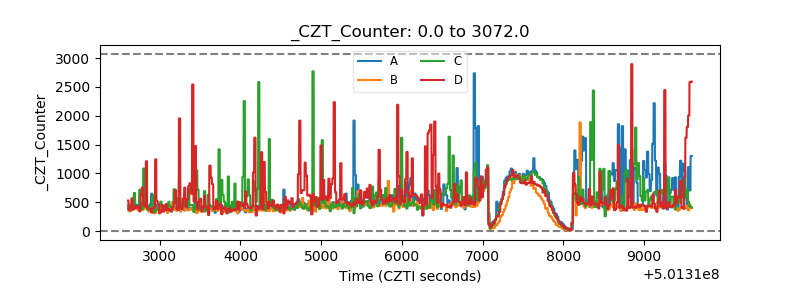 |
| +2.5 Volts monitor |  |
| +5 Volts monitor |  |
| _ROLL_ROT | 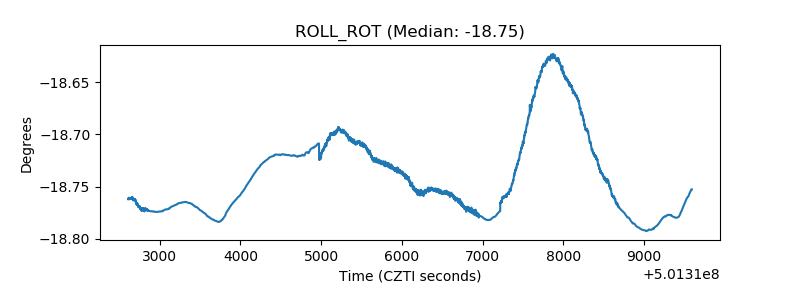 |
| _Roll_DEC |  |
| _Roll_RA | 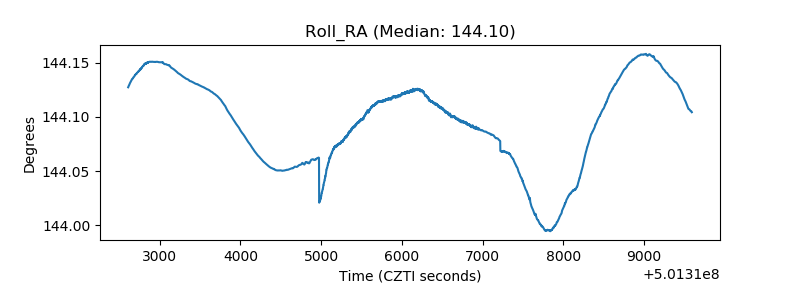 |
| Veto Counter | 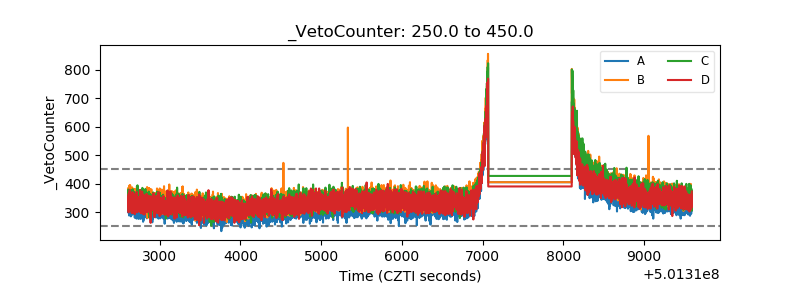 |