| Param | Original file | Final file |
|---|---|---|
| Filename | modeM0/AS1A14_039T06_9000006526_54893cztM0_level2.fits | modeM0/AS1A14_039T06_9000006526_54893cztM0_level2_quad_clean.evt |
| Size (bytes) | 459,944,640 | 98,665,920 |
| Size | 438.6 MB | 94.1 MB |
| Events in quadrant A | 5,483,853 | 641,113 |
| Events in quadrant B | 3,014,848 | 702,196 |
| Events in quadrant C | 3,737,696 | 620,176 |
| Events in quadrant D | 4,278,582 | 565,958 |
| Mode M9 | |||
|---|---|---|---|
| Quadrant | BADHDUFLAG | Total packets | Discarded packets |
| A | 0 | 15 | 0 |
| B | 0 | 15 | 0 |
| C | 0 | 16 | 0 |
| D | 0 | 16 | 0 |
| Mode M0 | |||
|---|---|---|---|
| Quadrant | BADHDUFLAG | Total packets | Discarded packets |
| A | 0 | 20895 | 2 |
| B | 0 | 13755 | 2 |
| C | 0 | 15668 | 2 |
| D | 0 | 17169 | 2 |
| Mode SS | |||
|---|---|---|---|
| Quadrant | BADHDUFLAG | Total packets | Discarded packets |
| A | 0 | 132 | 0 |
| B | 0 | 132 | 0 |
| C | 0 | 132 | 0 |
| D | 0 | 132 | 0 |
| Quadrant | Total seconds | Saturated seconds | Saturation percentage |
|---|---|---|---|
| A | 6577 | 228 | 3.466626% |
| B | 6577 | 97 | 1.474837% |
| C | 6577 | 91 | 1.383610% |
| D | 6577 | 279 | 4.242056% |
Noise dominated data is calculated using 1-second bins in cleaned event files. If a bin has >2000 counts, and if more than 50% of those come from <1% of pixels, then it is considered to be noise-dominated and hence unusable.
| Quadrant | # 1 sec bins | Bins with >0 counts | Bins with >2000 counts | High rate bins dominated by noise | Noise dominated (total time) | Noise dominated (detector-on time) | Marked lightcurve |
|---|---|---|---|---|---|---|---|
| A | 7672 | 6578 | 92 | 92 | 1.20% | 1.40% | 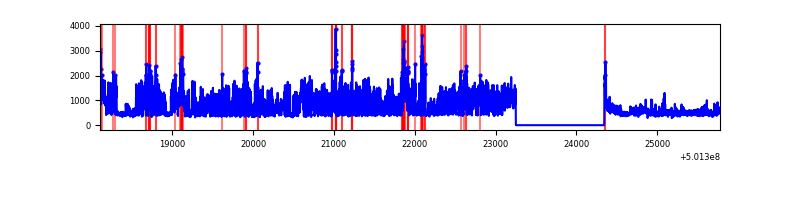 |
| B | 7672 | 6578 | 4 | 4 | 0.05% | 0.06% | 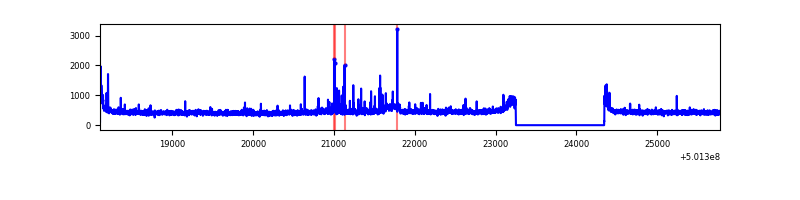 |
| C | 7672 | 6578 | 43 | 43 | 0.56% | 0.65% | 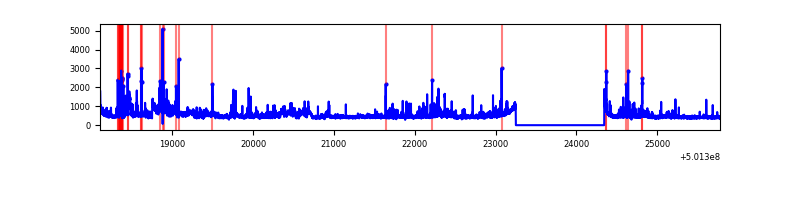 |
| D | 7672 | 6578 | 215 | 215 | 2.80% | 3.27% |  |
Top three noisy pixels from each quadrant. If the there are fewer than three noisy pixels in the level2.evt file, extra rows are filled as -1
| Pixel properties | Quadrant properties | ||||||
|---|---|---|---|---|---|---|---|
| Quadrant | DetID | PixID | Counts | Sigma | Mean | Median | Sigma |
| A | 3 | 14 | 2495824 | 13883.09 | 720 | 702 | 179.7 |
| A | 0 | 8 | 172273 | 954.63 | 720 | 702 | 179.7 |
| A | 13 | 254 | 19029 | 101.97 | 720 | 702 | 179.7 |
| B | 5 | 236 | 59511 | 384.39 | 716 | 690 | 153.0 |
| B | 12 | 6 | 27739 | 176.76 | 716 | 690 | 153.0 |
| B | 5 | 185 | 19128 | 120.49 | 716 | 690 | 153.0 |
| C | 4 | 5 | 600078 | 3111.92 | 703 | 697 | 192.6 |
| C | 6 | 223 | 129387 | 668.14 | 703 | 697 | 192.6 |
| C | 14 | 254 | 68683 | 352.98 | 703 | 697 | 192.6 |
| D | 1 | 31 | 313061 | 1589.28 | 698 | 669 | 196.6 |
| D | 6 | 42 | 254881 | 1293.29 | 698 | 669 | 196.6 |
| D | 10 | 181 | 239884 | 1217.0 | 698 | 669 | 196.6 |
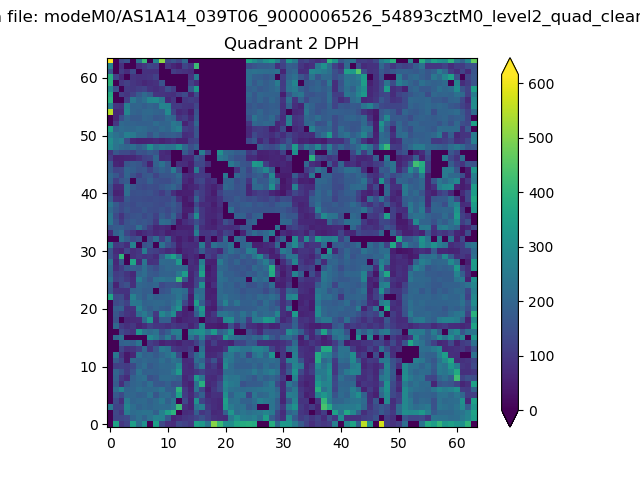
Histogram calculated using DETX and DETY for each event in the final _common_clean file
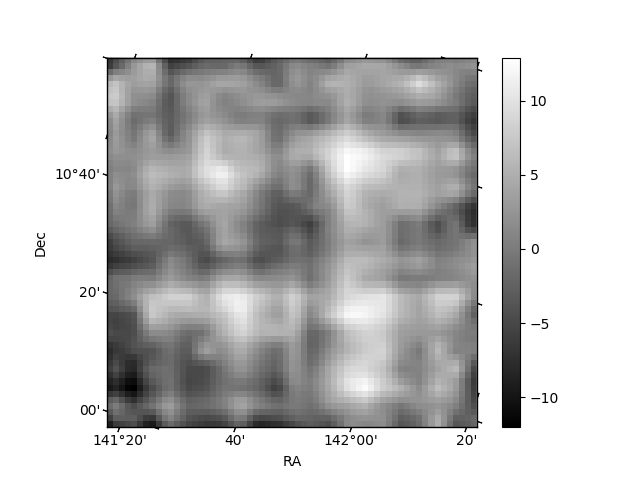
| Quadrant A |  |
 |
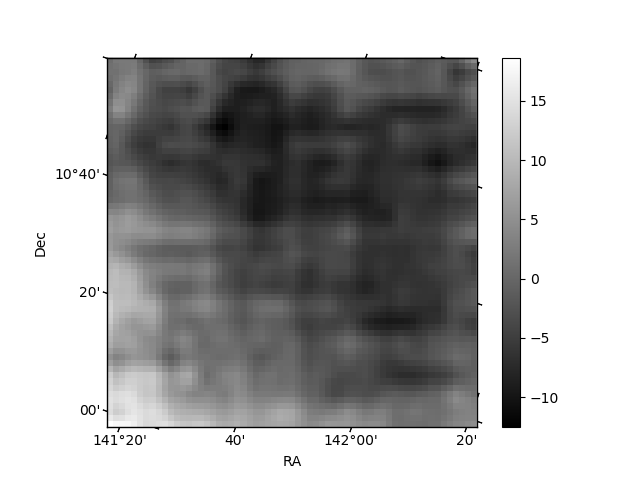
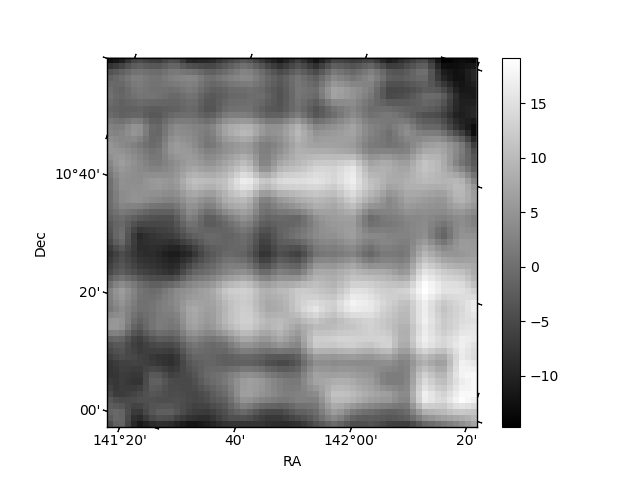
Quadrant B |
|---|---|---|---|
| Quadrant D | 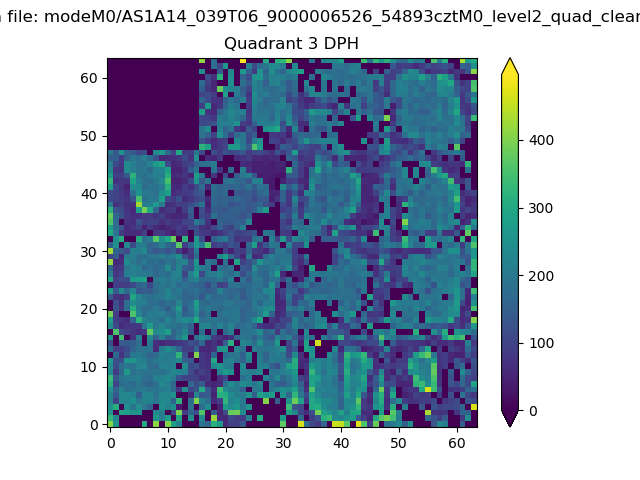 |
 |
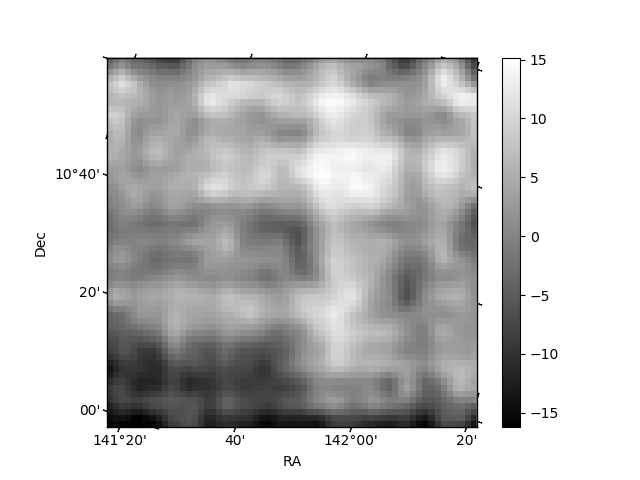
Quadrant C |
| Plot type | Count rate plots | Images |
|---|---|---|
| Comparison with Poisson distribution Blue bars denote a histogram of data divided into 1 sec bins. Red curve is a Poisson curve with rate = median count rate of data. |
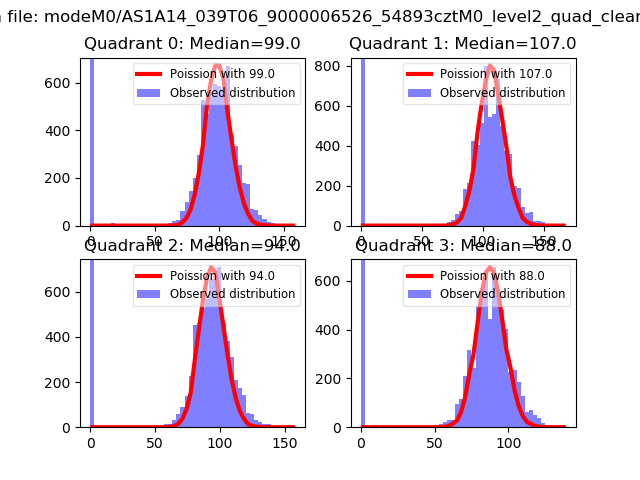 |
 |
| Quadrant-wise count rates Data is divided into 100 sec bins |
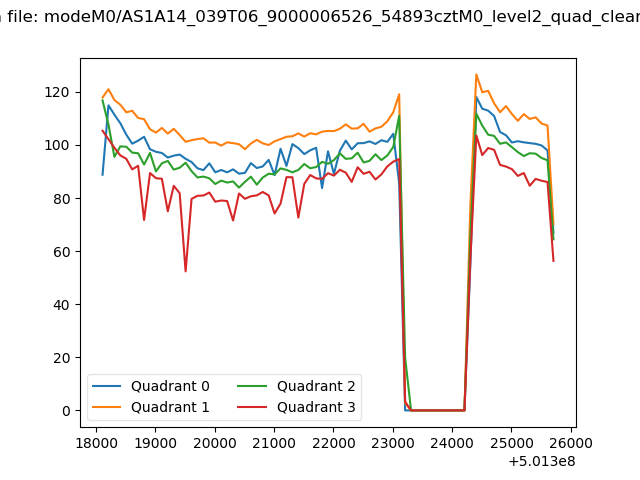 |
|
| Module-wise count rates for Quadrant A Data is divided into 100 sec bins |
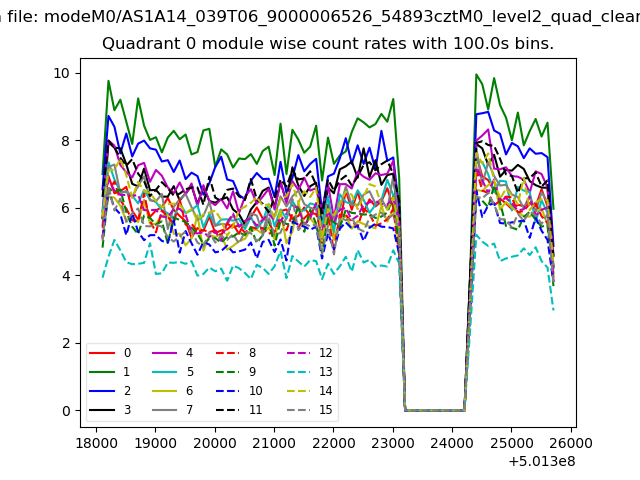 |
 |
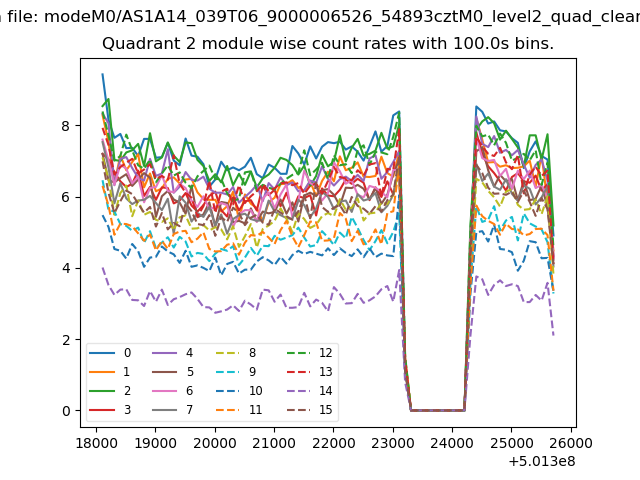
| Module-wise count rates for Quadrant B Data is divided into 100 sec bins |
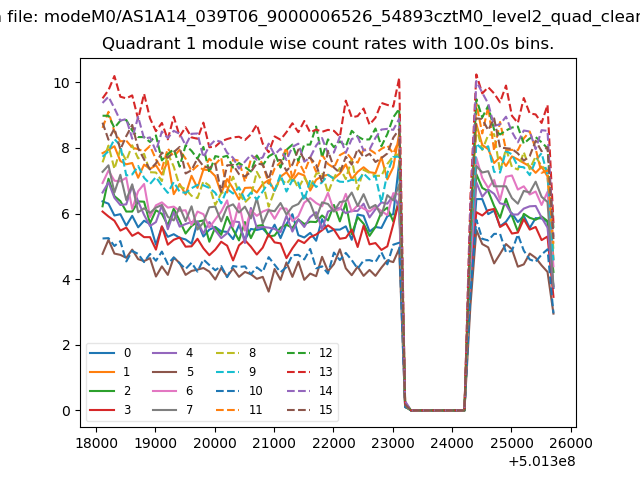 |
 |
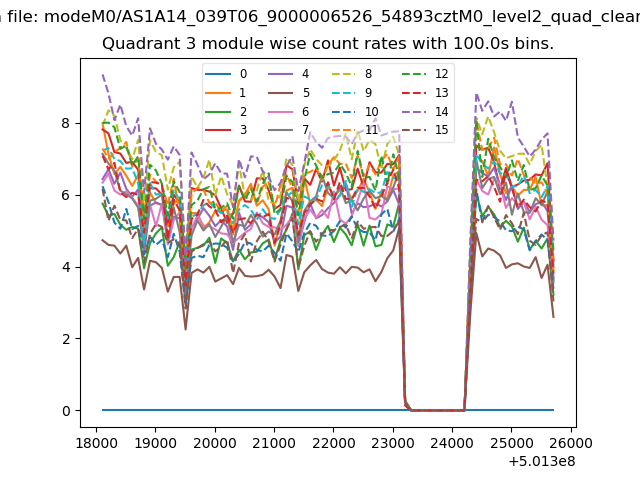
| Module-wise count rates for Quadrant C Data is divided into 100 sec bins |
 |
 |
| Module-wise count rates for Quadrant D Data is divided into 100 sec bins |
 |
 |
| Parameter | Plot |
|---|---|
| CZT HV Monitor | 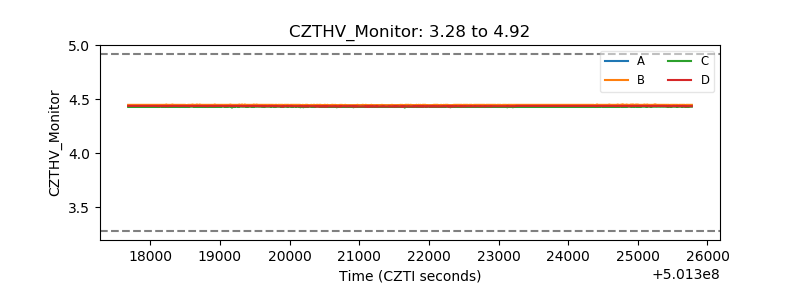 |
| D_VDD | 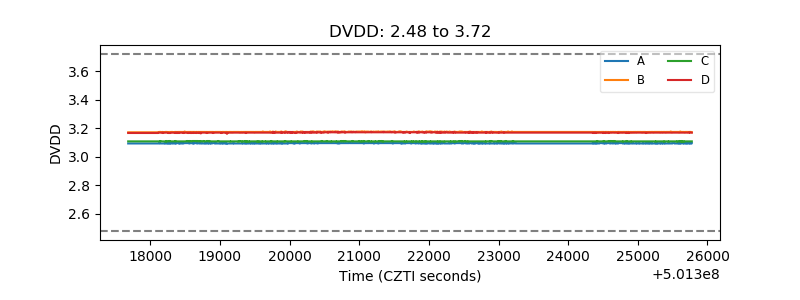 |
| Temperature 1 |  |
| Veto HV Monitor | 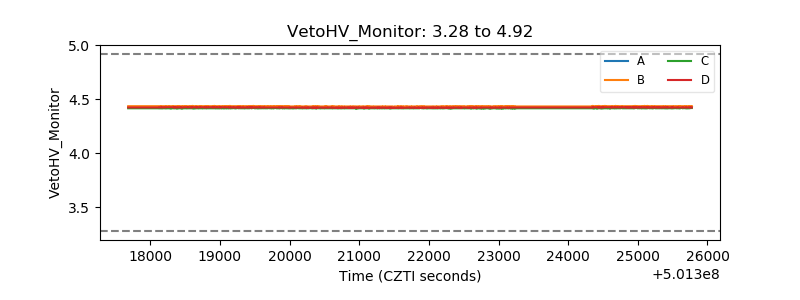 |
| Veto LLD |  |
| Alpha Counter | 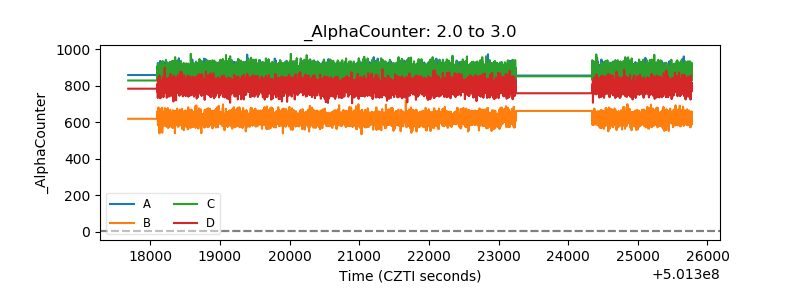 |
| _CPM_Rate | 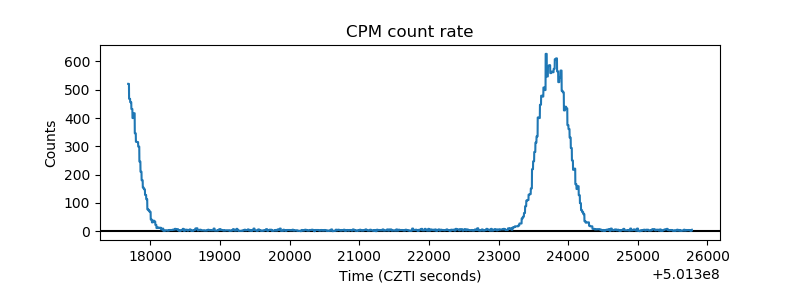 |
| CZT Counter | 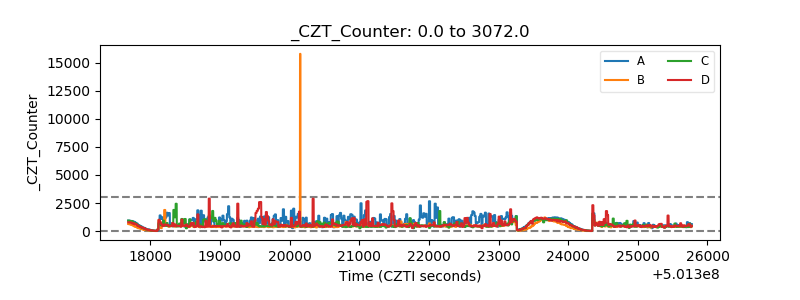 |
| +2.5 Volts monitor |  |
| +5 Volts monitor |  |
| _ROLL_ROT | 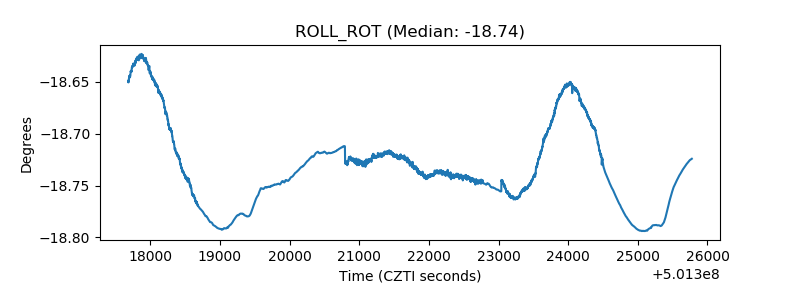 |
| _Roll_DEC | 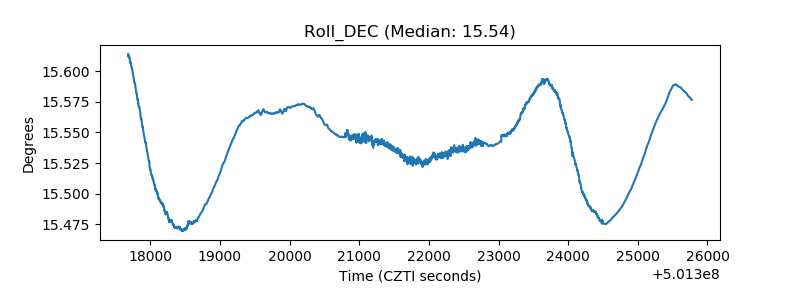 |
| _Roll_RA | 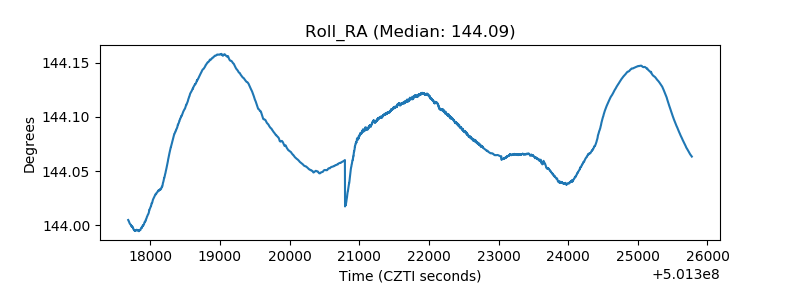 |
| Veto Counter | 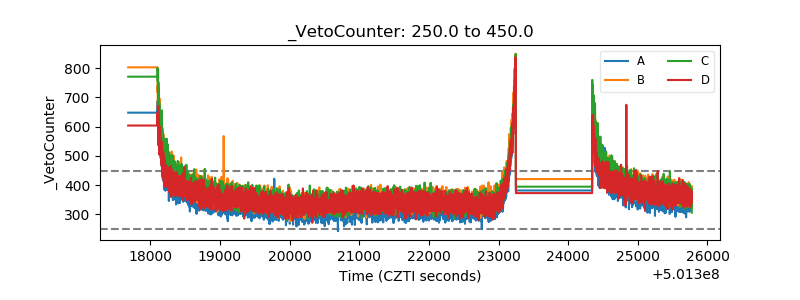 |