| Param | Original file | Final file |
|---|---|---|
| Filename | modeM0/AS1A14_039T06_9000006526_54894cztM0_level2.fits | modeM0/AS1A14_039T06_9000006526_54894cztM0_level2_quad_clean.evt |
| Size (bytes) | 400,423,680 | 97,220,160 |
| Size | 381.9 MB | 92.7 MB |
| Events in quadrant A | 3,689,428 | 641,468 |
| Events in quadrant B | 2,976,639 | 688,577 |
| Events in quadrant C | 3,875,697 | 601,755 |
| Events in quadrant D | 3,780,651 | 563,499 |
| Mode M9 | |||
|---|---|---|---|
| Quadrant | BADHDUFLAG | Total packets | Discarded packets |
| A | 0 | 13 | 0 |
| B | 0 | 14 | 0 |
| C | 0 | 14 | 0 |
| D | 0 | 14 | 0 |
| Mode M0 | |||
|---|---|---|---|
| Quadrant | BADHDUFLAG | Total packets | Discarded packets |
| A | 0 | 15202 | 2 |
| B | 0 | 13417 | 5 |
| C | 0 | 15936 | 9 |
| D | 0 | 15546 | 6 |
| Mode SS | |||
|---|---|---|---|
| Quadrant | BADHDUFLAG | Total packets | Discarded packets |
| A | 0 | 132 | 0 |
| B | 0 | 132 | 0 |
| C | 0 | 132 | 0 |
| D | 0 | 132 | 0 |
| Quadrant | Total seconds | Saturated seconds | Saturation percentage |
|---|---|---|---|
| A | 6429 | 89 | 1.384352% |
| B | 6427 | 91 | 1.415902% |
| C | 6427 | 228 | 3.547534% |
| D | 6426 | 204 | 3.174603% |
Noise dominated data is calculated using 1-second bins in cleaned event files. If a bin has >2000 counts, and if more than 50% of those come from <1% of pixels, then it is considered to be noise-dominated and hence unusable.
| Quadrant | # 1 sec bins | Bins with >0 counts | Bins with >2000 counts | High rate bins dominated by noise | Noise dominated (total time) | Noise dominated (detector-on time) | Marked lightcurve |
|---|---|---|---|---|---|---|---|
| A | 7549 | 6430 | 2 | 2 | 0.03% | 0.03% | 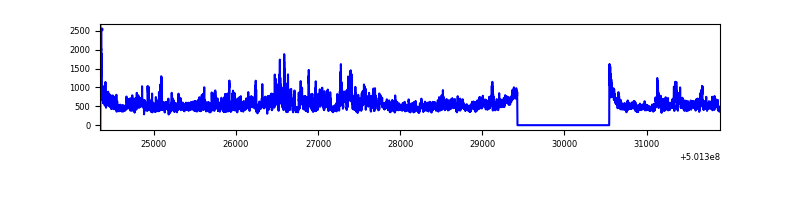 |
| B | 7549 | 6429 | 3 | 3 | 0.04% | 0.05% | 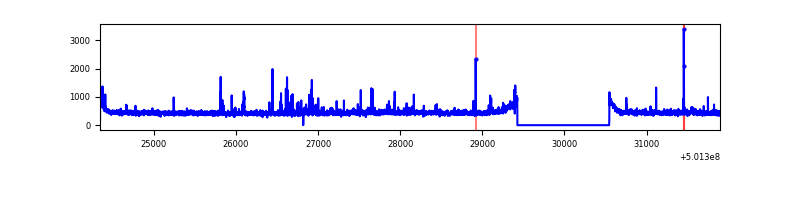 |
| C | 7549 | 6429 | 173 | 173 | 2.29% | 2.69% |  |
| D | 7548 | 6428 | 106 | 106 | 1.40% | 1.65% | 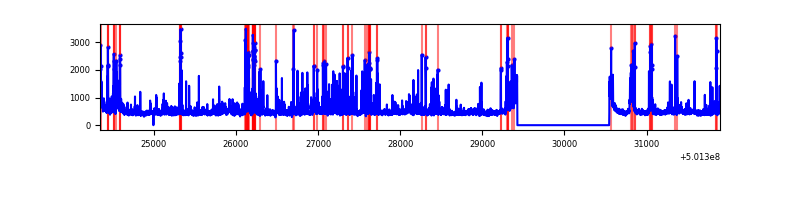 |
Top three noisy pixels from each quadrant. If the there are fewer than three noisy pixels in the level2.evt file, extra rows are filled as -1
| Pixel properties | Quadrant properties | ||||||
|---|---|---|---|---|---|---|---|
| Quadrant | DetID | PixID | Counts | Sigma | Mean | Median | Sigma |
| A | 3 | 14 | 864012 | 4789.47 | 721 | 702 | 180.3 |
| A | 13 | 254 | 18954 | 101.26 | 721 | 702 | 180.3 |
| A | 4 | 3 | 13063 | 68.58 | 721 | 702 | 180.3 |
| B | 10 | 247 | 50362 | 329.61 | 706 | 680 | 150.7 |
| B | 5 | 185 | 45760 | 299.08 | 706 | 680 | 150.7 |
| B | 5 | 236 | 23908 | 154.1 | 706 | 680 | 150.7 |
| C | 6 | 223 | 741140 | 3913.95 | 691 | 684 | 189.2 |
| C | 4 | 5 | 140419 | 738.62 | 691 | 684 | 189.2 |
| C | 14 | 254 | 104800 | 550.34 | 691 | 684 | 189.2 |
| D | 10 | 181 | 252935 | 1293.21 | 693 | 664 | 195.1 |
| D | 6 | 46 | 216125 | 1104.51 | 693 | 664 | 195.1 |
| D | 1 | 31 | 160688 | 820.32 | 693 | 664 | 195.1 |
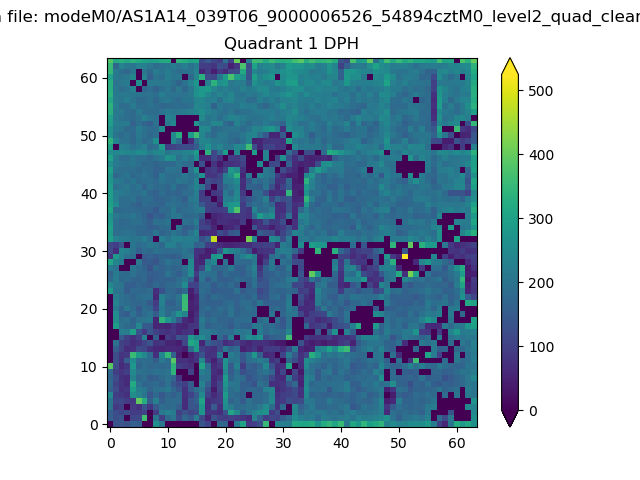
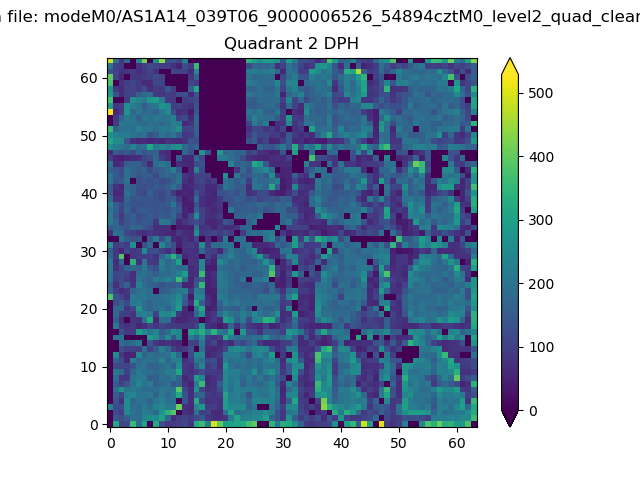
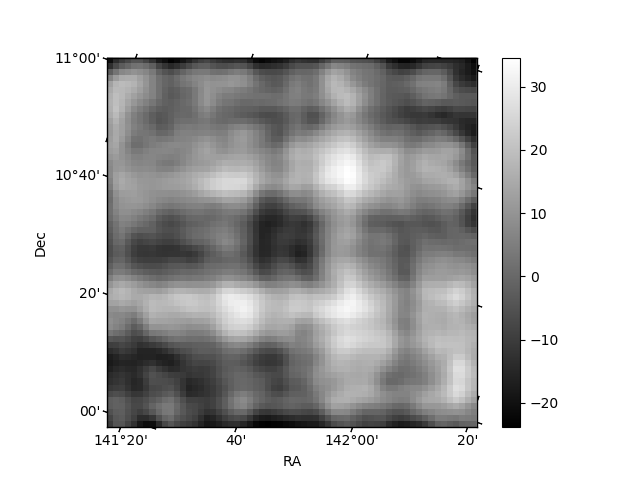
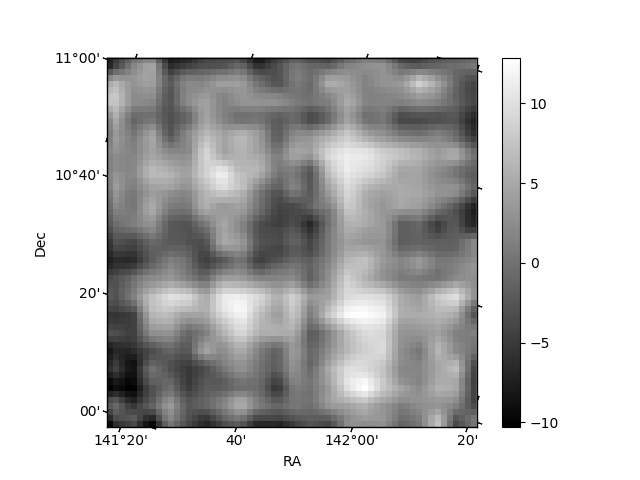
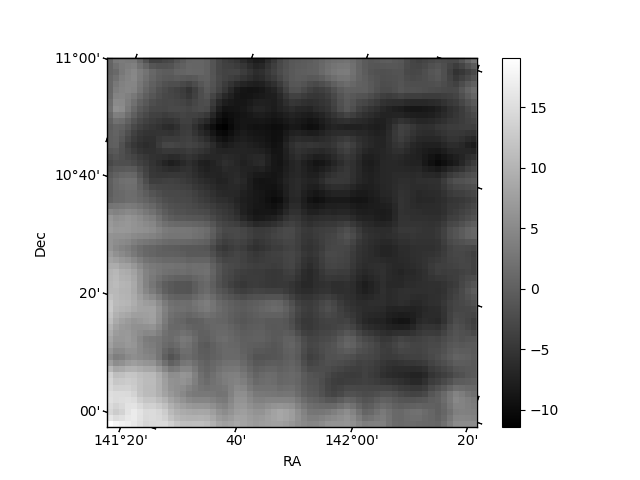
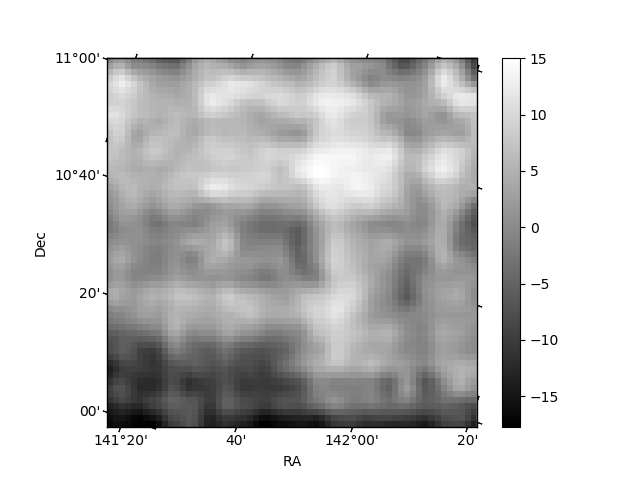
Histogram calculated using DETX and DETY for each event in the final _common_clean file
| Quadrant A | 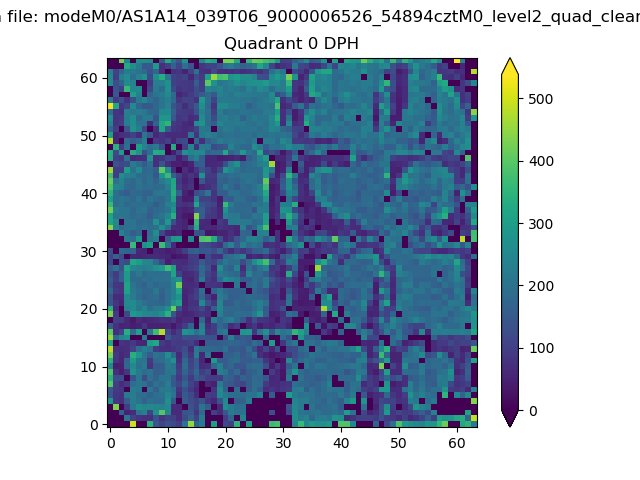 |
 |
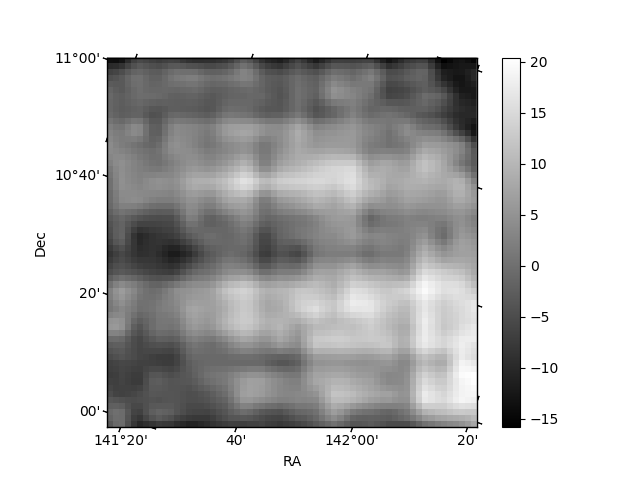
Quadrant B |
|---|---|---|---|
| Quadrant D | 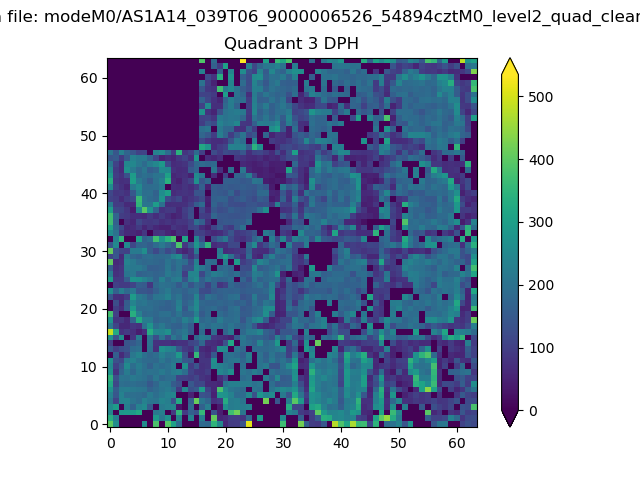 |
 |
Quadrant C |
| Plot type | Count rate plots | Images |
|---|---|---|
| Comparison with Poisson distribution Blue bars denote a histogram of data divided into 1 sec bins. Red curve is a Poisson curve with rate = median count rate of data. |
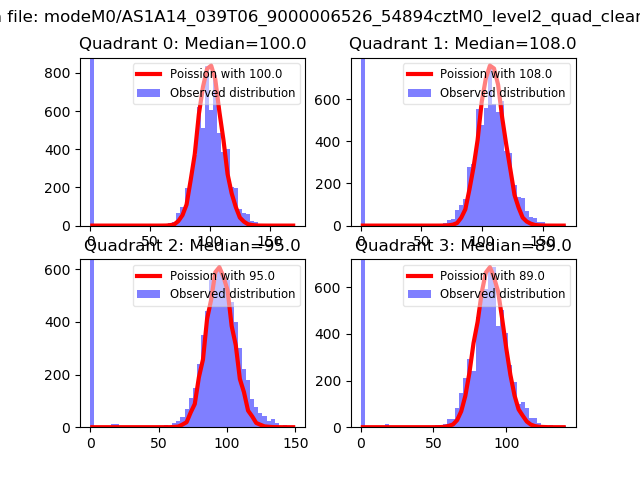 |
 |
| Quadrant-wise count rates Data is divided into 100 sec bins |
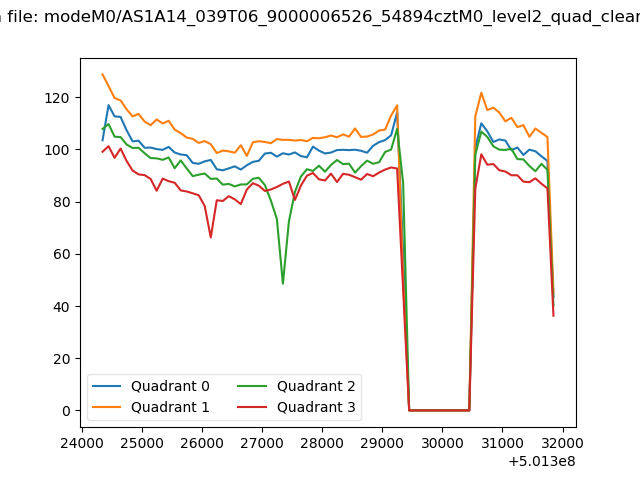 |
|
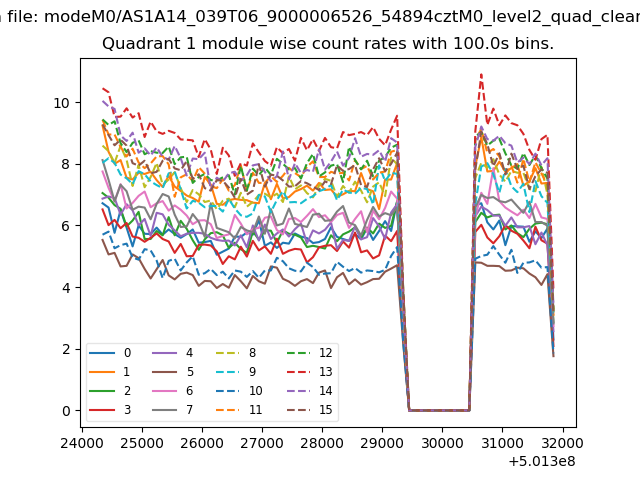
| Module-wise count rates for Quadrant A Data is divided into 100 sec bins |
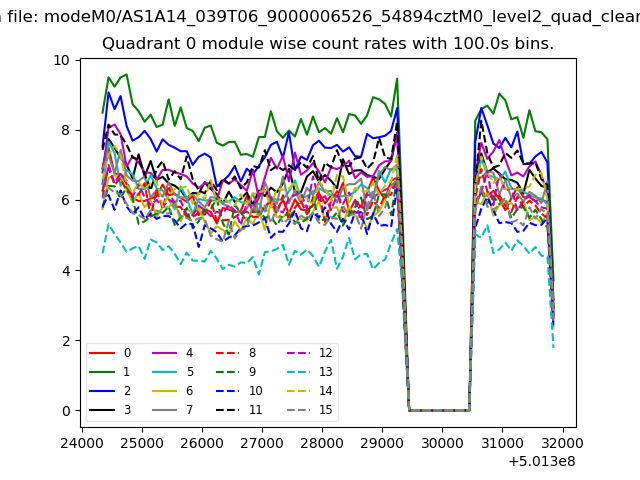 |
 |
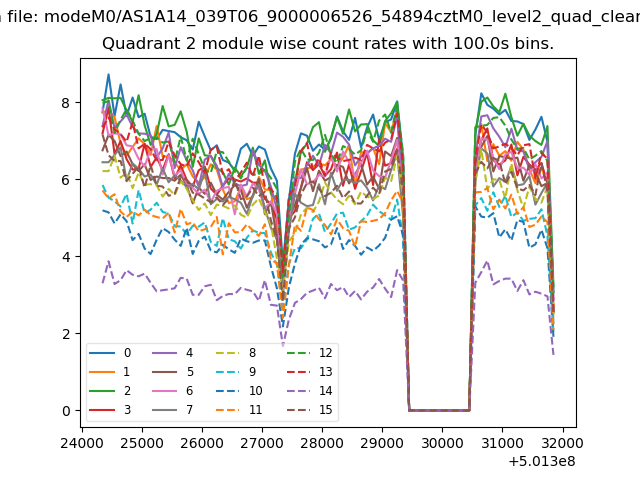
| Module-wise count rates for Quadrant B Data is divided into 100 sec bins |
 |
 |
| Module-wise count rates for Quadrant C Data is divided into 100 sec bins |
 |
 |
| Module-wise count rates for Quadrant D Data is divided into 100 sec bins |
 |
 |
| Parameter | Plot |
|---|---|
| CZT HV Monitor | 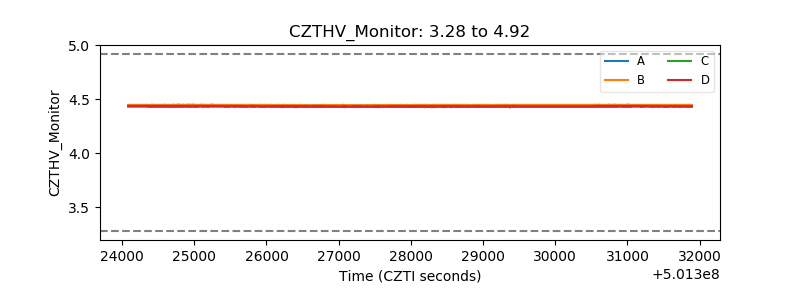 |
| D_VDD | 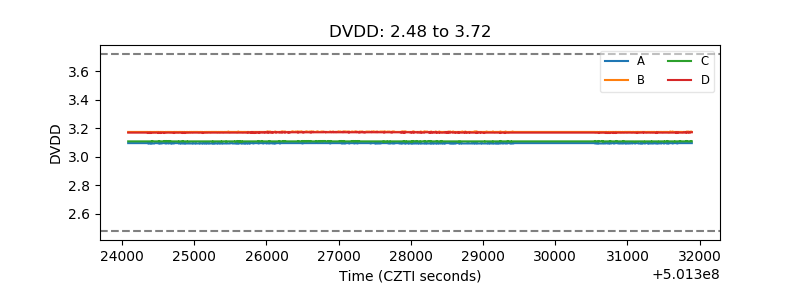 |
| Temperature 1 | 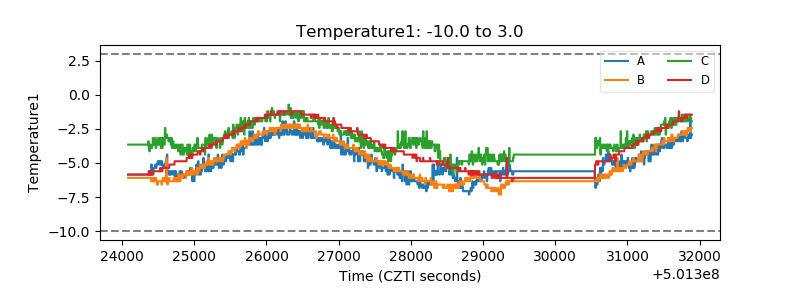 |
| Veto HV Monitor | 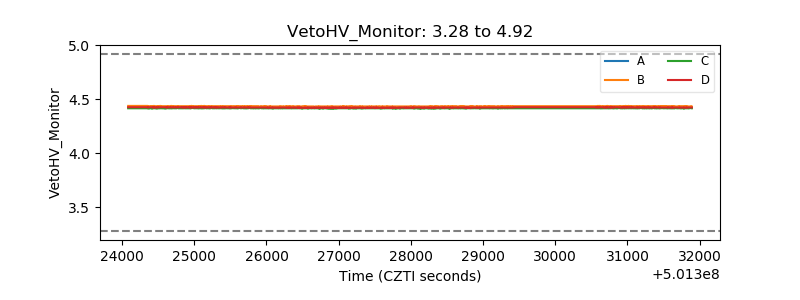 |
| Veto LLD | 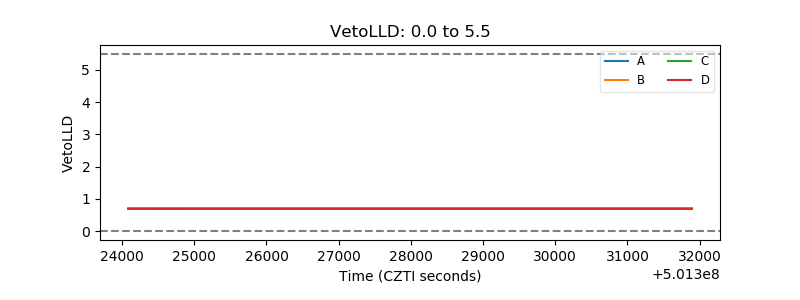 |
| Alpha Counter | 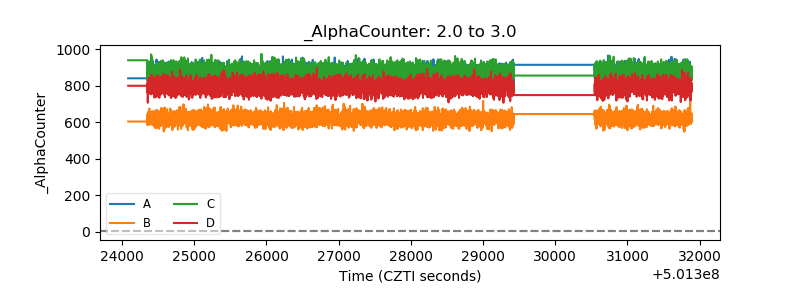 |
| _CPM_Rate | 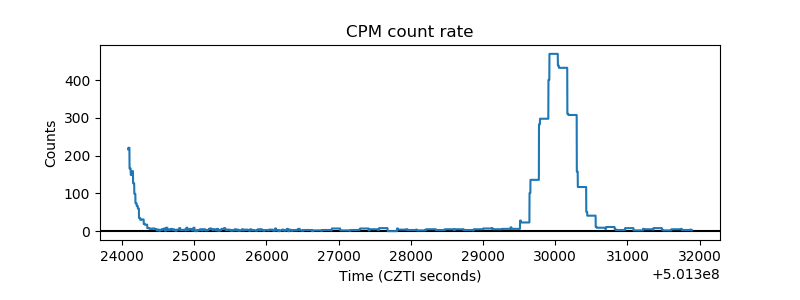 |
| CZT Counter | 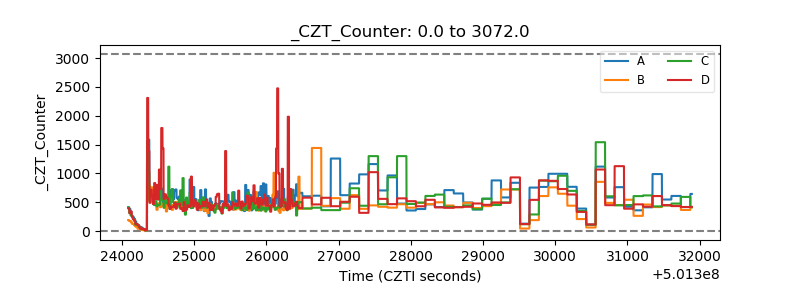 |
| +2.5 Volts monitor |  |
| +5 Volts monitor |  |
| _ROLL_ROT | 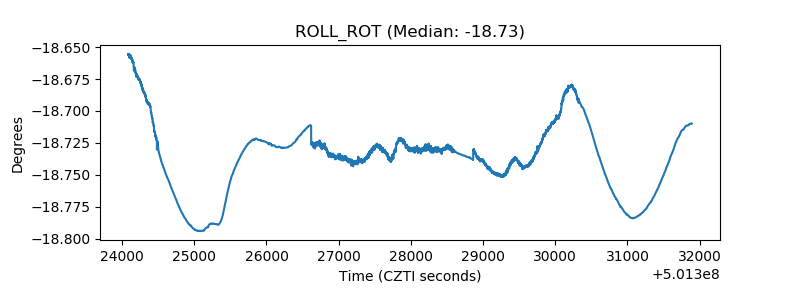 |
| _Roll_DEC | 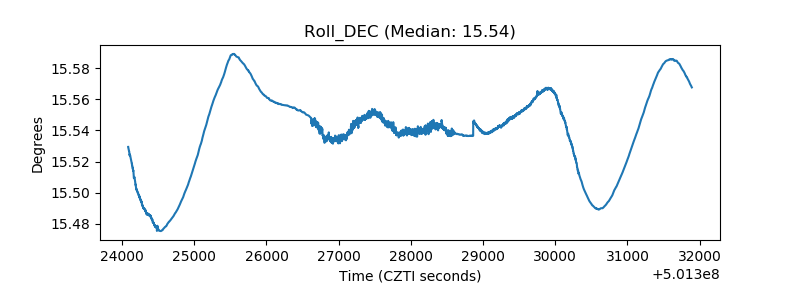 |
| _Roll_RA | 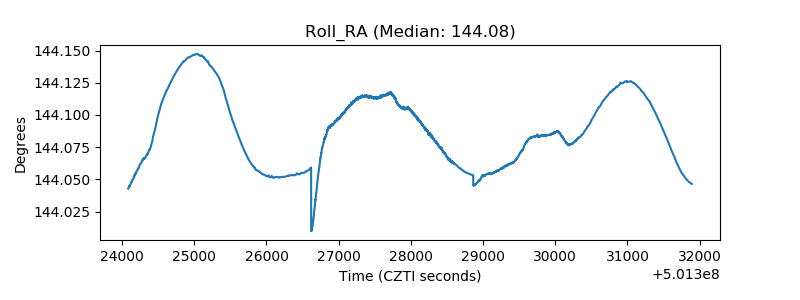 |
| Veto Counter | 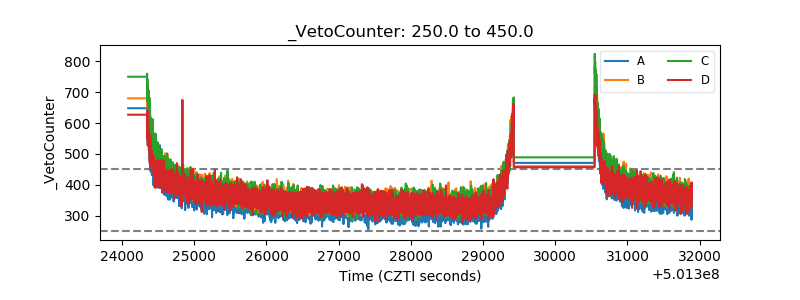 |