| Param | Original file | Final file |
|---|---|---|
| Filename | modeM0/AS1A14_039T06_9000006526_54896cztM0_level2.fits | modeM0/AS1A14_039T06_9000006526_54896cztM0_level2_quad_clean.evt |
| Size (bytes) | 566,400,960 | 100,065,600 |
| Size | 540.2 MB | 95.4 MB |
| Events in quadrant A | 8,439,154 | 571,450 |
| Events in quadrant B | 3,490,730 | 727,631 |
| Events in quadrant C | 4,126,272 | 631,672 |
| Events in quadrant D | 4,355,425 | 601,447 |
| Mode M9 | |||
|---|---|---|---|
| Quadrant | BADHDUFLAG | Total packets | Discarded packets |
| A | 0 | 15 | 0 |
| B | 0 | 15 | 0 |
| C | 0 | 16 | 0 |
| D | 0 | 16 | 0 |
| Mode M0 | |||
|---|---|---|---|
| Quadrant | BADHDUFLAG | Total packets | Discarded packets |
| A | 0 | 30085 | 2 |
| B | 0 | 15522 | 2 |
| C | 0 | 17283 | 2 |
| D | 0 | 17886 | 2 |
| Mode SS | |||
|---|---|---|---|
| Quadrant | BADHDUFLAG | Total packets | Discarded packets |
| A | 0 | 146 | 0 |
| B | 0 | 146 | 0 |
| C | 0 | 146 | 0 |
| D | 0 | 146 | 0 |
| Quadrant | Total seconds | Saturated seconds | Saturation percentage |
|---|---|---|---|
| A | 7144 | 1483 | 20.758679% |
| B | 7144 | 172 | 2.407615% |
| C | 7144 | 298 | 4.171333% |
| D | 7144 | 234 | 3.275476% |
Noise dominated data is calculated using 1-second bins in cleaned event files. If a bin has >2000 counts, and if more than 50% of those come from <1% of pixels, then it is considered to be noise-dominated and hence unusable.
| Quadrant | # 1 sec bins | Bins with >0 counts | Bins with >2000 counts | High rate bins dominated by noise | Noise dominated (total time) | Noise dominated (detector-on time) | Marked lightcurve |
|---|---|---|---|---|---|---|---|
| A | 8009 | 7145 | 1243 | 1243 | 15.52% | 17.40% | 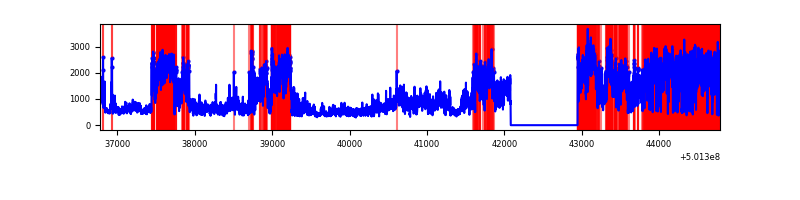 |
| B | 8009 | 7145 | 29 | 29 | 0.36% | 0.41% | 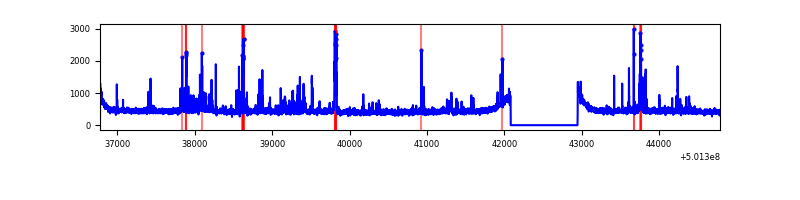 |
| C | 8009 | 7145 | 167 | 167 | 2.09% | 2.34% | 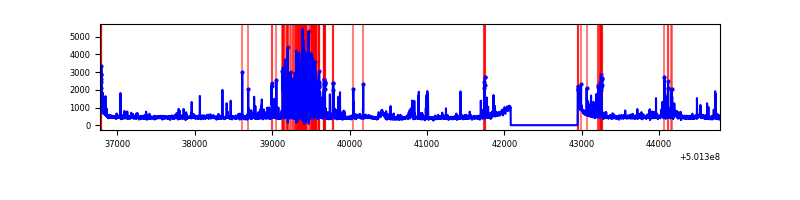 |
| D | 8009 | 7145 | 128 | 128 | 1.60% | 1.79% | 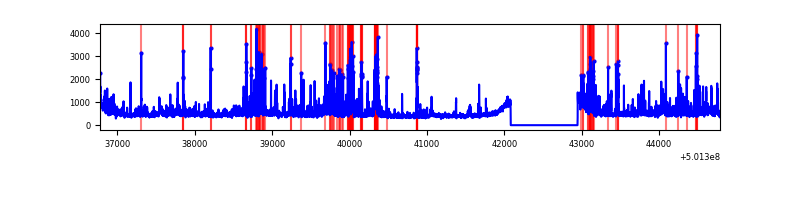 |
Top three noisy pixels from each quadrant. If the there are fewer than three noisy pixels in the level2.evt file, extra rows are filled as -1
| Pixel properties | Quadrant properties | ||||||
|---|---|---|---|---|---|---|---|
| Quadrant | DetID | PixID | Counts | Sigma | Mean | Median | Sigma |
| A | 3 | 14 | 3417664 | 18498.0 | 743 | 725 | 184.7 |
| A | 12 | 115 | 2021487 | 10939.63 | 743 | 725 | 184.7 |
| A | 7 | 14 | 49633 | 264.77 | 743 | 725 | 184.7 |
| B | 5 | 185 | 263533 | 1565.05 | 778 | 749 | 167.9 |
| B | 9 | 251 | 58676 | 344.99 | 778 | 749 | 167.9 |
| B | 12 | 111 | 20483 | 117.53 | 778 | 749 | 167.9 |
| C | 4 | 5 | 578484 | 2782.04 | 763 | 756 | 207.7 |
| C | 3 | 242 | 134975 | 646.33 | 763 | 756 | 207.7 |
| C | 15 | 1 | 113996 | 545.31 | 763 | 756 | 207.7 |
| D | 15 | 94 | 400872 | 1835.94 | 770 | 737 | 217.9 |
| D | 2 | 249 | 237468 | 1086.19 | 770 | 737 | 217.9 |
| D | 10 | 181 | 92977 | 423.22 | 770 | 737 | 217.9 |
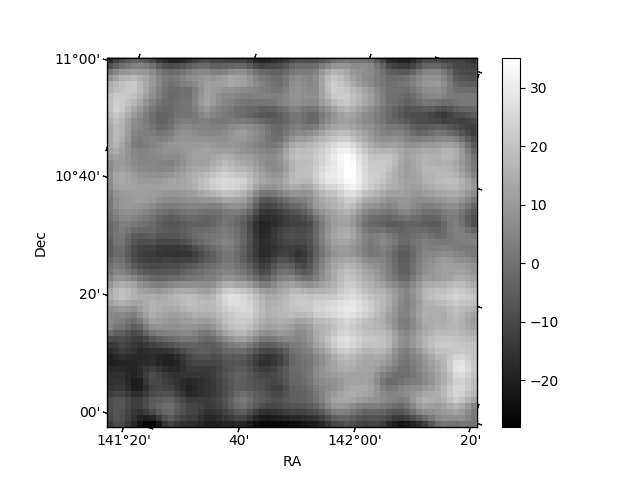
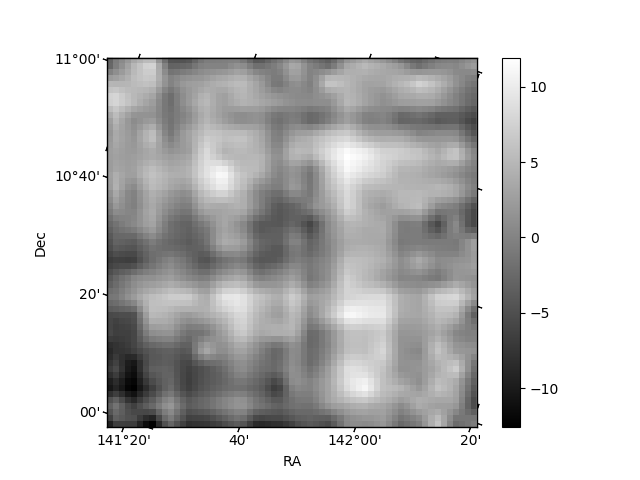
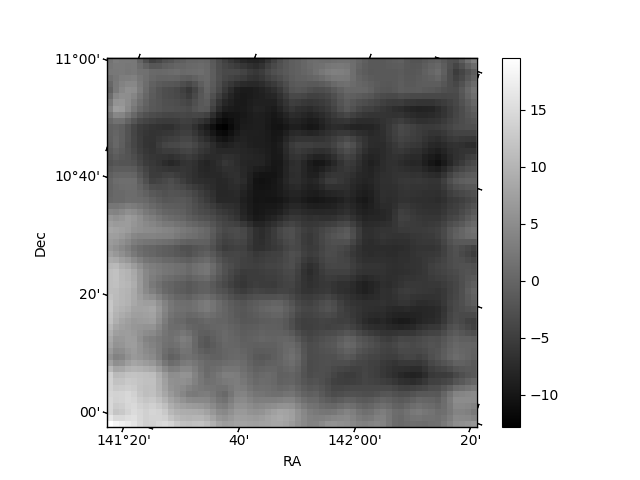
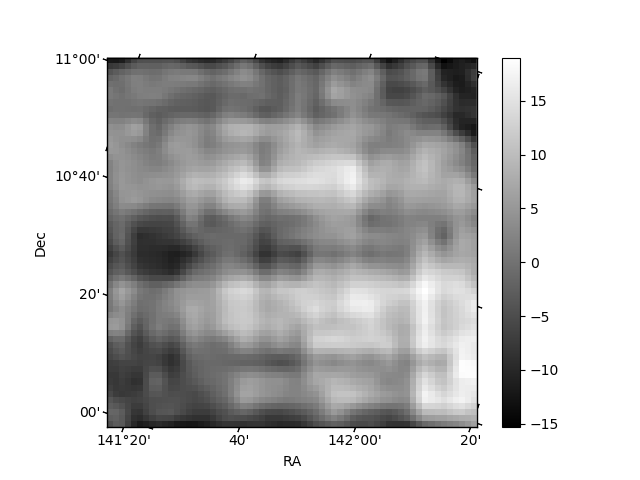
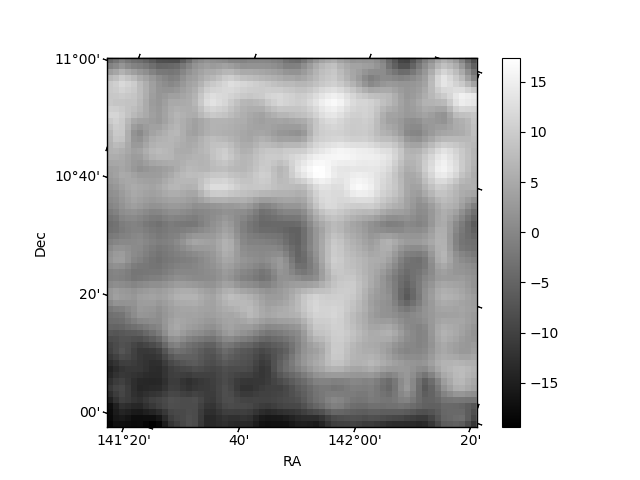
Histogram calculated using DETX and DETY for each event in the final _common_clean file
| Quadrant A | 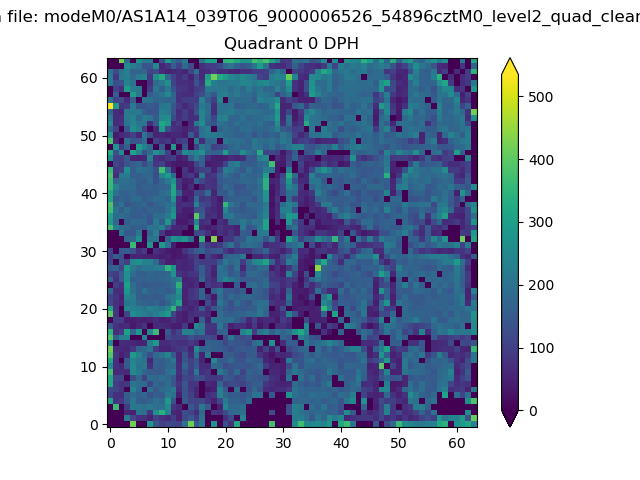 |
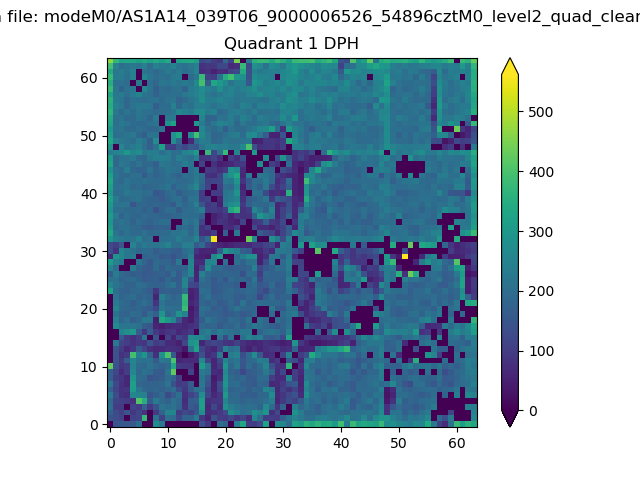 |
Quadrant B |
|---|---|---|---|
| Quadrant D | 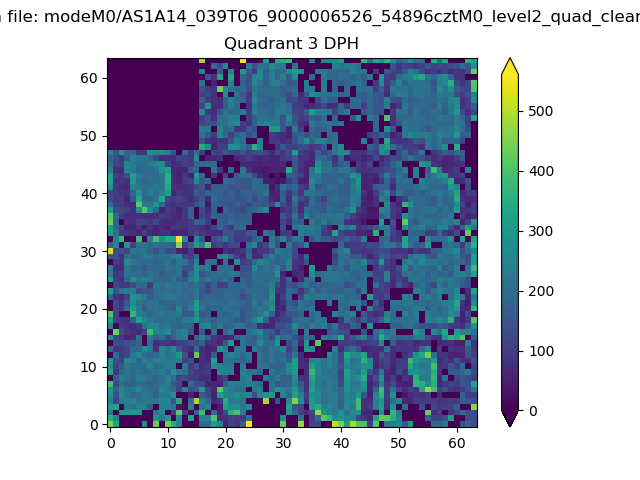 |
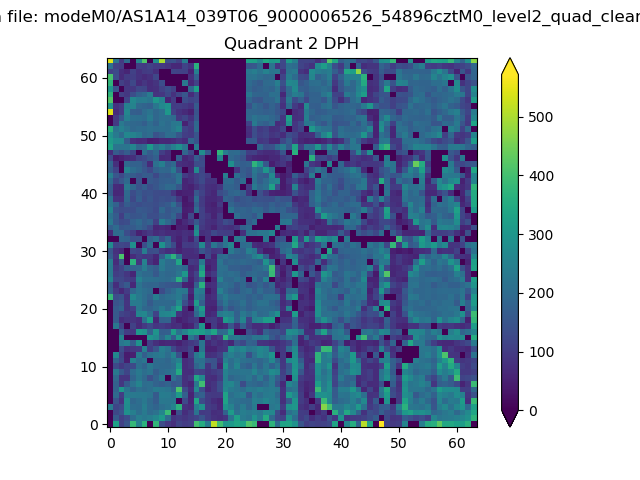 |
Quadrant C |
| Plot type | Count rate plots | Images |
|---|---|---|
| Comparison with Poisson distribution Blue bars denote a histogram of data divided into 1 sec bins. Red curve is a Poisson curve with rate = median count rate of data. |
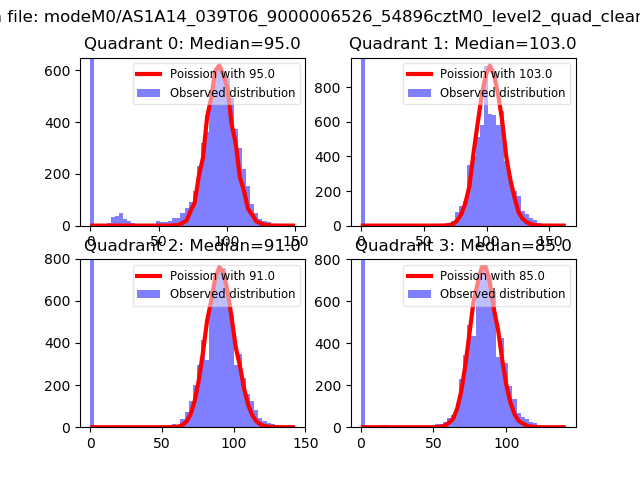 |
 |
| Quadrant-wise count rates Data is divided into 100 sec bins |
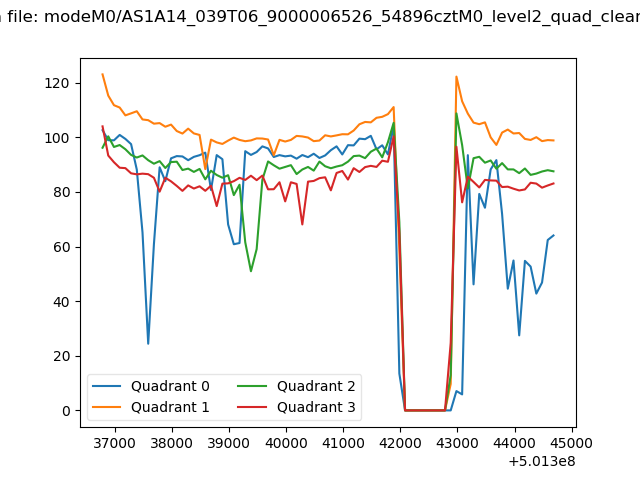 |
|
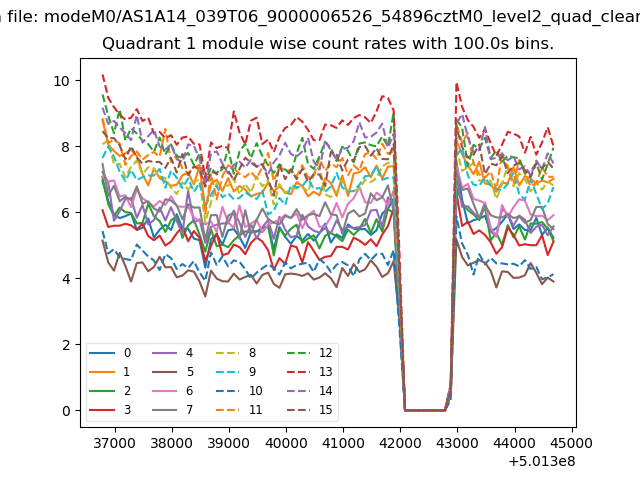
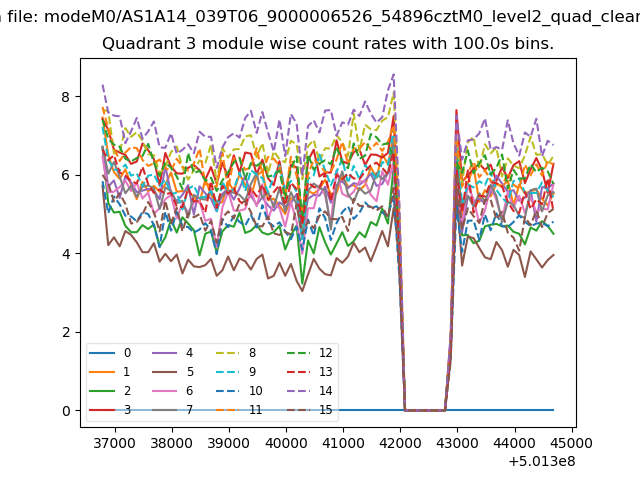
| Module-wise count rates for Quadrant A Data is divided into 100 sec bins |
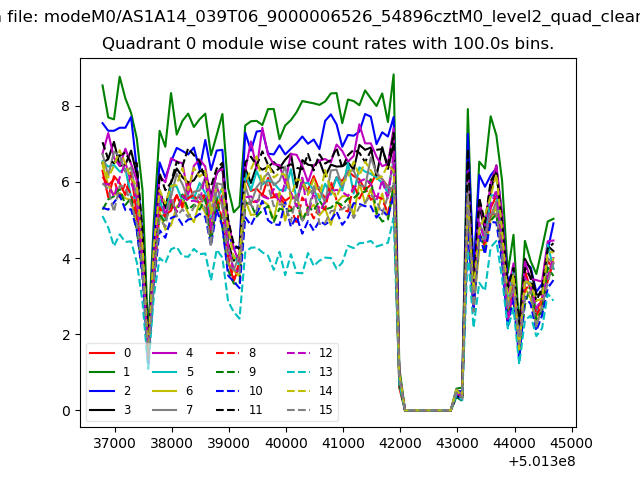 |
 |
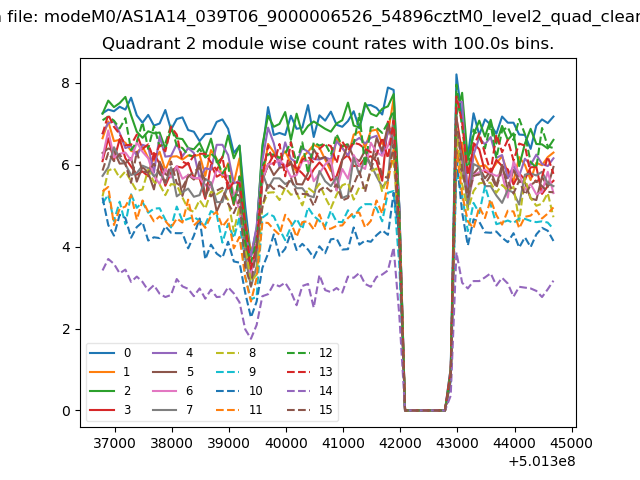
| Module-wise count rates for Quadrant B Data is divided into 100 sec bins |
 |
 |
| Module-wise count rates for Quadrant C Data is divided into 100 sec bins |
 |
 |
| Module-wise count rates for Quadrant D Data is divided into 100 sec bins |
 |
 |
| Parameter | Plot |
|---|---|
| CZT HV Monitor | 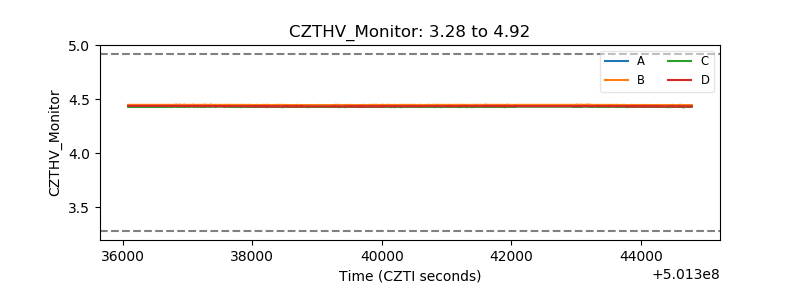 |
| D_VDD | 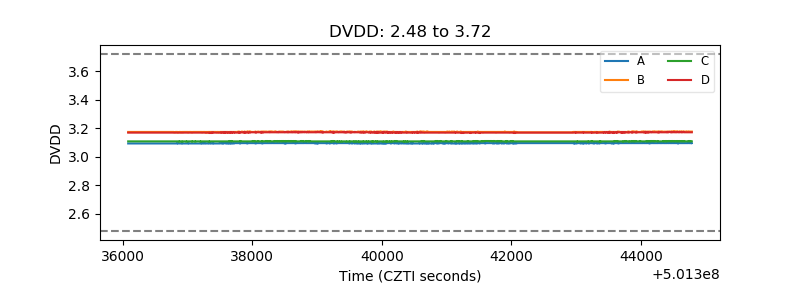 |
| Temperature 1 | 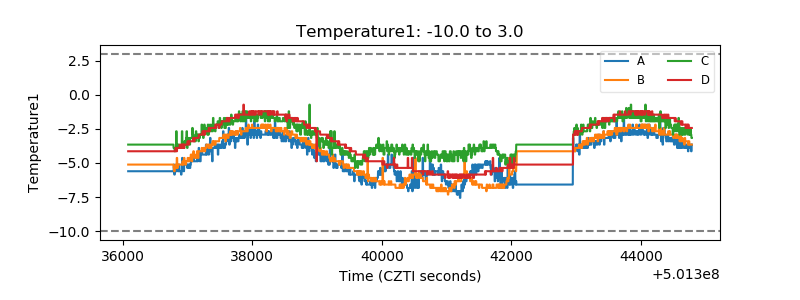 |
| Veto HV Monitor | 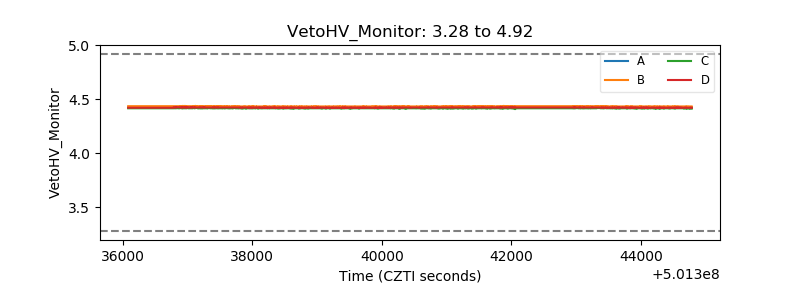 |
| Veto LLD | 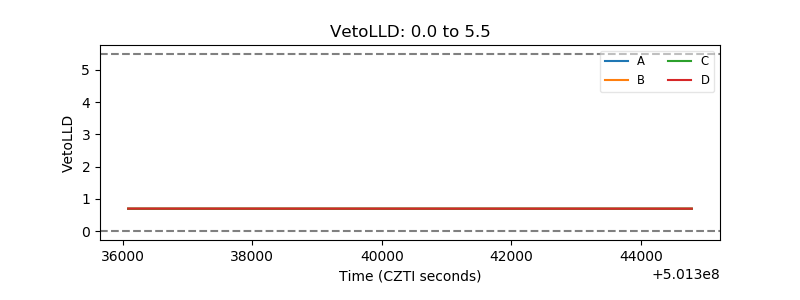 |
| Alpha Counter | 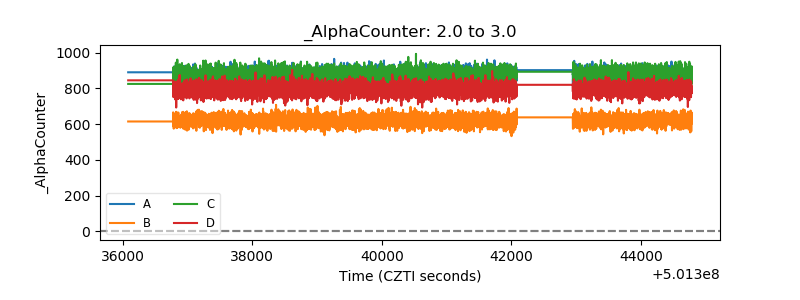 |
| _CPM_Rate | 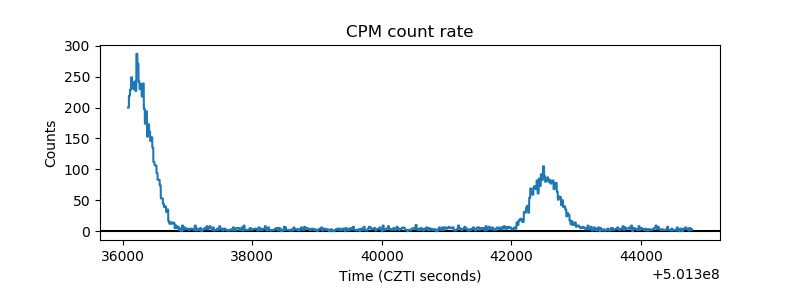 |
| CZT Counter | 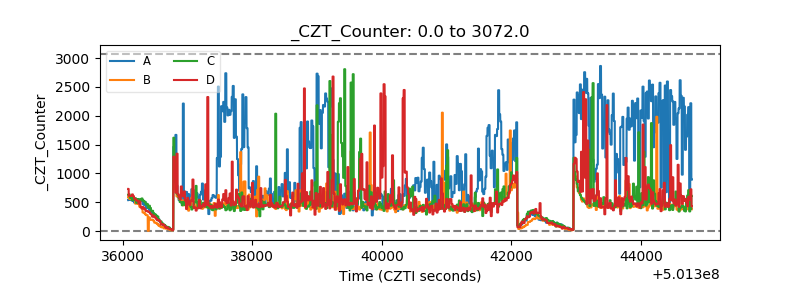 |
| +2.5 Volts monitor | 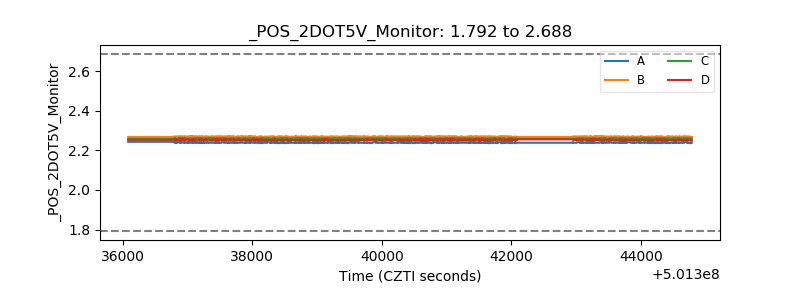 |
| +5 Volts monitor |  |
| _ROLL_ROT | 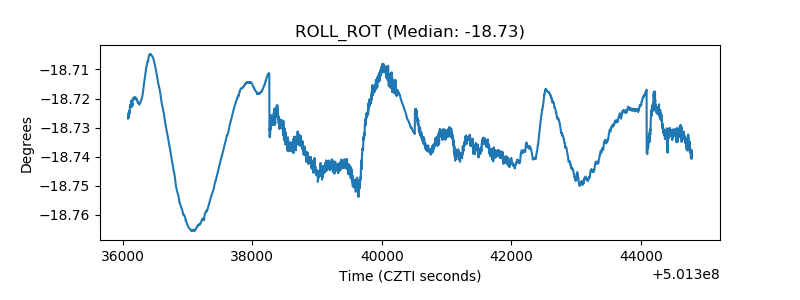 |
| _Roll_DEC | 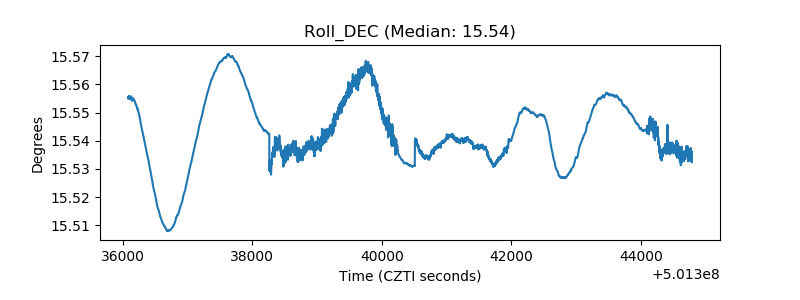 |
| _Roll_RA |  |
| Veto Counter | 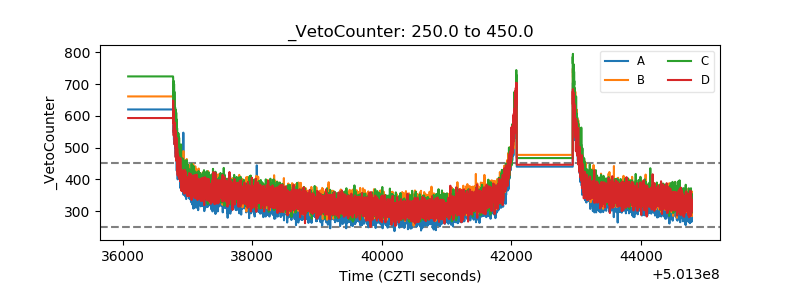 |