| Param | Original file | Final file |
|---|---|---|
| Filename | modeM0/AS1A14_039T06_9000006526_54897cztM0_level2.fits | modeM0/AS1A14_039T06_9000006526_54897cztM0_level2_quad_clean.evt |
| Size (bytes) | 682,706,880 | 96,071,040 |
| Size | 651.1 MB | 91.6 MB |
| Events in quadrant A | 10,305,945 | 550,470 |
| Events in quadrant B | 3,608,312 | 706,110 |
| Events in quadrant C | 6,045,967 | 569,463 |
| Events in quadrant D | 4,759,156 | 586,427 |
| Mode M9 | |||
|---|---|---|---|
| Quadrant | BADHDUFLAG | Total packets | Discarded packets |
| A | 0 | 5 | 0 |
| B | 0 | 5 | 0 |
| C | 0 | 5 | 0 |
| D | 0 | 5 | 0 |
| Mode M0 | |||
|---|---|---|---|
| Quadrant | BADHDUFLAG | Total packets | Discarded packets |
| A | 0 | 35587 | 1 |
| B | 0 | 15974 | 2 |
| C | 0 | 22953 | 1 |
| D | 0 | 19192 | 1 |
| Mode SS | |||
|---|---|---|---|
| Quadrant | BADHDUFLAG | Total packets | Discarded packets |
| A | 0 | 144 | 0 |
| B | 0 | 144 | 0 |
| C | 0 | 144 | 0 |
| D | 0 | 144 | 0 |
| Quadrant | Total seconds | Saturated seconds | Saturation percentage |
|---|---|---|---|
| A | 7127 | 1765 | 24.764978% |
| B | 7126 | 230 | 3.227617% |
| C | 7127 | 948 | 13.301529% |
| D | 7127 | 313 | 4.391750% |
Noise dominated data is calculated using 1-second bins in cleaned event files. If a bin has >2000 counts, and if more than 50% of those come from <1% of pixels, then it is considered to be noise-dominated and hence unusable.
| Quadrant | # 1 sec bins | Bins with >0 counts | Bins with >2000 counts | High rate bins dominated by noise | Noise dominated (total time) | Noise dominated (detector-on time) | Marked lightcurve |
|---|---|---|---|---|---|---|---|
| A | 7617 | 7128 | 1704 | 1704 | 22.37% | 23.91% | 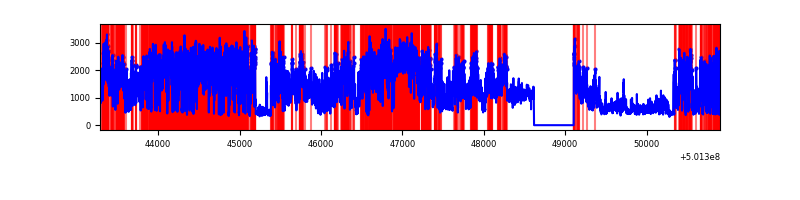 |
| B | 7616 | 7127 | 45 | 45 | 0.59% | 0.63% | 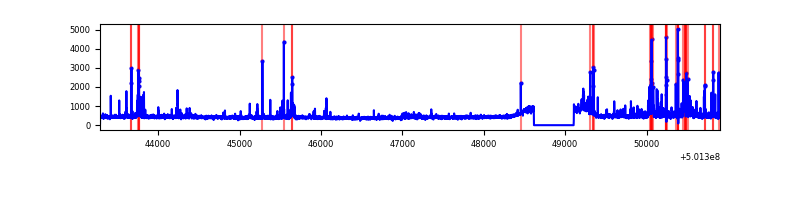 |
| C | 7617 | 7128 | 637 | 637 | 8.36% | 8.94% | 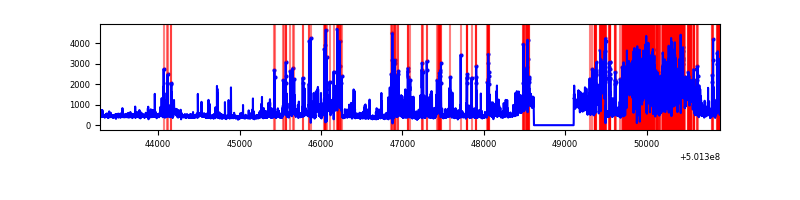 |
| D | 7617 | 7128 | 238 | 238 | 3.12% | 3.34% | 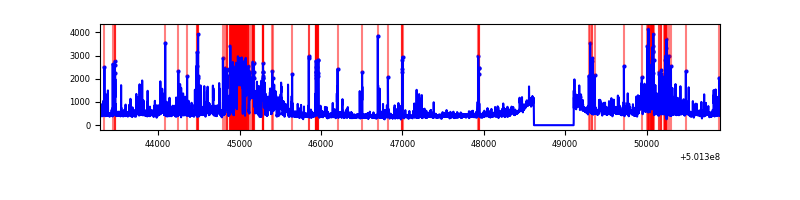 |
Top three noisy pixels from each quadrant. If the there are fewer than three noisy pixels in the level2.evt file, extra rows are filled as -1
| Pixel properties | Quadrant properties | ||||||
|---|---|---|---|---|---|---|---|
| Quadrant | DetID | PixID | Counts | Sigma | Mean | Median | Sigma |
| A | 3 | 14 | 5464339 | 30144.72 | 736 | 720 | 181.2 |
| A | 12 | 115 | 1752780 | 9666.74 | 736 | 720 | 181.2 |
| A | 3 | 79 | 101409 | 555.54 | 736 | 720 | 181.2 |
| B | 5 | 185 | 299996 | 1801.02 | 765 | 737 | 166.2 |
| B | 10 | 247 | 199549 | 1196.5 | 765 | 737 | 166.2 |
| B | 5 | 236 | 38800 | 229.07 | 765 | 737 | 166.2 |
| C | 4 | 5 | 2735402 | 13788.85 | 724 | 717 | 198.3 |
| C | 14 | 254 | 137004 | 687.19 | 724 | 717 | 198.3 |
| C | 15 | 147 | 118273 | 592.74 | 724 | 717 | 198.3 |
| D | 7 | 70 | 681889 | 3225.75 | 755 | 724 | 211.2 |
| D | 10 | 181 | 263139 | 1242.7 | 755 | 724 | 211.2 |
| D | 15 | 94 | 260426 | 1229.86 | 755 | 724 | 211.2 |
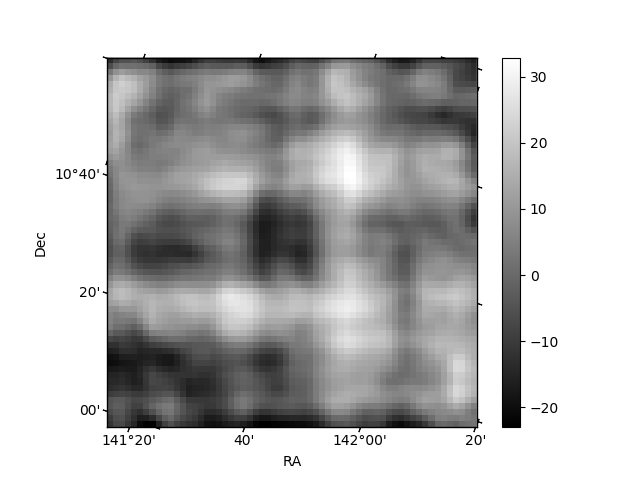
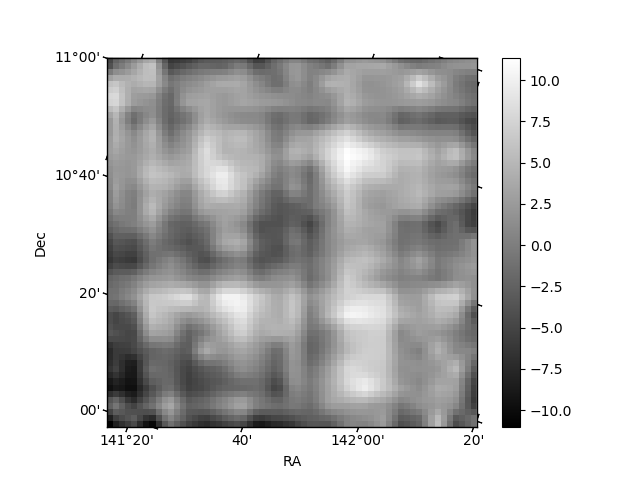
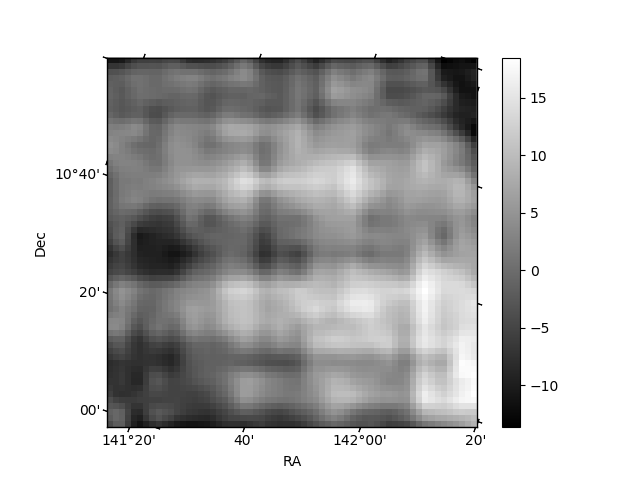
Histogram calculated using DETX and DETY for each event in the final _common_clean file
| Quadrant A | 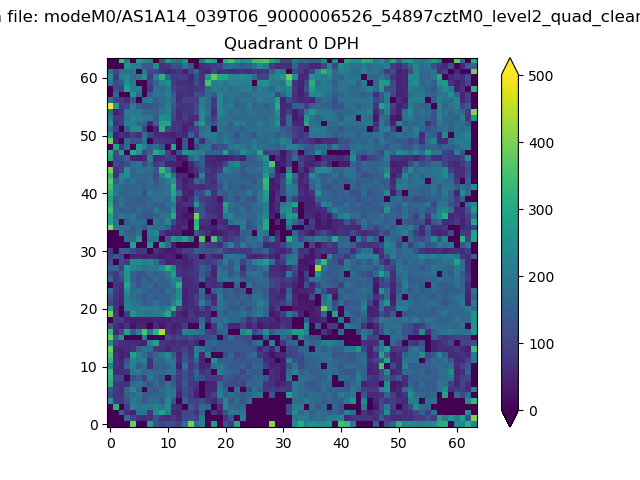 |
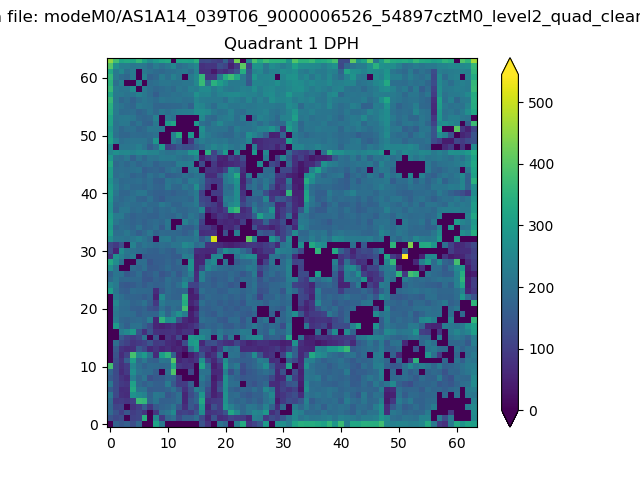 |
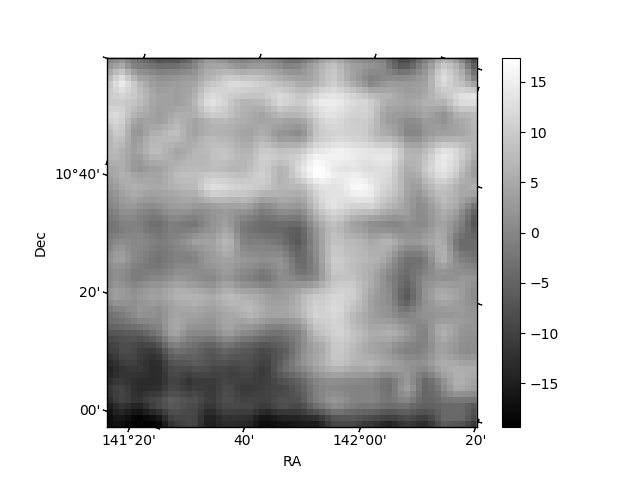
Quadrant B |
|---|---|---|---|
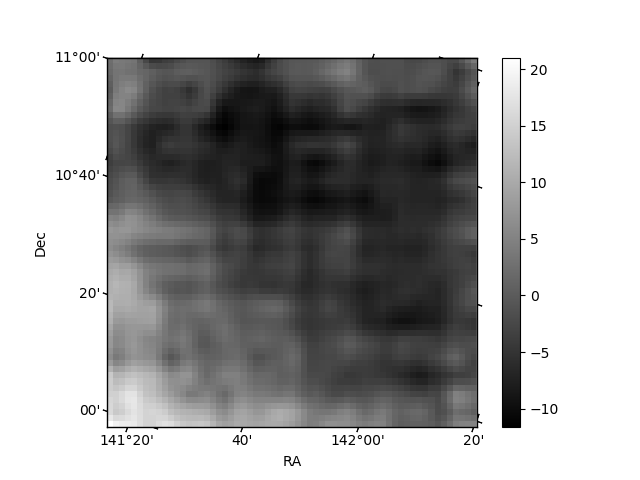
| Quadrant D | 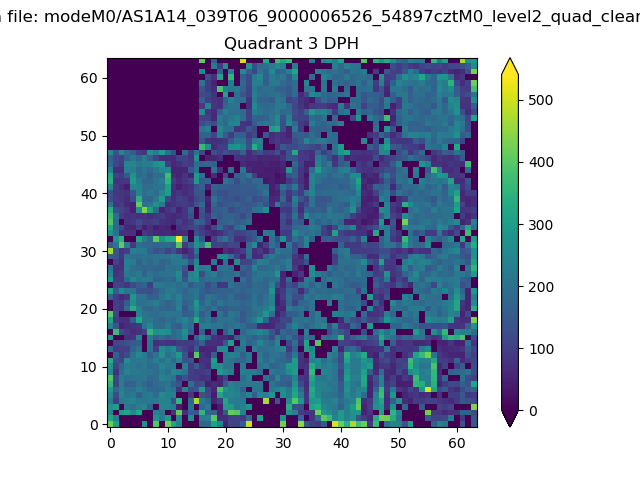 |
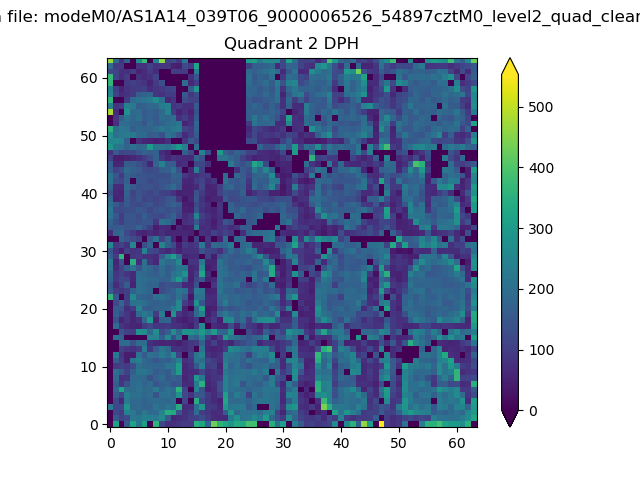 |
Quadrant C |
| Plot type | Count rate plots | Images |
|---|---|---|
| Comparison with Poisson distribution Blue bars denote a histogram of data divided into 1 sec bins. Red curve is a Poisson curve with rate = median count rate of data. |
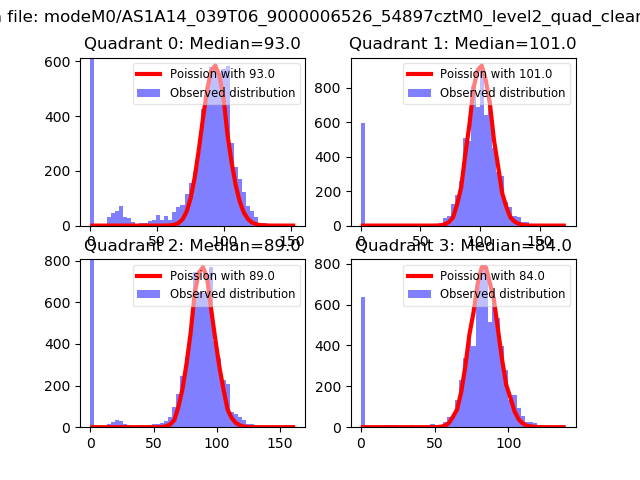 |
 |
| Quadrant-wise count rates Data is divided into 100 sec bins |
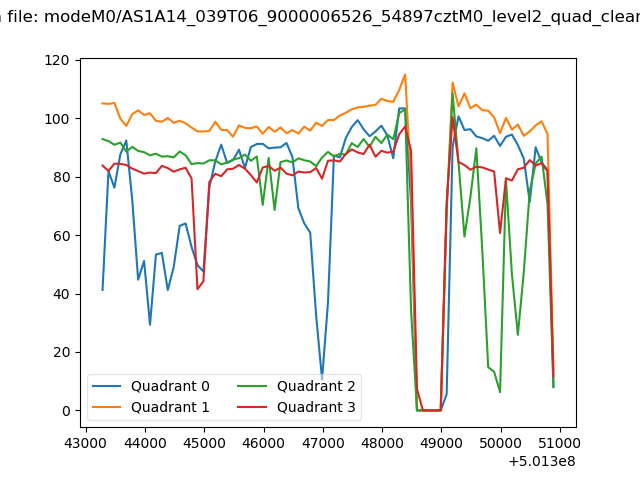 |
|
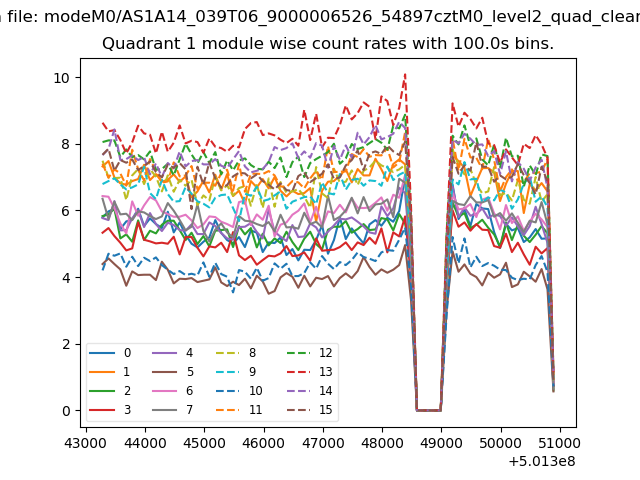
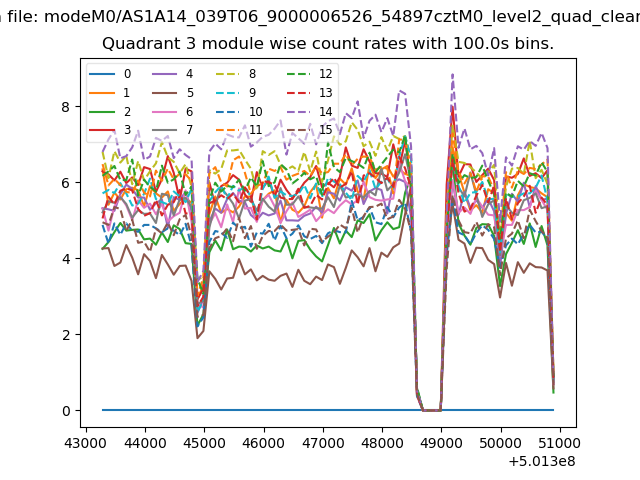
| Module-wise count rates for Quadrant A Data is divided into 100 sec bins |
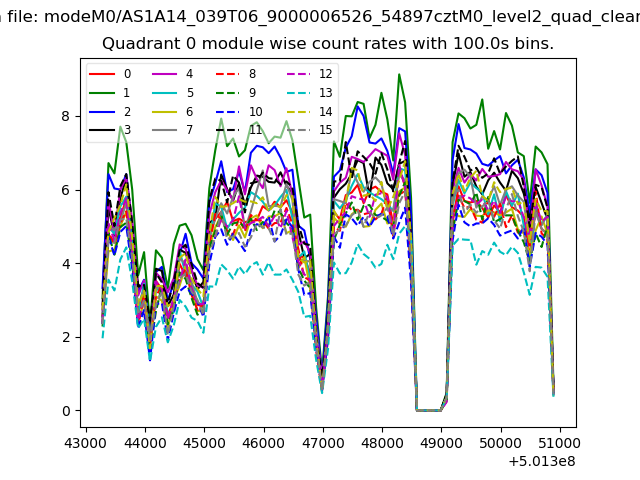 |
 |
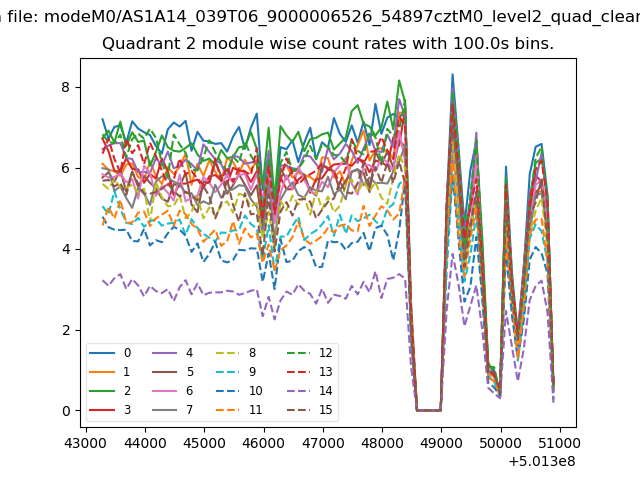
| Module-wise count rates for Quadrant B Data is divided into 100 sec bins |
 |
 |
| Module-wise count rates for Quadrant C Data is divided into 100 sec bins |
 |
 |
| Module-wise count rates for Quadrant D Data is divided into 100 sec bins |
 |
 |
| Parameter | Plot |
|---|---|
| CZT HV Monitor | 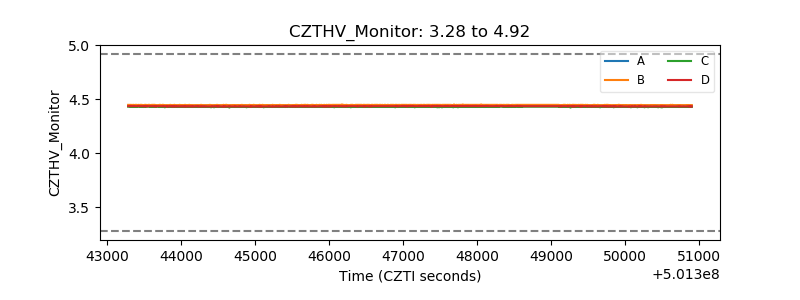 |
| D_VDD | 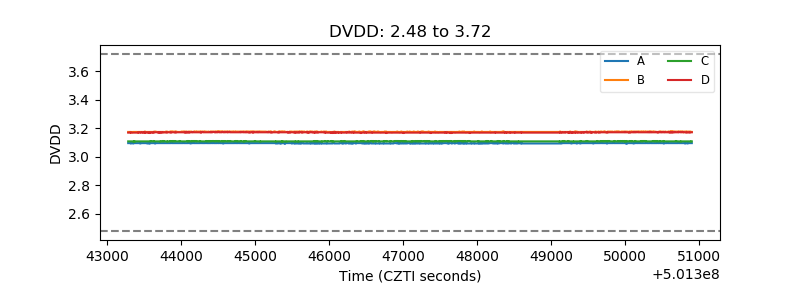 |
| Temperature 1 | 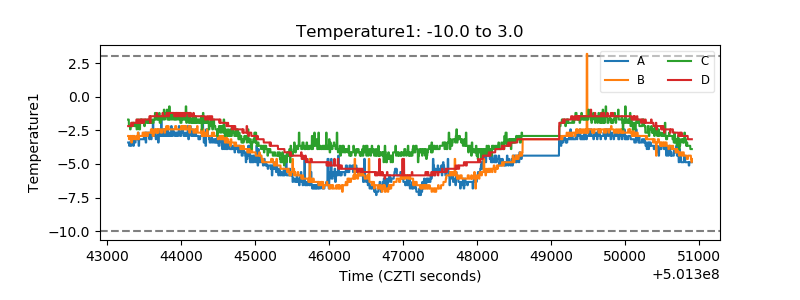 |
| Veto HV Monitor | 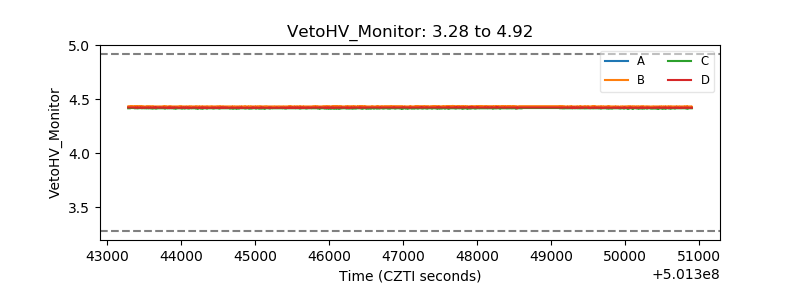 |
| Veto LLD | 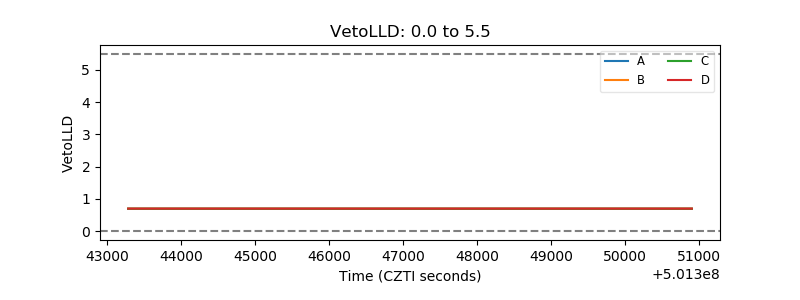 |
| Alpha Counter | 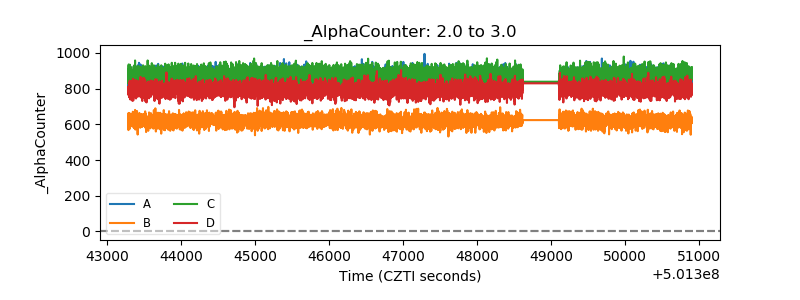 |
| _CPM_Rate | 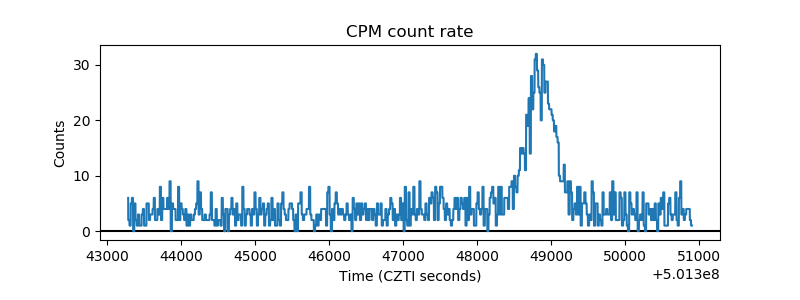 |
| CZT Counter |  |
| +2.5 Volts monitor |  |
| +5 Volts monitor |  |
| _ROLL_ROT | 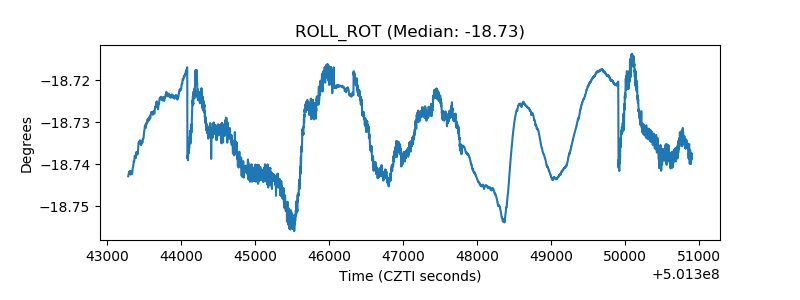 |
| _Roll_DEC | 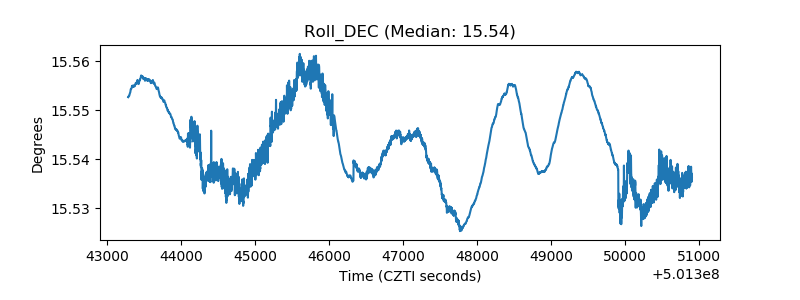 |
| _Roll_RA | 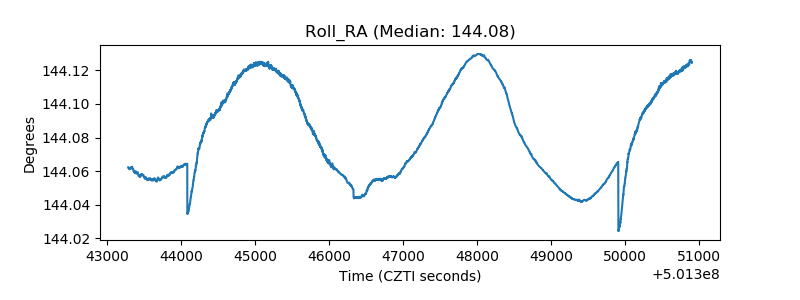 |
| Veto Counter | 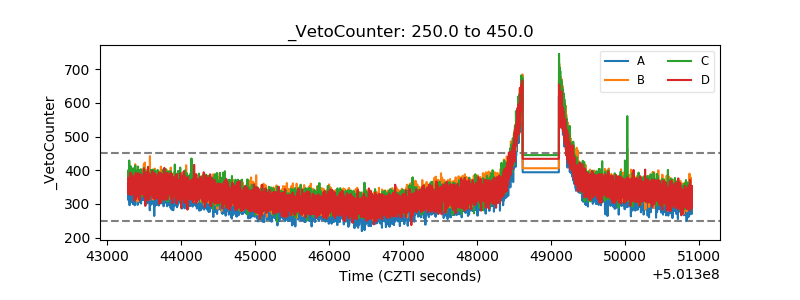 |