| Param | Original file | Final file |
|---|---|---|
| Filename | modeM0/AS1A14_039T06_9000006526_54898cztM0_level2.fits | modeM0/AS1A14_039T06_9000006526_54898cztM0_level2_quad_clean.evt |
| Size (bytes) | 671,376,960 | 109,707,840 |
| Size | 640.3 MB | 104.6 MB |
| Events in quadrant A | 6,859,298 | 729,605 |
| Events in quadrant B | 4,533,089 | 785,970 |
| Events in quadrant C | 6,636,390 | 625,219 |
| Events in quadrant D | 6,213,309 | 633,172 |
| Mode M0 | |||
|---|---|---|---|
| Quadrant | BADHDUFLAG | Total packets | Discarded packets |
| A | 0 | 25999 | 5 |
| B | 0 | 19315 | 20 |
| C | 0 | 25567 | 26 |
| D | 0 | 24016 | 25 |
| Mode SS | |||
|---|---|---|---|
| Quadrant | BADHDUFLAG | Total packets | Discarded packets |
| A | 0 | 158 | 0 |
| B | 0 | 158 | 0 |
| C | 0 | 158 | 0 |
| D | 0 | 158 | 0 |
| Quadrant | Total seconds | Saturated seconds | Saturation percentage |
|---|---|---|---|
| A | 7882 | 382 | 4.846486% |
| B | 7875 | 299 | 3.796825% |
| C | 7878 | 1104 | 14.013709% |
| D | 7870 | 604 | 7.674714% |
Noise dominated data is calculated using 1-second bins in cleaned event files. If a bin has >2000 counts, and if more than 50% of those come from <1% of pixels, then it is considered to be noise-dominated and hence unusable.
| Quadrant | # 1 sec bins | Bins with >0 counts | Bins with >2000 counts | High rate bins dominated by noise | Noise dominated (total time) | Noise dominated (detector-on time) | Marked lightcurve |
|---|---|---|---|---|---|---|---|
| A | 7884 | 7884 | 269 | 269 | 3.41% | 3.41% | 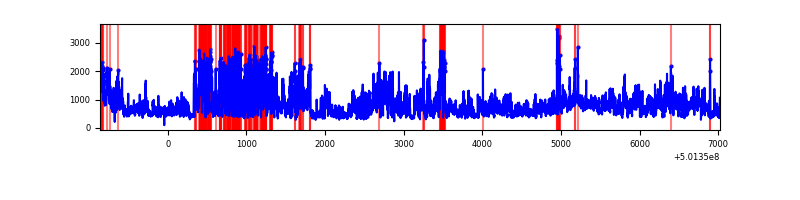 |
| B | 7884 | 7881 | 130 | 130 | 1.65% | 1.65% | 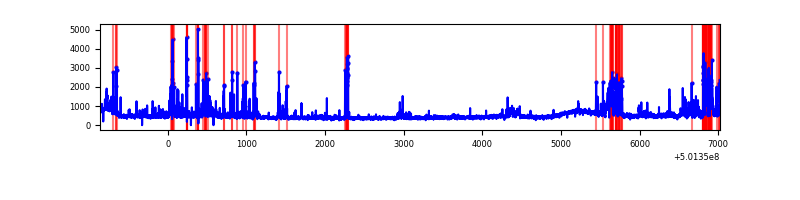 |
| C | 7884 | 7882 | 813 | 813 | 10.31% | 10.31% | 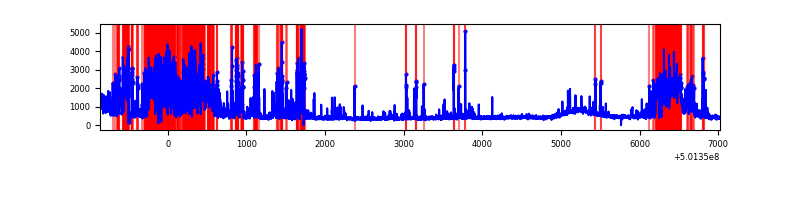 |
| D | 7884 | 7878 | 474 | 474 | 6.01% | 6.02% | 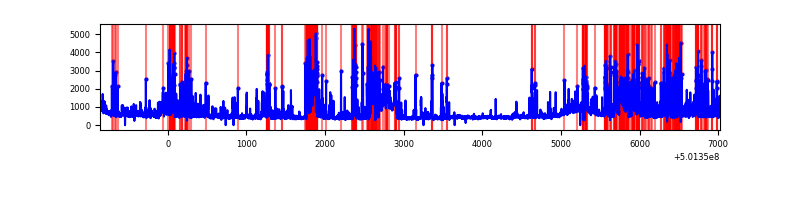 |
Top three noisy pixels from each quadrant. If the there are fewer than three noisy pixels in the level2.evt file, extra rows are filled as -1
| Pixel properties | Quadrant properties | ||||||
|---|---|---|---|---|---|---|---|
| Quadrant | DetID | PixID | Counts | Sigma | Mean | Median | Sigma |
| A | 3 | 14 | 3099868 | 14453.97 | 864 | 840 | 214.4 |
| A | 0 | 8 | 177331 | 823.16 | 864 | 840 | 214.4 |
| A | 12 | 115 | 129470 | 599.93 | 864 | 840 | 214.4 |
| B | 10 | 247 | 489306 | 2657.25 | 853 | 819 | 183.8 |
| B | 5 | 236 | 331941 | 1801.22 | 853 | 819 | 183.8 |
| B | 5 | 185 | 252568 | 1369.45 | 853 | 819 | 183.8 |
| C | 4 | 5 | 2249796 | 10275.51 | 807 | 800 | 218.9 |
| C | 15 | 209 | 697369 | 3182.58 | 807 | 800 | 218.9 |
| C | 14 | 254 | 243815 | 1110.32 | 807 | 800 | 218.9 |
| D | 2 | 249 | 588168 | 2530.55 | 828 | 794 | 232.1 |
| D | 11 | 129 | 471859 | 2029.46 | 828 | 794 | 232.1 |
| D | 15 | 94 | 430267 | 1850.27 | 828 | 794 | 232.1 |
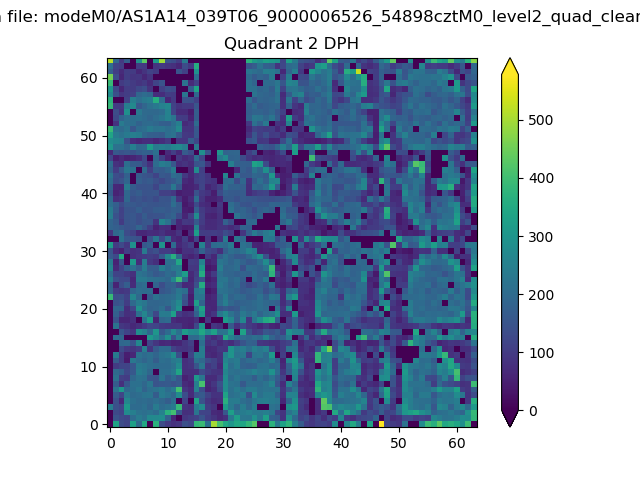
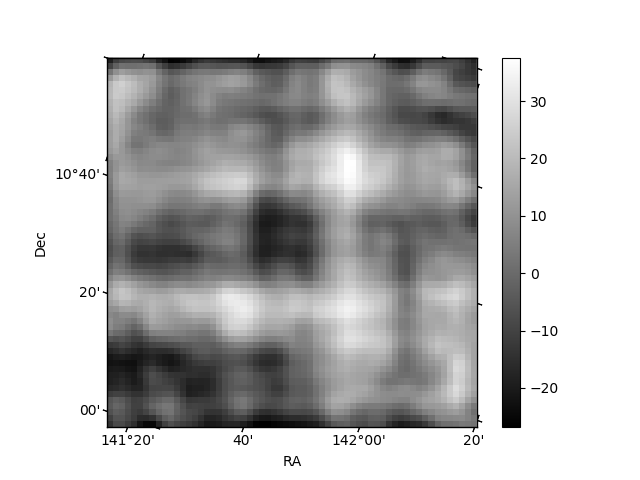
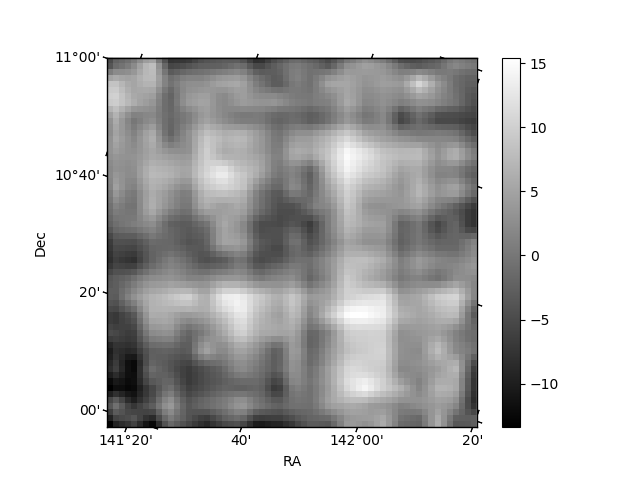
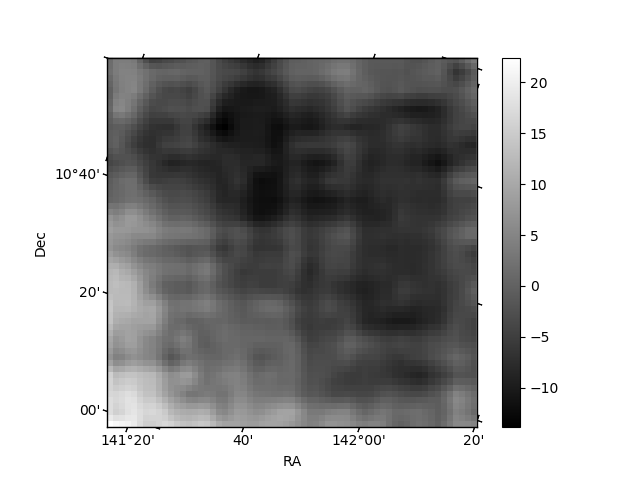
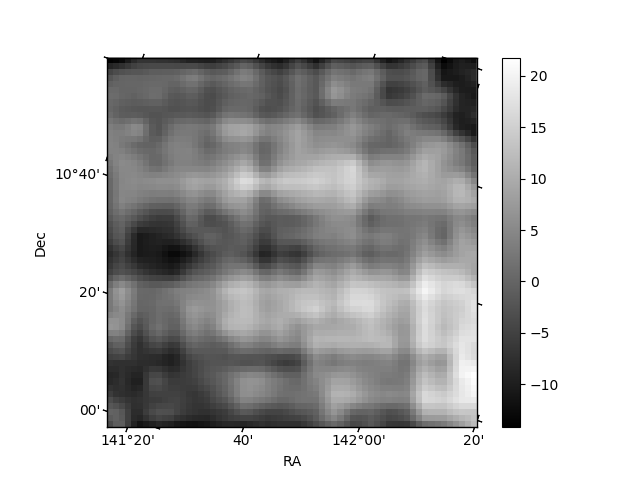
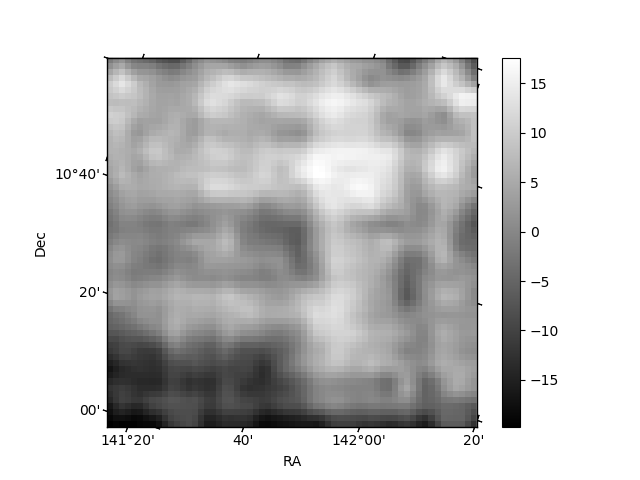
Histogram calculated using DETX and DETY for each event in the final _common_clean file
| Quadrant A | 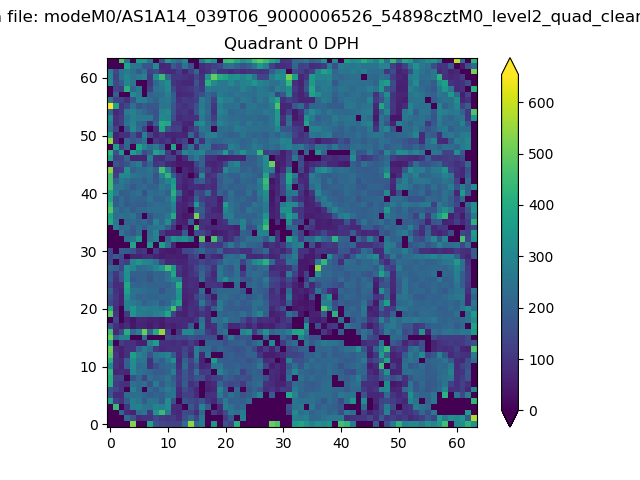 |
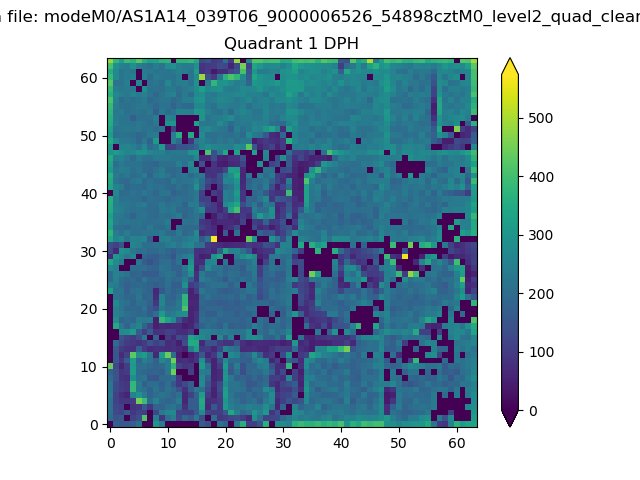 |
Quadrant B |
|---|---|---|---|
| Quadrant D | 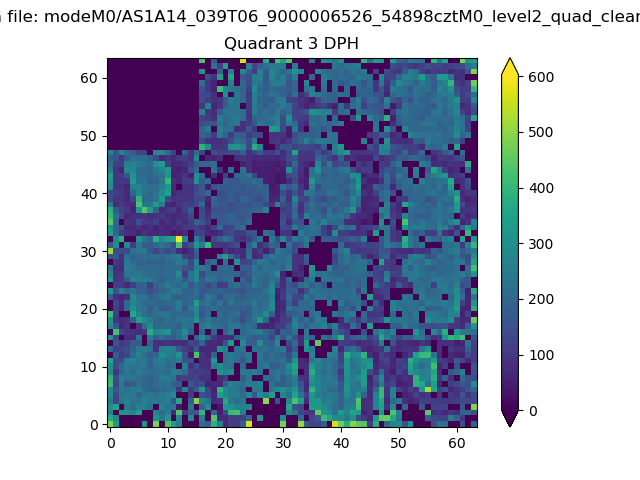 |
 |
Quadrant C |
| Plot type | Count rate plots | Images |
|---|---|---|
| Comparison with Poisson distribution Blue bars denote a histogram of data divided into 1 sec bins. Red curve is a Poisson curve with rate = median count rate of data. |
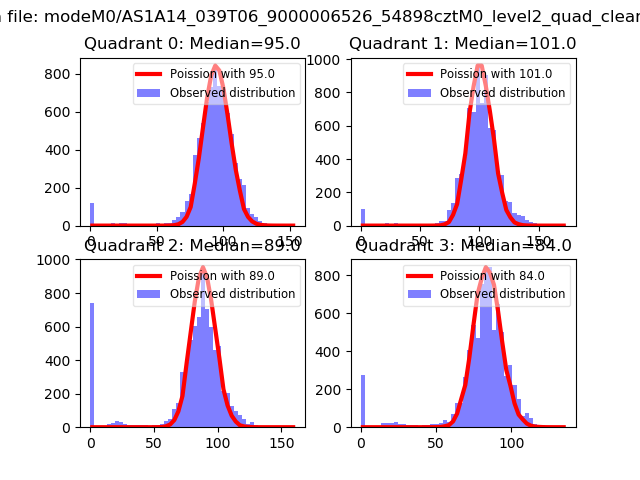 |
 |
| Quadrant-wise count rates Data is divided into 100 sec bins |
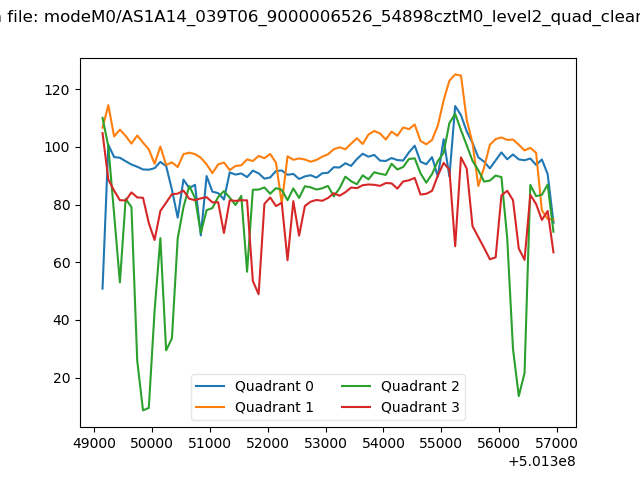 |
|
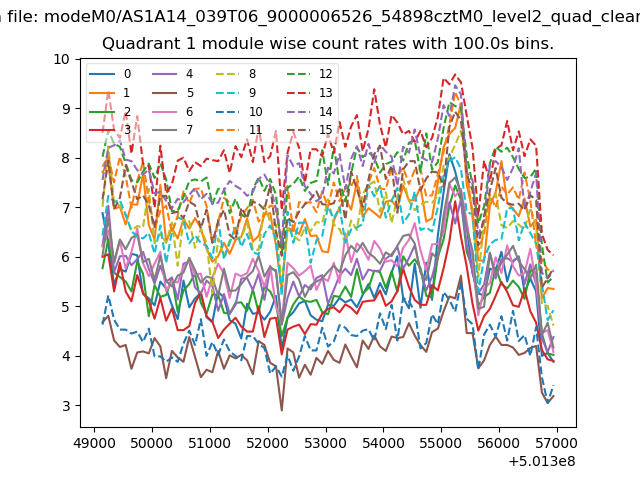
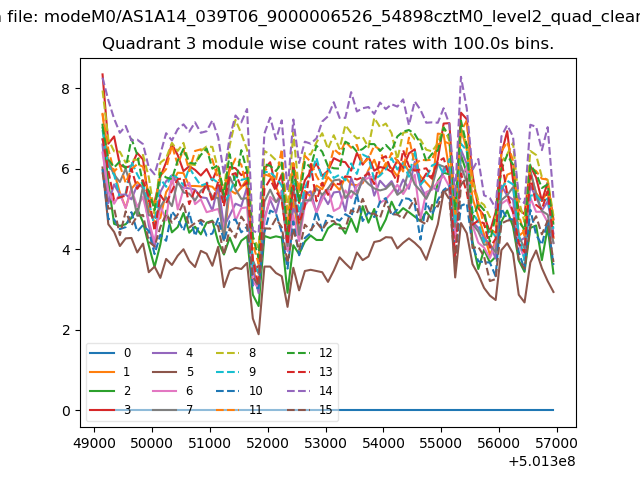
| Module-wise count rates for Quadrant A Data is divided into 100 sec bins |
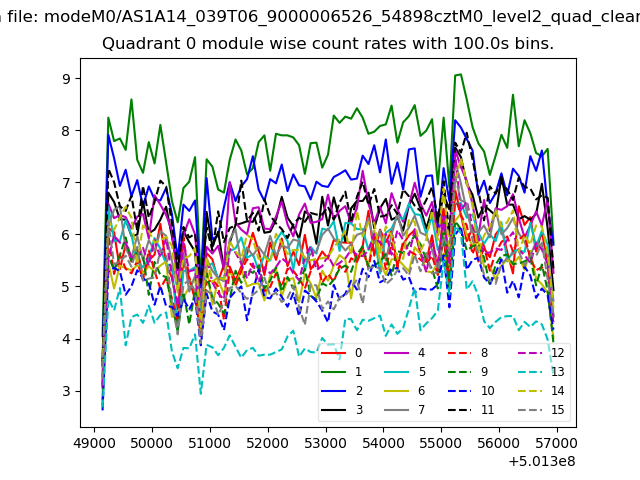 |
 |
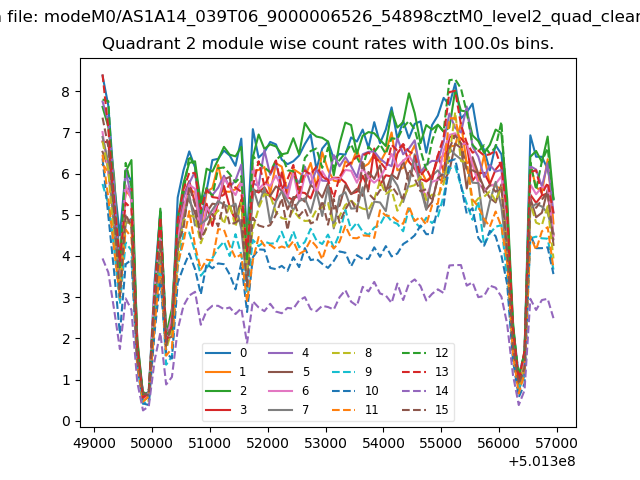
| Module-wise count rates for Quadrant B Data is divided into 100 sec bins |
 |
 |
| Module-wise count rates for Quadrant C Data is divided into 100 sec bins |
 |
 |
| Module-wise count rates for Quadrant D Data is divided into 100 sec bins |
 |
 |
| Parameter | Plot |
|---|---|
| CZT HV Monitor | 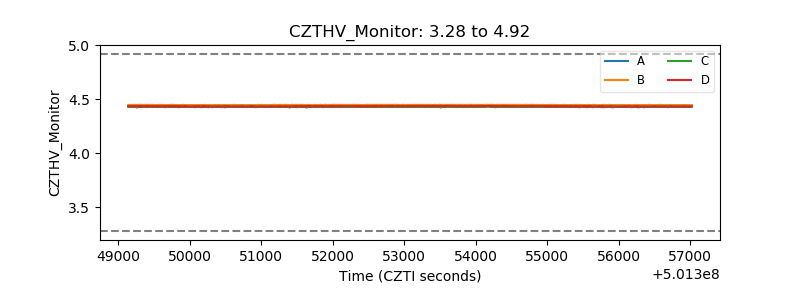 |
| D_VDD | 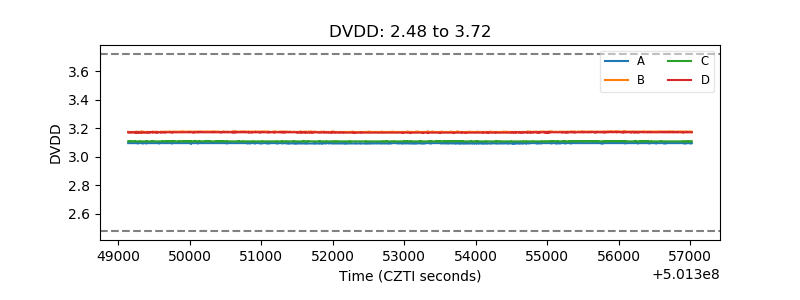 |
| Temperature 1 | 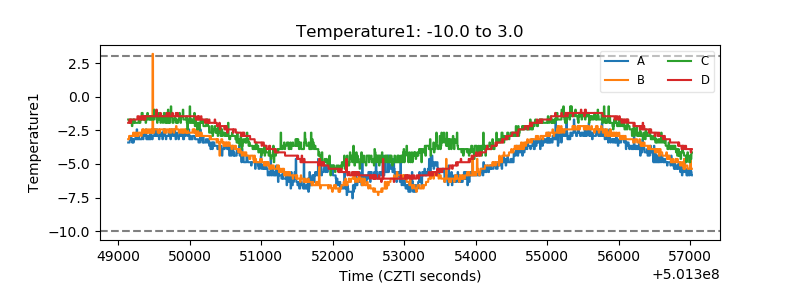 |
| Veto HV Monitor | 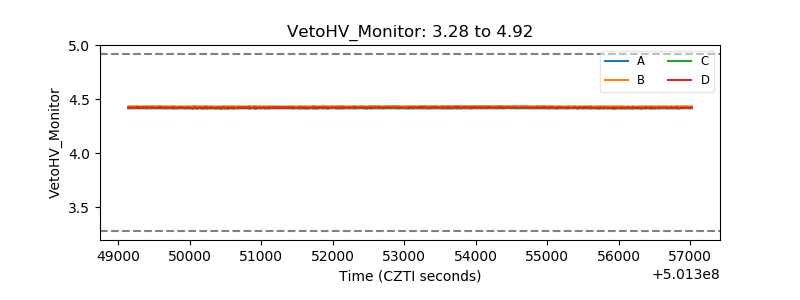 |
| Veto LLD | 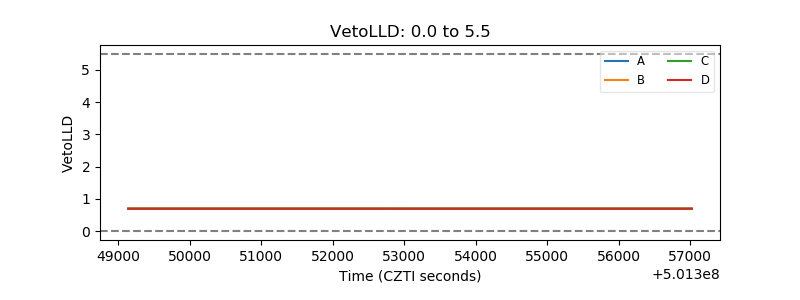 |
| Alpha Counter | 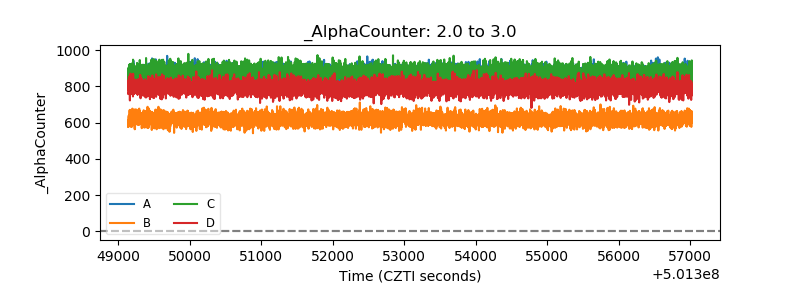 |
| _CPM_Rate | 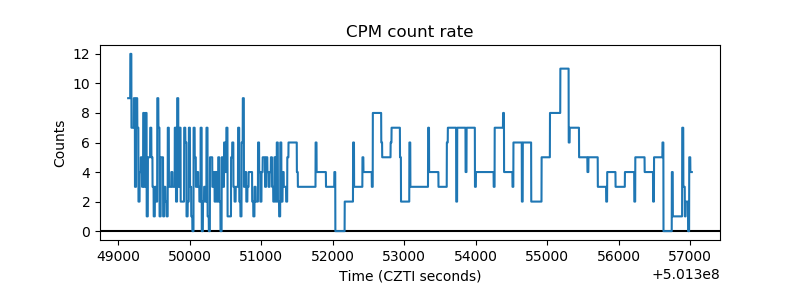 |
| CZT Counter | 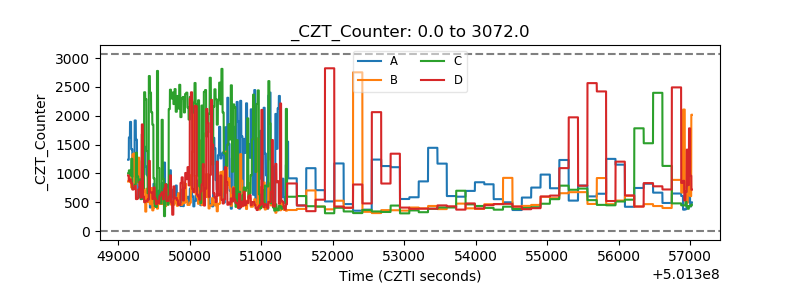 |
| +2.5 Volts monitor |  |
| +5 Volts monitor | 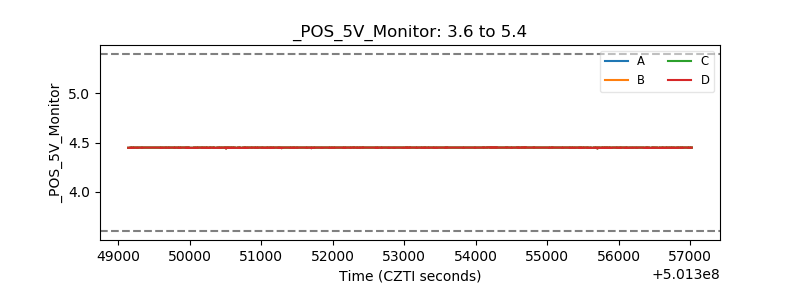 |
| _ROLL_ROT | 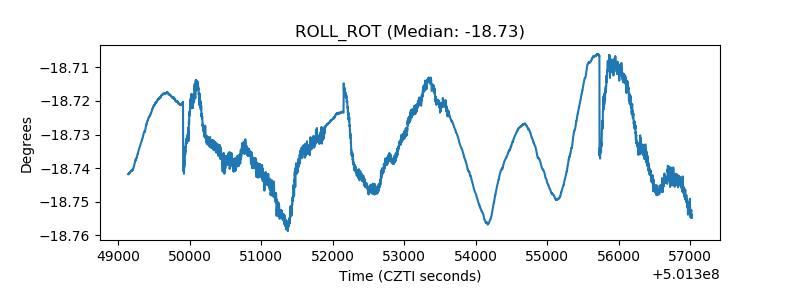 |
| _Roll_DEC | 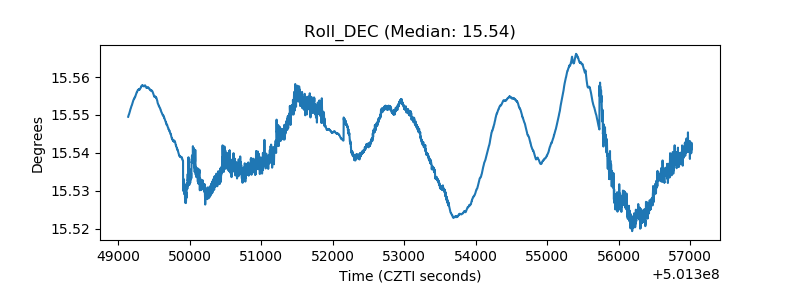 |
| _Roll_RA | 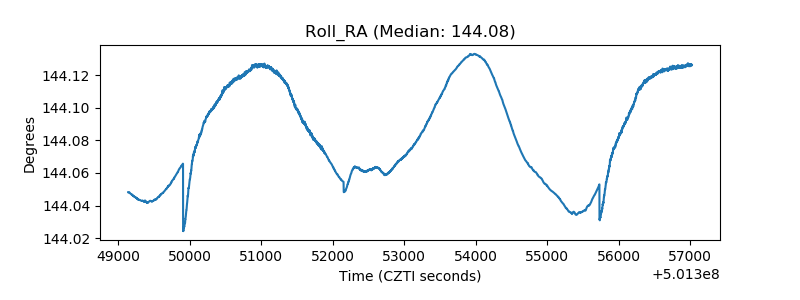 |
| Veto Counter | 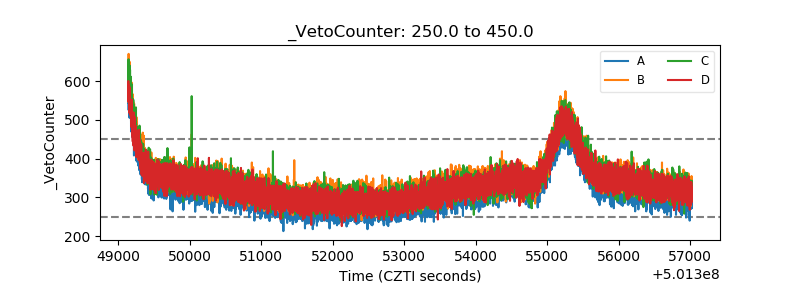 |