| Param | Original file | Final file |
|---|---|---|
| Filename | modeM0/AS1A14_039T06_9000006526_54899cztM0_level2.fits | modeM0/AS1A14_039T06_9000006526_54899cztM0_level2_quad_clean.evt |
| Size (bytes) | 695,427,840 | 113,267,520 |
| Size | 663.2 MB | 108.0 MB |
| Events in quadrant A | 5,383,324 | 770,604 |
| Events in quadrant B | 4,595,453 | 826,001 |
| Events in quadrant C | 6,458,324 | 685,383 |
| Events in quadrant D | 8,669,579 | 577,411 |
| Mode M0 | |||
|---|---|---|---|
| Quadrant | BADHDUFLAG | Total packets | Discarded packets |
| A | 0 | 21665 | 30 |
| B | 0 | 19688 | 28 |
| C | 0 | 25071 | 36 |
| D | 0 | 31616 | 42 |
| Mode SS | |||
|---|---|---|---|
| Quadrant | BADHDUFLAG | Total packets | Discarded packets |
| A | 0 | 164 | 0 |
| B | 0 | 164 | 0 |
| C | 0 | 164 | 0 |
| D | 0 | 164 | 0 |
| Quadrant | Total seconds | Saturated seconds | Saturation percentage |
|---|---|---|---|
| A | 8201 | 190 | 2.316791% |
| B | 8204 | 221 | 2.693808% |
| C | 8198 | 822 | 10.026836% |
| D | 8207 | 1676 | 20.421591% |
Noise dominated data is calculated using 1-second bins in cleaned event files. If a bin has >2000 counts, and if more than 50% of those come from <1% of pixels, then it is considered to be noise-dominated and hence unusable.
| Quadrant | # 1 sec bins | Bins with >0 counts | Bins with >2000 counts | High rate bins dominated by noise | Noise dominated (total time) | Noise dominated (detector-on time) | Marked lightcurve |
|---|---|---|---|---|---|---|---|
| A | 8216 | 8212 | 69 | 69 | 0.84% | 0.84% | 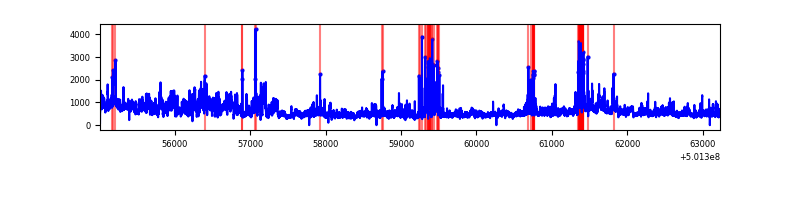 |
| B | 8216 | 8211 | 98 | 98 | 1.19% | 1.19% | 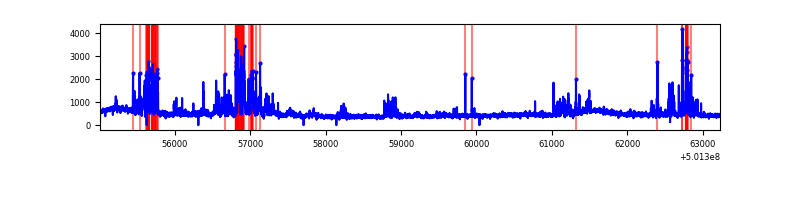 |
| C | 8217 | 8208 | 493 | 493 | 6.00% | 6.01% | 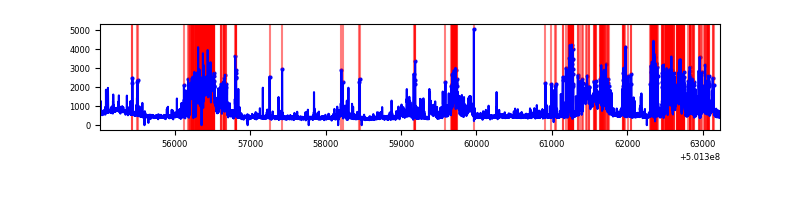 |
| D | 8216 | 8215 | 1333 | 1333 | 16.22% | 16.23% |  |
Top three noisy pixels from each quadrant. If the there are fewer than three noisy pixels in the level2.evt file, extra rows are filled as -1
| Pixel properties | Quadrant properties | ||||||
|---|---|---|---|---|---|---|---|
| Quadrant | DetID | PixID | Counts | Sigma | Mean | Median | Sigma |
| A | 3 | 14 | 1334273 | 5917.77 | 908 | 883 | 225.3 |
| A | 0 | 8 | 369946 | 1637.95 | 908 | 883 | 225.3 |
| A | 7 | 14 | 75084 | 329.31 | 908 | 883 | 225.3 |
| B | 10 | 247 | 384715 | 1985.32 | 897 | 863 | 193.3 |
| B | 5 | 236 | 321601 | 1658.89 | 897 | 863 | 193.3 |
| B | 10 | 245 | 145388 | 747.5 | 897 | 863 | 193.3 |
| C | 4 | 5 | 1139685 | 4790.92 | 866 | 855 | 237.7 |
| C | 15 | 209 | 1066760 | 4484.13 | 866 | 855 | 237.7 |
| C | 6 | 223 | 329812 | 1383.88 | 866 | 855 | 237.7 |
| D | 11 | 129 | 1877773 | 8131.2 | 818 | 784 | 230.8 |
| D | 2 | 249 | 1684709 | 7294.84 | 818 | 784 | 230.8 |
| D | 15 | 94 | 472779 | 2044.7 | 818 | 784 | 230.8 |
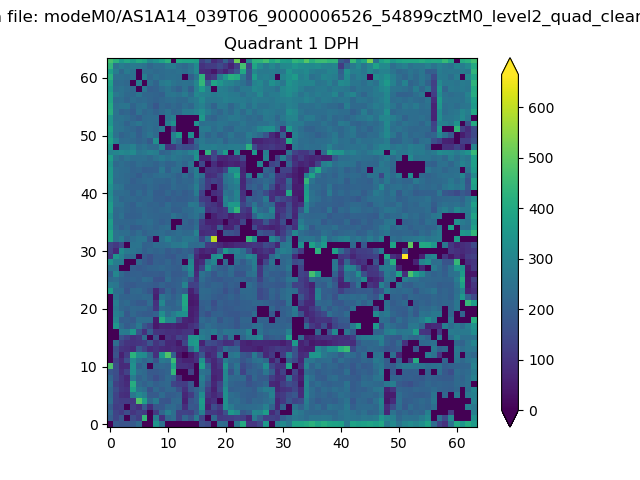
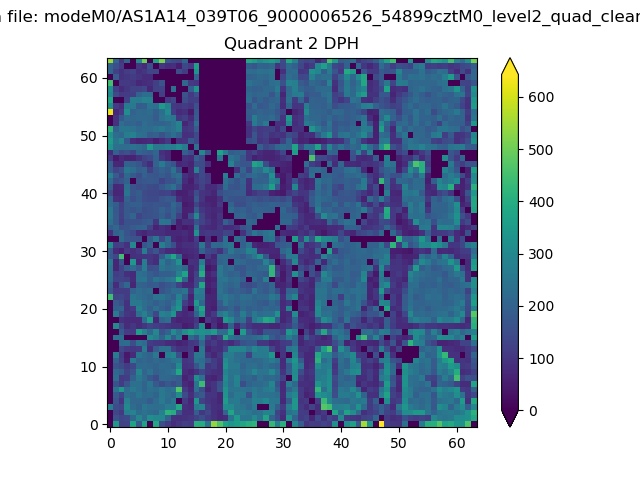
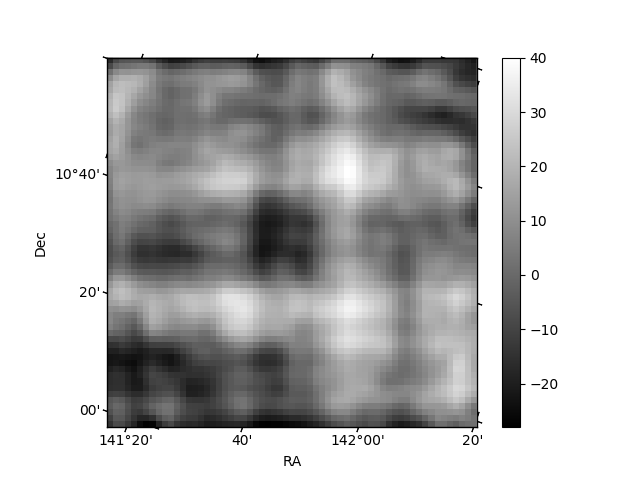
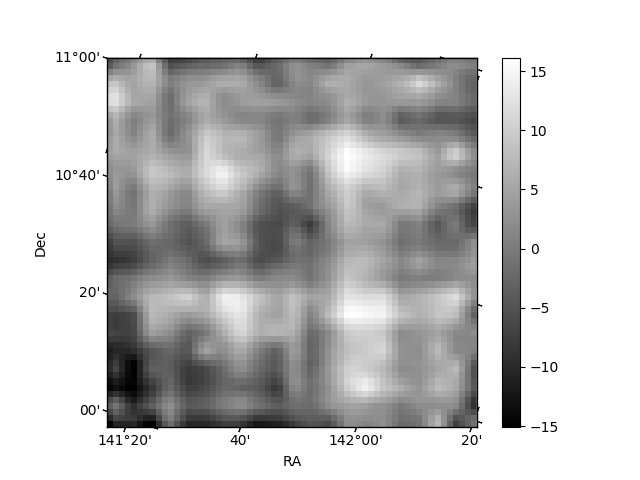
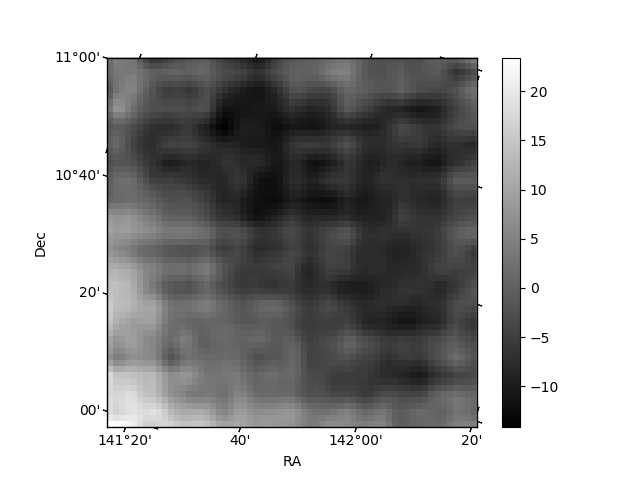
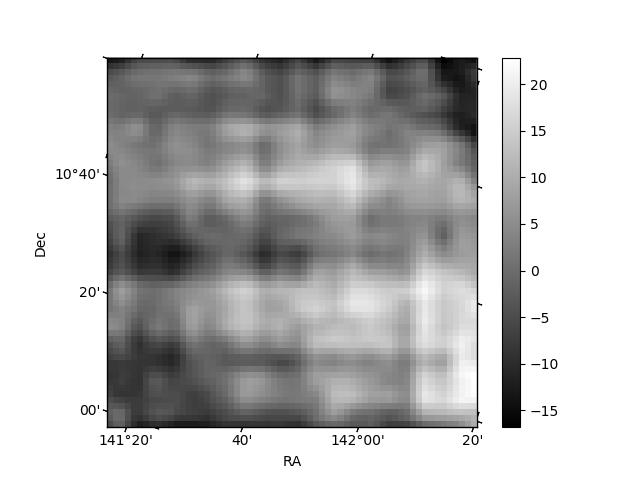
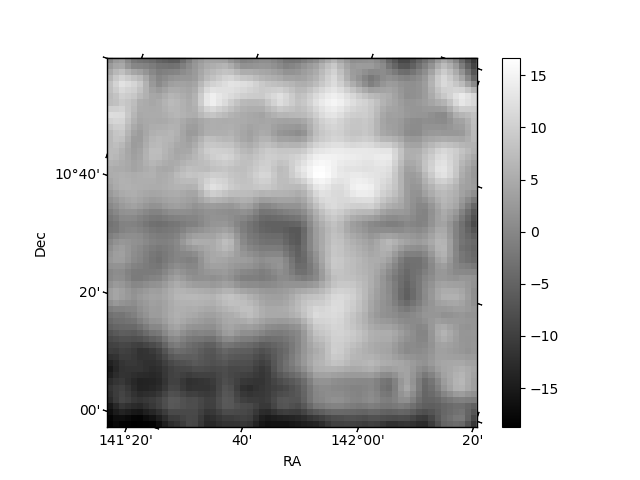
Histogram calculated using DETX and DETY for each event in the final _common_clean file
| Quadrant A | 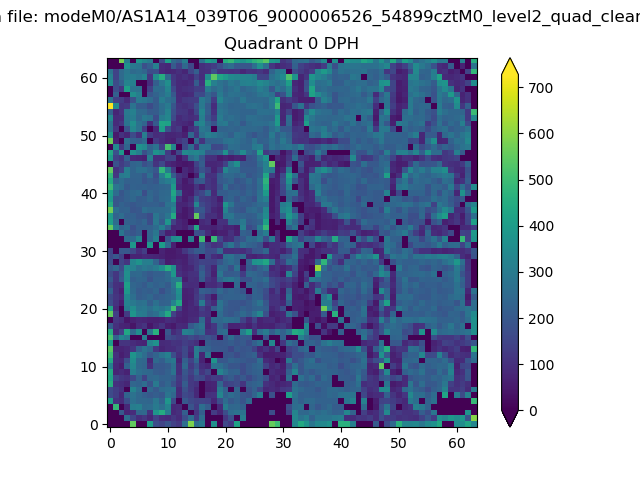 |
 |
Quadrant B |
|---|---|---|---|
| Quadrant D | 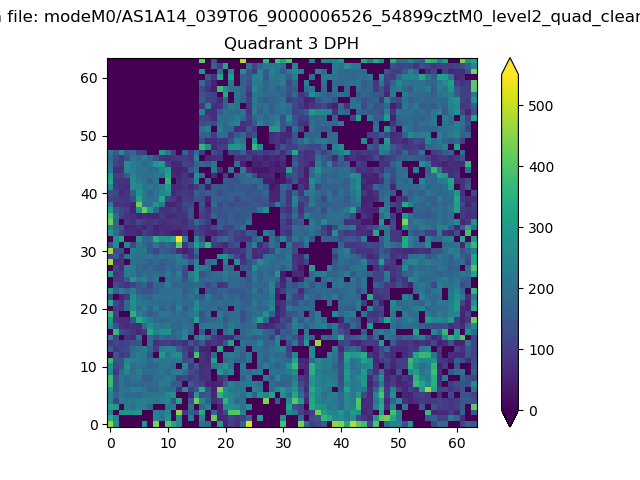 |
 |
Quadrant C |
| Plot type | Count rate plots | Images |
|---|---|---|
| Comparison with Poisson distribution Blue bars denote a histogram of data divided into 1 sec bins. Red curve is a Poisson curve with rate = median count rate of data. |
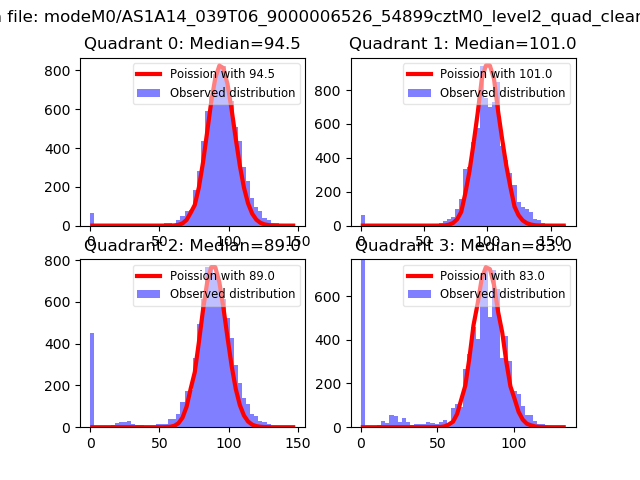 |
 |
| Quadrant-wise count rates Data is divided into 100 sec bins |
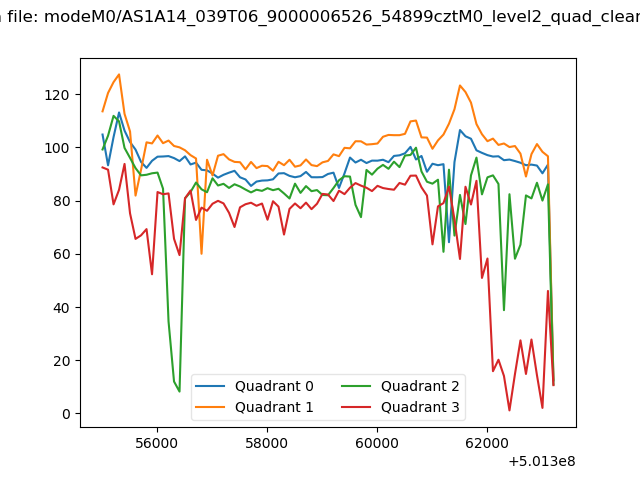 |
|
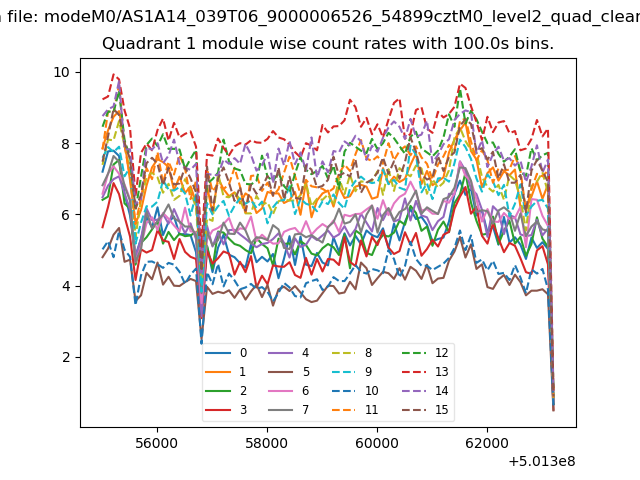
| Module-wise count rates for Quadrant A Data is divided into 100 sec bins |
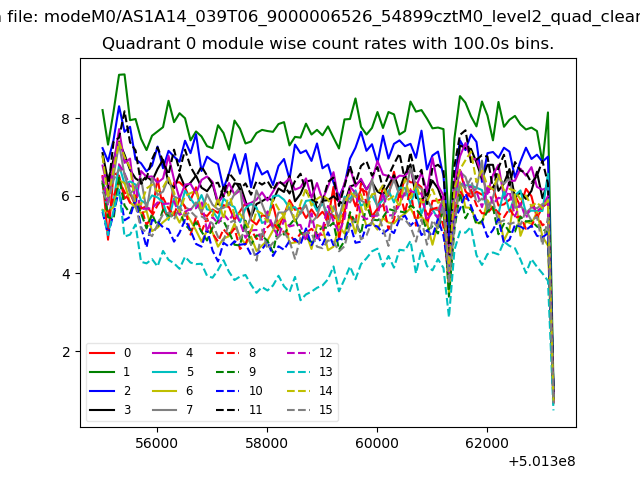 |
 |
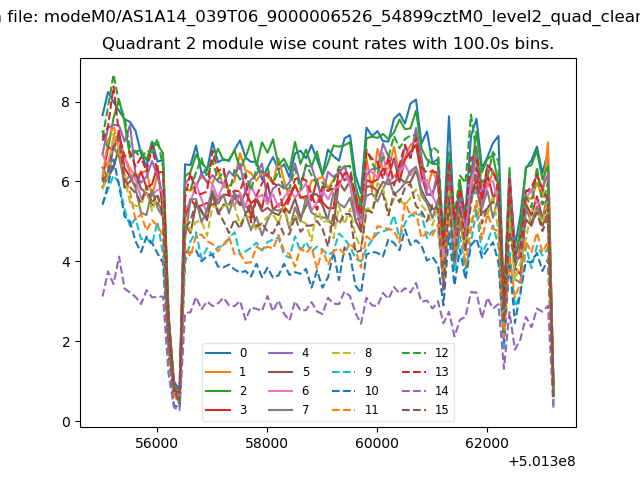
| Module-wise count rates for Quadrant B Data is divided into 100 sec bins |
 |
 |
| Module-wise count rates for Quadrant C Data is divided into 100 sec bins |
 |
 |
| Module-wise count rates for Quadrant D Data is divided into 100 sec bins |
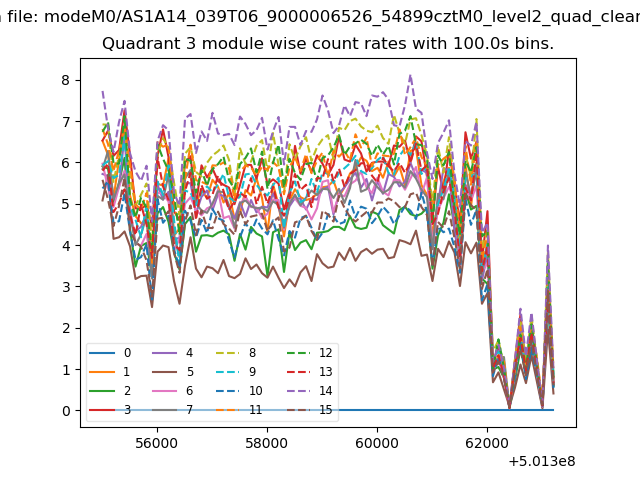 |
 |
| Parameter | Plot |
|---|---|
| CZT HV Monitor | 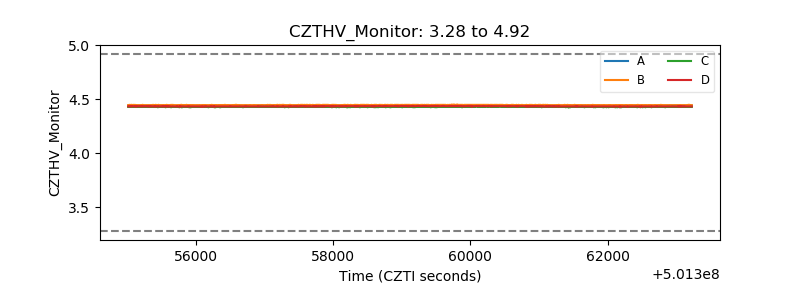 |
| D_VDD | 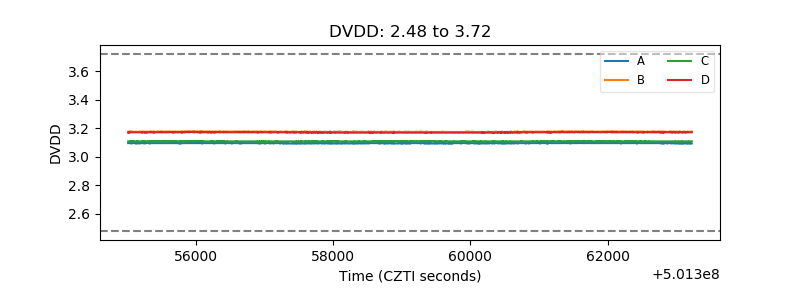 |
| Temperature 1 | 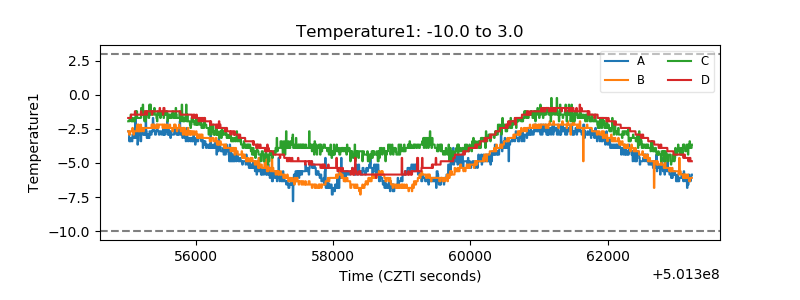 |
| Veto HV Monitor | 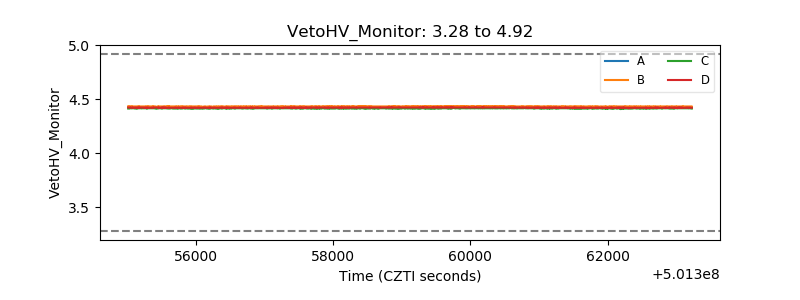 |
| Veto LLD | 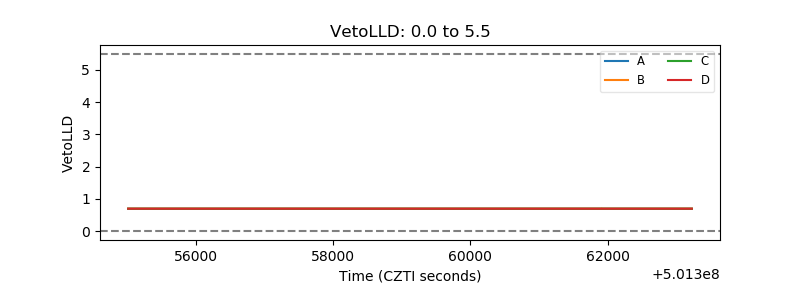 |
| Alpha Counter | 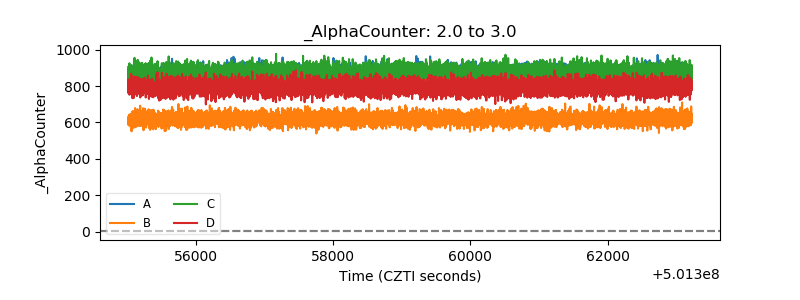 |
| _CPM_Rate | 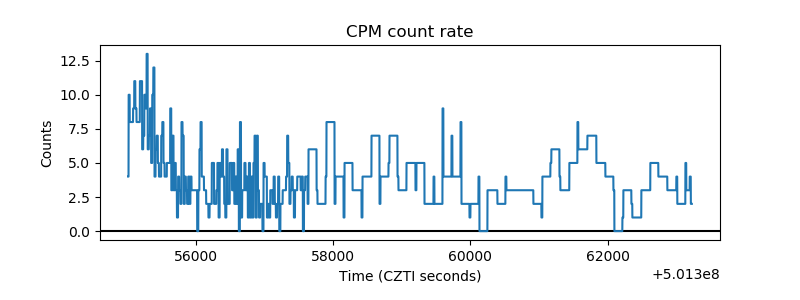 |
| CZT Counter | 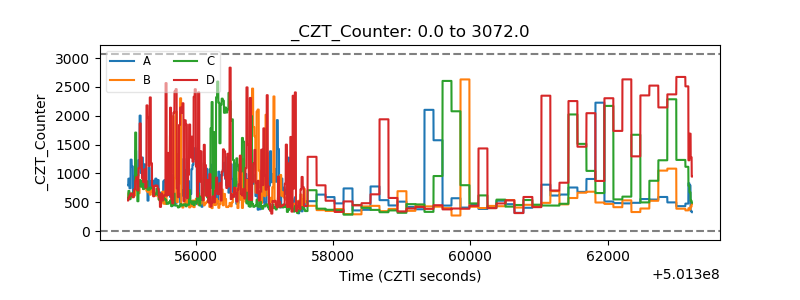 |
| +2.5 Volts monitor |  |
| +5 Volts monitor |  |
| _ROLL_ROT |  |
| _Roll_DEC | 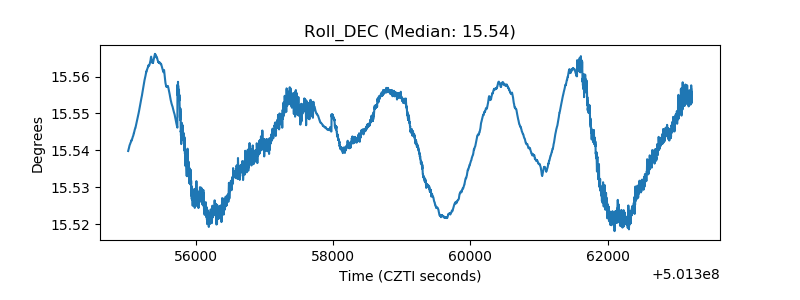 |
| _Roll_RA | 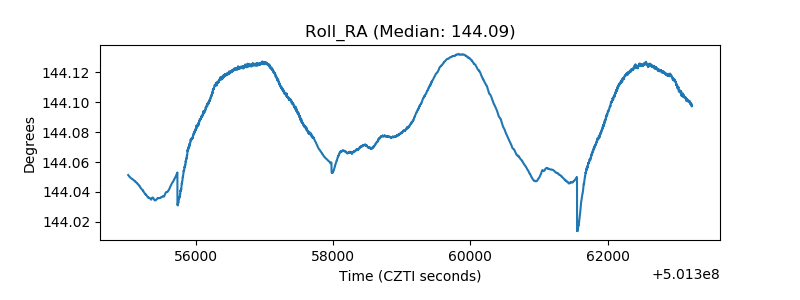 |
| Veto Counter | 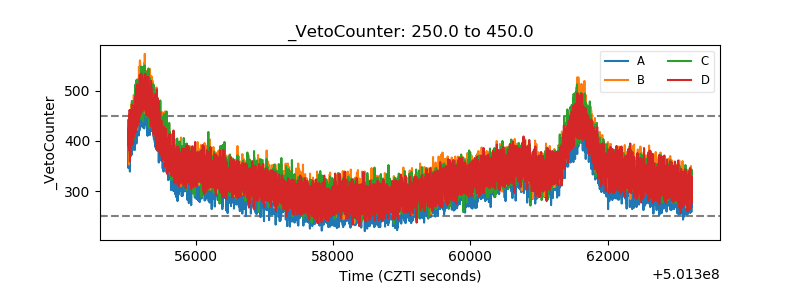 |