| Param | Original file | Final file |
|---|---|---|
| Filename | modeM0/AS1A14_039T06_9000006526_54903cztM0_level2.fits | modeM0/AS1A14_039T06_9000006526_54903cztM0_level2_quad_clean.evt |
| Size (bytes) | 1,435,636,800 | 243,178,560 |
| Size | 1.3 GB | 231.9 MB |
| Events in quadrant A | 11,171,936 | 1,645,441 |
| Events in quadrant B | 8,715,283 | 1,773,135 |
| Events in quadrant C | 15,726,254 | 1,414,110 |
| Events in quadrant D | 16,140,660 | 1,291,801 |
| Mode M9 | |||
|---|---|---|---|
| Quadrant | BADHDUFLAG | Total packets | Discarded packets |
| A | 0 | 4 | 0 |
| B | 0 | 4 | 0 |
| C | 0 | 4 | 0 |
| D | 0 | 4 | 0 |
| Mode M0 | |||
|---|---|---|---|
| Quadrant | BADHDUFLAG | Total packets | Discarded packets |
| A | 0 | 46163 | 104 |
| B | 0 | 39761 | 65 |
| C | 0 | 59766 | 158 |
| D | 0 | 61090 | 183 |
| Mode SS | |||
|---|---|---|---|
| Quadrant | BADHDUFLAG | Total packets | Discarded packets |
| A | 0 | 361 | 0 |
| B | 0 | 361 | 0 |
| C | 0 | 362 | 0 |
| D | 0 | 361 | 1 |
| Quadrant | Total seconds | Saturated seconds | Saturation percentage |
|---|---|---|---|
| A | 17958 | 483 | 2.689609% |
| B | 17962 | 345 | 1.920722% |
| C | 17958 | 2308 | 12.852211% |
| D | 17962 | 2292 | 12.760272% |
Noise dominated data is calculated using 1-second bins in cleaned event files. If a bin has >2000 counts, and if more than 50% of those come from <1% of pixels, then it is considered to be noise-dominated and hence unusable.
| Quadrant | # 1 sec bins | Bins with >0 counts | Bins with >2000 counts | High rate bins dominated by noise | Noise dominated (total time) | Noise dominated (detector-on time) | Marked lightcurve |
|---|---|---|---|---|---|---|---|
| A | 18393 | 17991 | 246 | 246 | 1.34% | 1.37% |  |
| B | 18393 | 17991 | 144 | 144 | 0.78% | 0.80% | 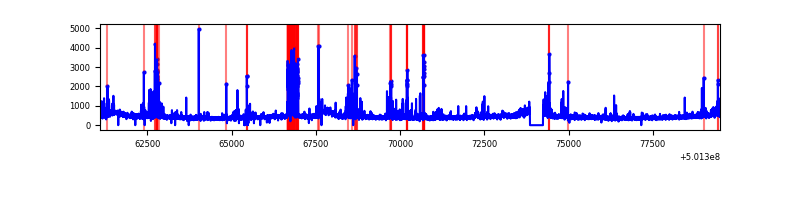 |
| C | 18394 | 17992 | 1685 | 1685 | 9.16% | 9.37% | 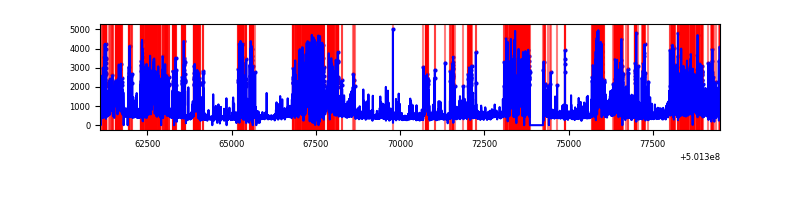 |
| D | 18394 | 17994 | 1867 | 1867 | 10.15% | 10.38% | 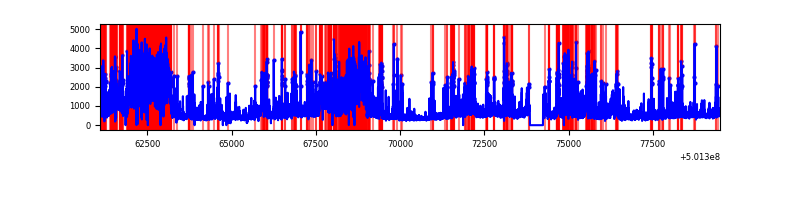 |
Top three noisy pixels from each quadrant. If the there are fewer than three noisy pixels in the level2.evt file, extra rows are filled as -1
| Pixel properties | Quadrant properties | ||||||
|---|---|---|---|---|---|---|---|
| Quadrant | DetID | PixID | Counts | Sigma | Mean | Median | Sigma |
| A | 3 | 14 | 2216549 | 4702.84 | 1901 | 1852 | 470.9 |
| A | 0 | 8 | 912499 | 1933.73 | 1901 | 1852 | 470.9 |
| A | 13 | 248 | 293668 | 619.66 | 1901 | 1852 | 470.9 |
| B | 5 | 185 | 642759 | 1595.28 | 1882 | 1815 | 401.8 |
| B | 5 | 236 | 182832 | 450.54 | 1882 | 1815 | 401.8 |
| B | 10 | 245 | 124825 | 306.17 | 1882 | 1815 | 401.8 |
| C | 4 | 5 | 6029287 | 12548.44 | 1755 | 1741 | 480.3 |
| C | 1 | 16 | 511693 | 1061.64 | 1755 | 1741 | 480.3 |
| C | 6 | 223 | 485818 | 1007.77 | 1755 | 1741 | 480.3 |
| D | 11 | 129 | 3461003 | 6963.57 | 1759 | 1682 | 496.8 |
| D | 2 | 249 | 1450763 | 2916.98 | 1759 | 1682 | 496.8 |
| D | 6 | 42 | 1195297 | 2402.73 | 1759 | 1682 | 496.8 |
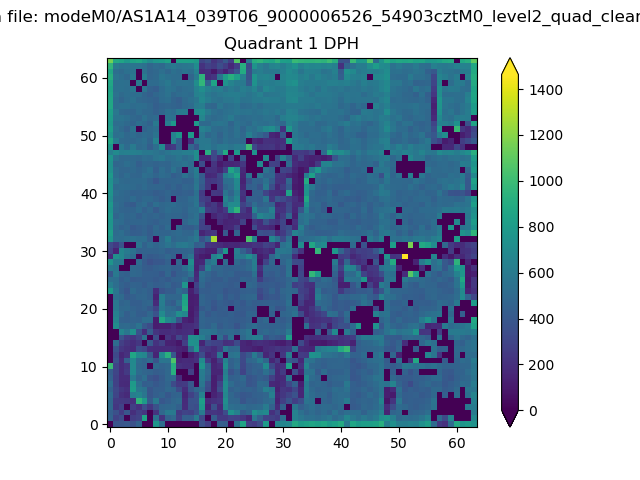
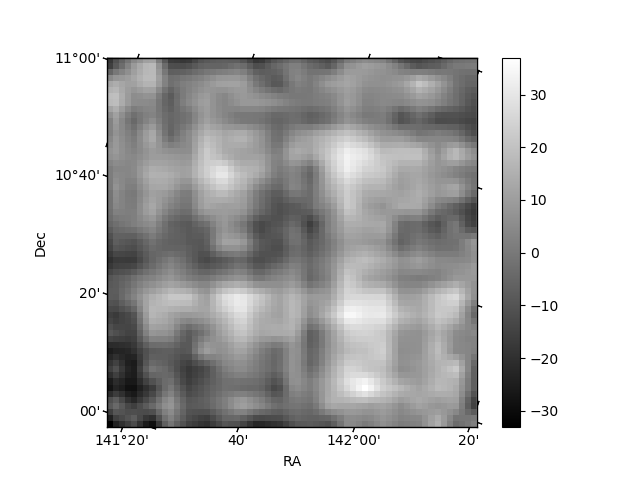
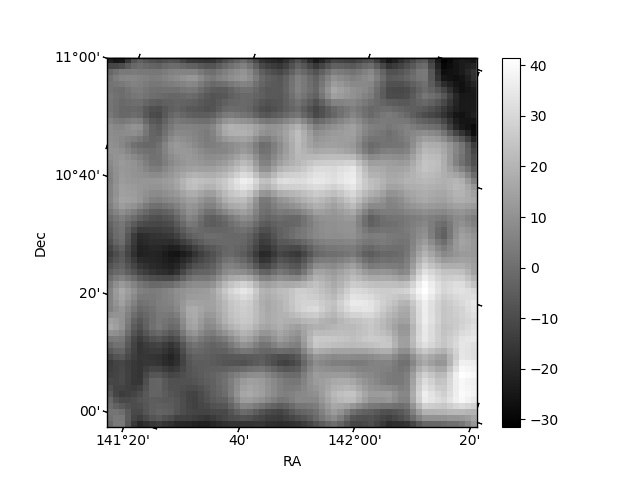
Histogram calculated using DETX and DETY for each event in the final _common_clean file
| Quadrant A |  |
 |
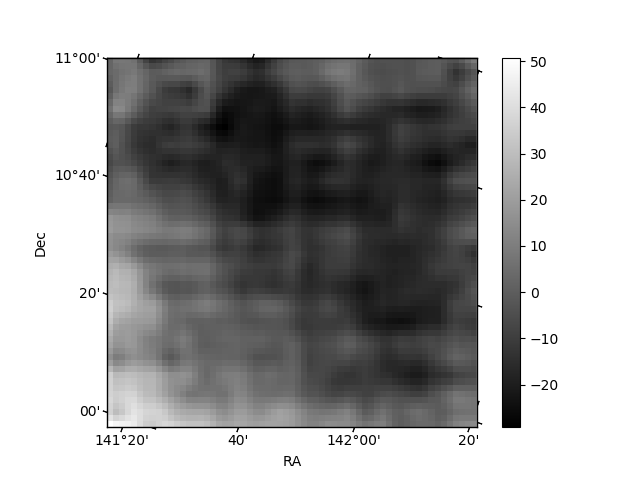
Quadrant B |
|---|---|---|---|
| Quadrant D | 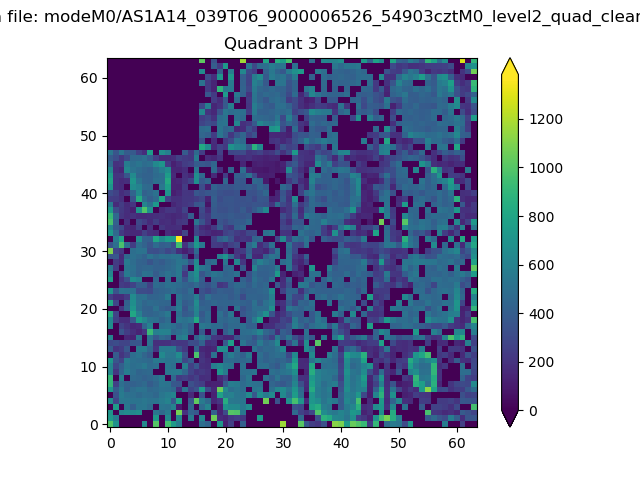 |
 |
Quadrant C |
| Plot type | Count rate plots | Images |
|---|---|---|
| Comparison with Poisson distribution Blue bars denote a histogram of data divided into 1 sec bins. Red curve is a Poisson curve with rate = median count rate of data. |
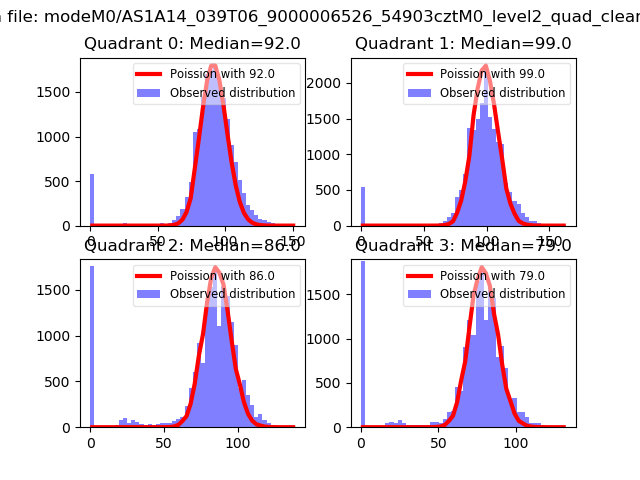 |
 |
| Quadrant-wise count rates Data is divided into 100 sec bins |
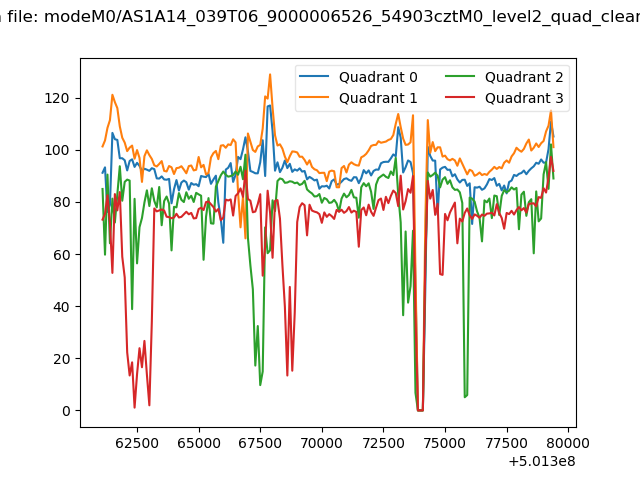 |
|
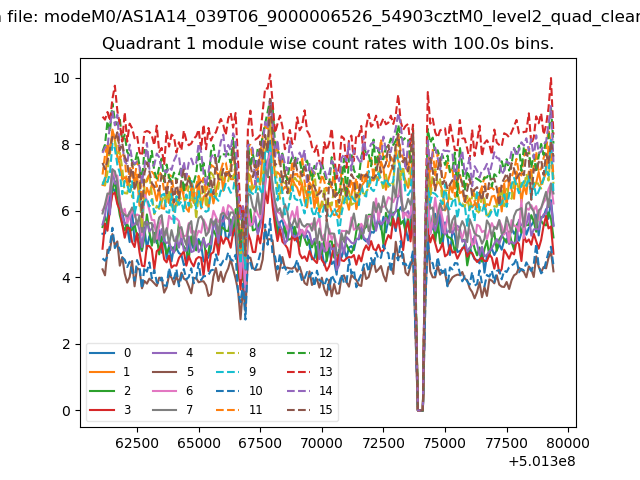
| Module-wise count rates for Quadrant A Data is divided into 100 sec bins |
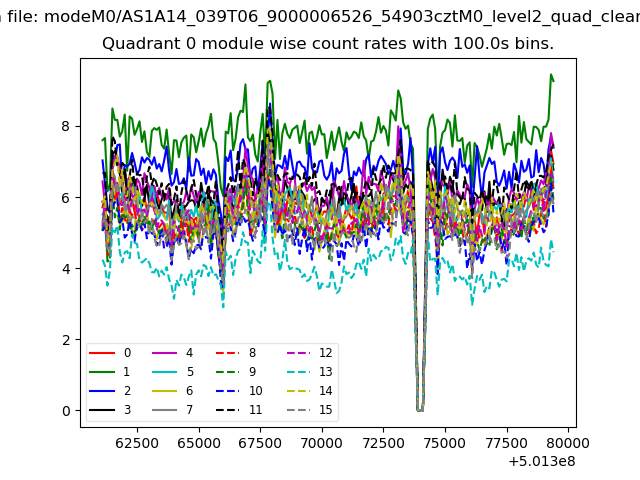 |
 |
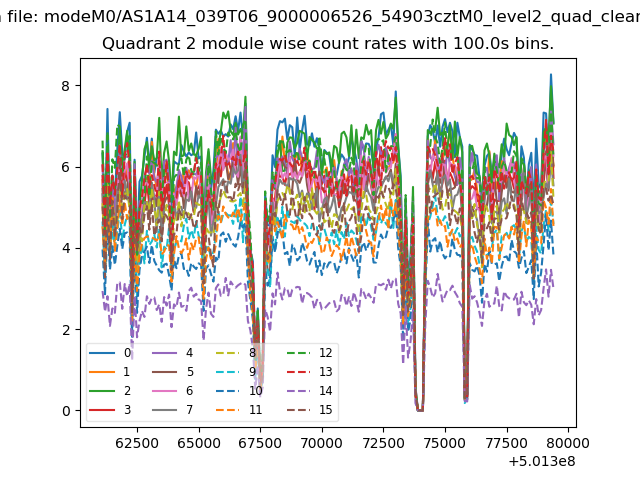
| Module-wise count rates for Quadrant B Data is divided into 100 sec bins |
 |
 |
| Module-wise count rates for Quadrant C Data is divided into 100 sec bins |
 |
 |
| Module-wise count rates for Quadrant D Data is divided into 100 sec bins |
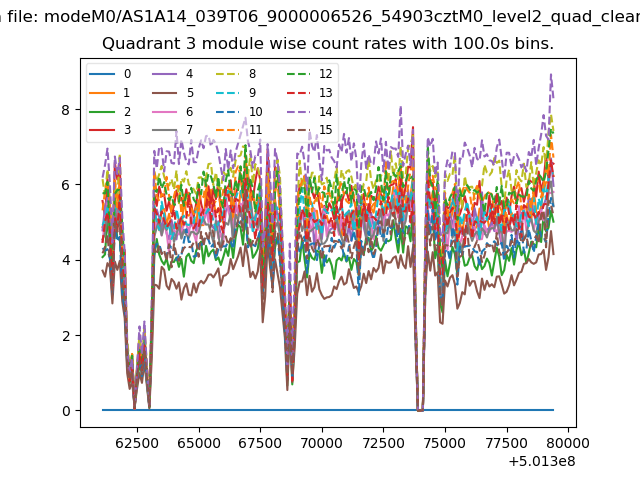 |
 |
| Parameter | Plot |
|---|---|
| CZT HV Monitor | 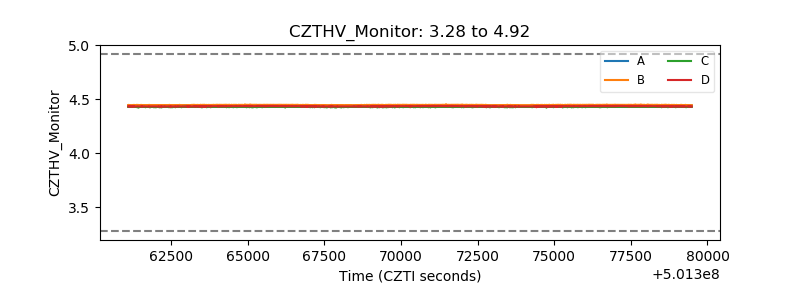 |
| D_VDD | 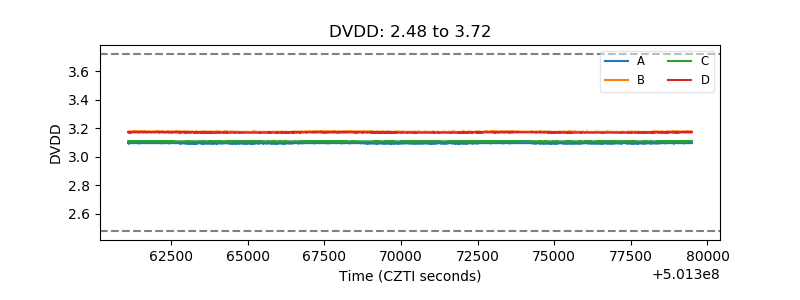 |
| Temperature 1 | 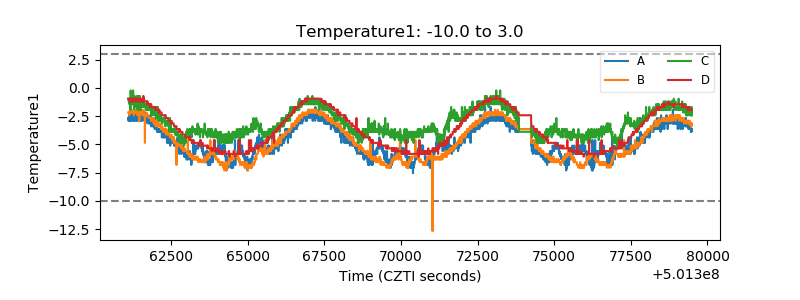 |
| Veto HV Monitor | 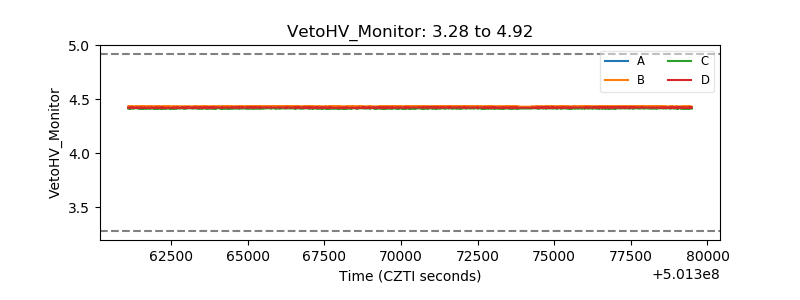 |
| Veto LLD | 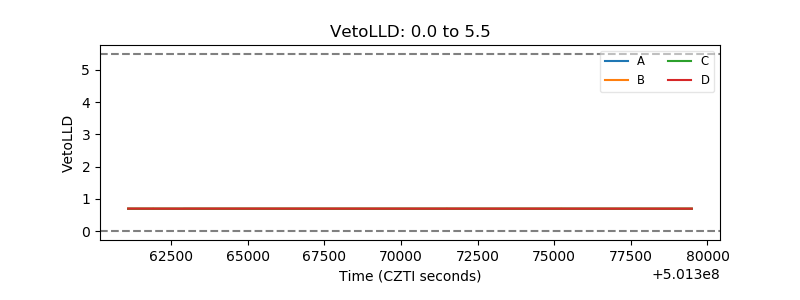 |
| Alpha Counter | 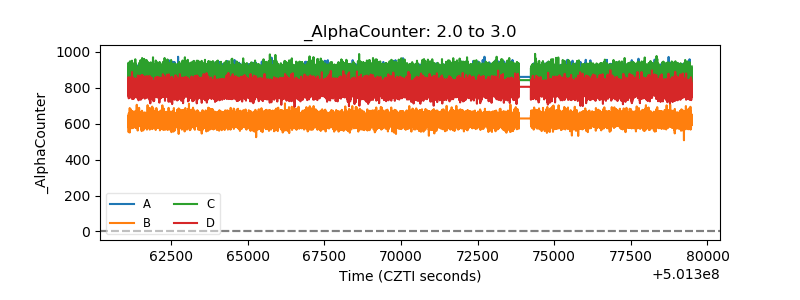 |
| _CPM_Rate | 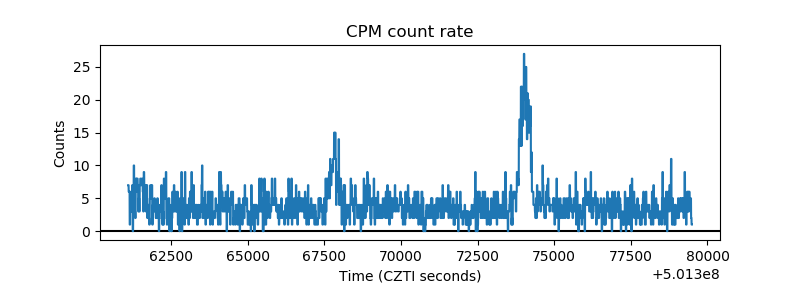 |
| CZT Counter | 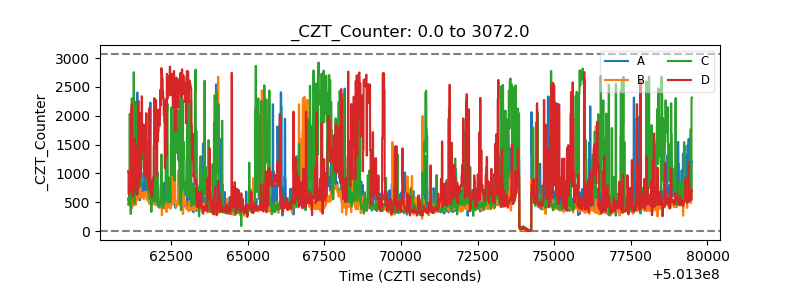 |
| +2.5 Volts monitor |  |
| +5 Volts monitor |  |
| _ROLL_ROT | 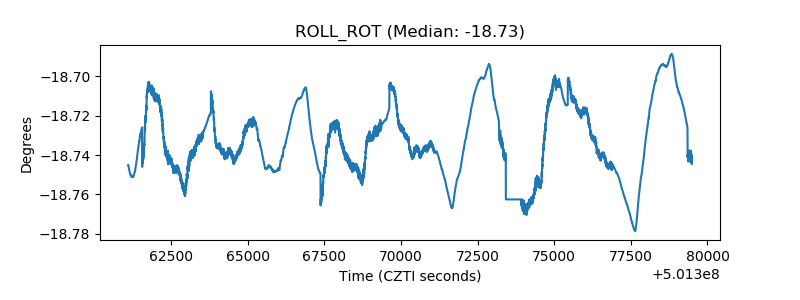 |
| _Roll_DEC | 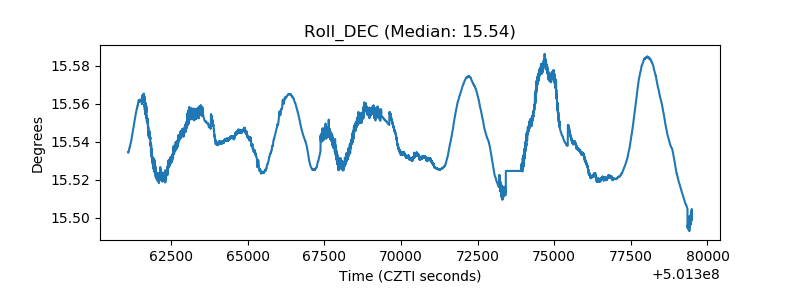 |
| _Roll_RA |  |
| Veto Counter | 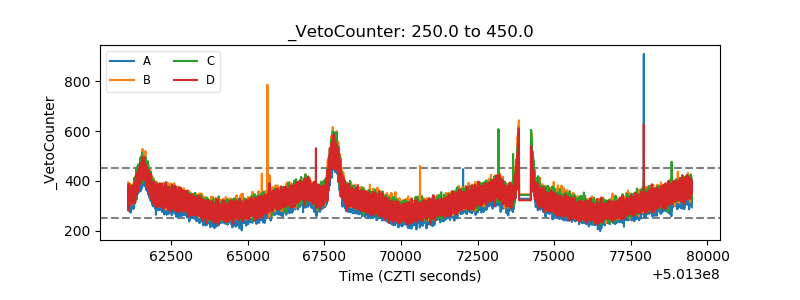 |