| Param | Original file | Final file |
|---|---|---|
| Filename | modeM0/AS1A14_039T06_9000006526_54904cztM0_level2.fits | modeM0/AS1A14_039T06_9000006526_54904cztM0_level2_quad_clean.evt |
| Size (bytes) | 1,030,098,240 | 179,660,160 |
| Size | 982.4 MB | 171.3 MB |
| Events in quadrant A | 9,497,412 | 1,191,982 |
| Events in quadrant B | 5,934,315 | 1,288,843 |
| Events in quadrant C | 12,666,275 | 1,019,823 |
| Events in quadrant D | 9,027,006 | 1,040,490 |
| Mode M9 | |||
|---|---|---|---|
| Quadrant | BADHDUFLAG | Total packets | Discarded packets |
| A | 0 | 23 | 0 |
| B | 0 | 23 | 0 |
| C | 0 | 23 | 0 |
| D | 0 | 23 | 0 |
| Mode M0 | |||
|---|---|---|---|
| Quadrant | BADHDUFLAG | Total packets | Discarded packets |
| A | 0 | 37492 | 10 |
| B | 0 | 27712 | 9 |
| C | 0 | 46583 | 7 |
| D | 0 | 36484 | 26 |
| Mode SS | |||
|---|---|---|---|
| Quadrant | BADHDUFLAG | Total packets | Discarded packets |
| A | 0 | 264 | 0 |
| B | 0 | 264 | 0 |
| C | 0 | 264 | 0 |
| D | 0 | 264 | 0 |
| Quadrant | Total seconds | Saturated seconds | Saturation percentage |
|---|---|---|---|
| A | 13009 | 290 | 2.229226% |
| B | 13007 | 197 | 1.514569% |
| C | 13009 | 1796 | 13.805827% |
| D | 13002 | 671 | 5.160745% |
Noise dominated data is calculated using 1-second bins in cleaned event files. If a bin has >2000 counts, and if more than 50% of those come from <1% of pixels, then it is considered to be noise-dominated and hence unusable.
| Quadrant | # 1 sec bins | Bins with >0 counts | Bins with >2000 counts | High rate bins dominated by noise | Noise dominated (total time) | Noise dominated (detector-on time) | Marked lightcurve |
|---|---|---|---|---|---|---|---|
| A | 15202 | 13015 | 117 | 117 | 0.77% | 0.90% | 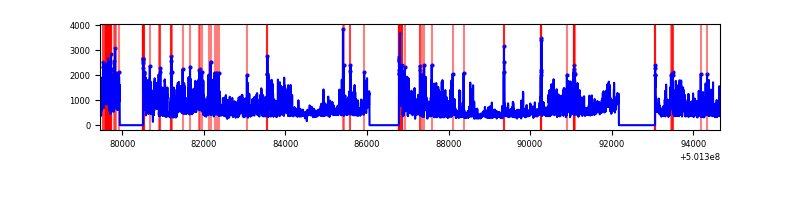 |
| B | 15201 | 13012 | 28 | 28 | 0.18% | 0.22% |  |
| C | 15201 | 13013 | 1328 | 1328 | 8.74% | 10.21% |  |
| D | 15202 | 13012 | 503 | 503 | 3.31% | 3.87% | 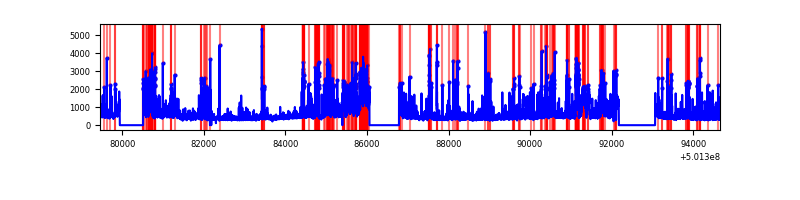 |
Top three noisy pixels from each quadrant. If the there are fewer than three noisy pixels in the level2.evt file, extra rows are filled as -1
| Pixel properties | Quadrant properties | ||||||
|---|---|---|---|---|---|---|---|
| Quadrant | DetID | PixID | Counts | Sigma | Mean | Median | Sigma |
| A | 3 | 14 | 3666033 | 10876.75 | 1366 | 1333 | 336.9 |
| A | 12 | 115 | 168117 | 495.01 | 1366 | 1333 | 336.9 |
| A | 0 | 8 | 146959 | 432.21 | 1366 | 1333 | 336.9 |
| B | 10 | 247 | 240842 | 821.37 | 1359 | 1308 | 291.6 |
| B | 5 | 185 | 161780 | 550.27 | 1359 | 1308 | 291.6 |
| B | 5 | 236 | 81562 | 275.19 | 1359 | 1308 | 291.6 |
| C | 4 | 5 | 4529360 | 13187.15 | 1262 | 1254 | 343.4 |
| C | 9 | 38 | 1782671 | 5188.0 | 1262 | 1254 | 343.4 |
| C | 6 | 223 | 626095 | 1819.72 | 1262 | 1254 | 343.4 |
| D | 11 | 129 | 1956716 | 5314.7 | 1303 | 1247 | 367.9 |
| D | 10 | 181 | 497327 | 1348.28 | 1303 | 1247 | 367.9 |
| D | 6 | 239 | 470376 | 1275.03 | 1303 | 1247 | 367.9 |
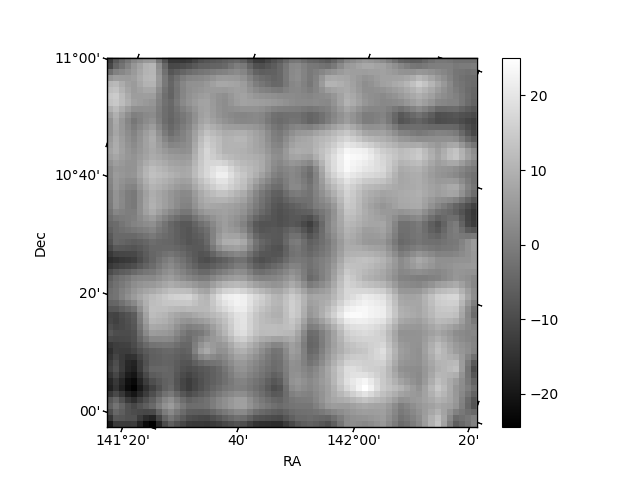
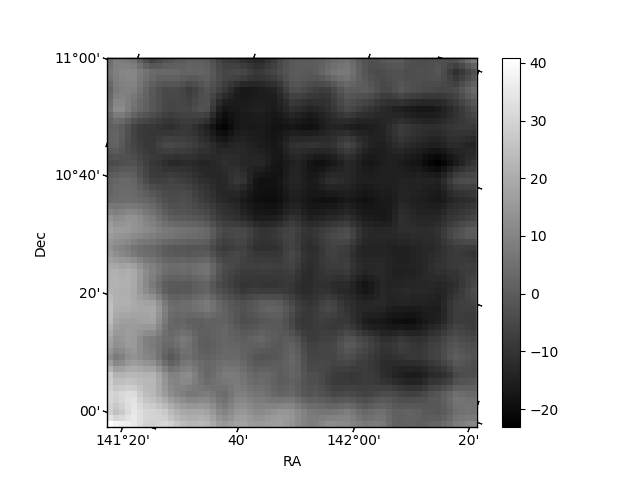
Histogram calculated using DETX and DETY for each event in the final _common_clean file
| Quadrant A | 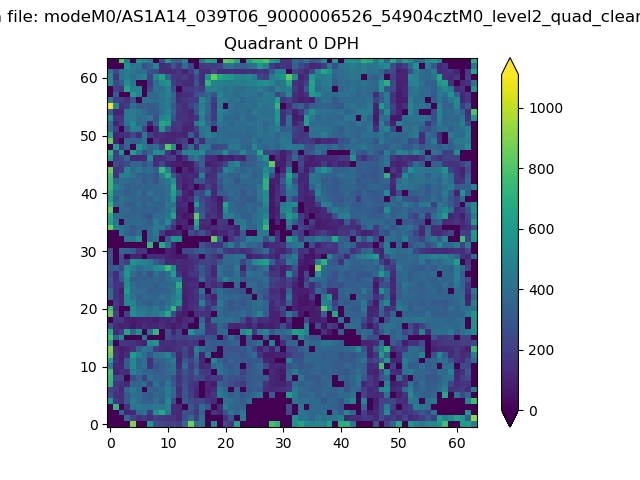 |
 |
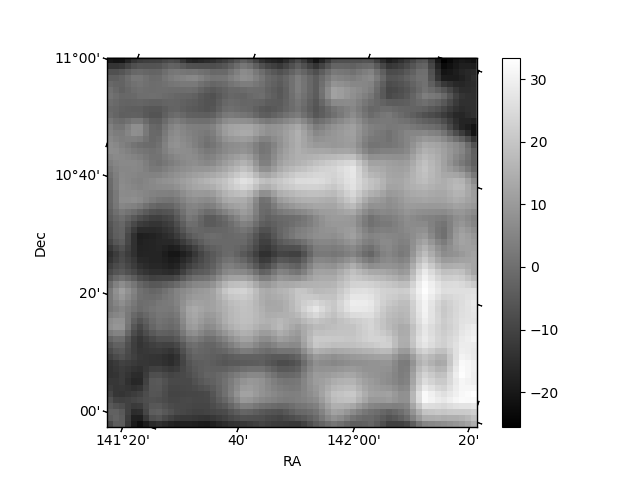
Quadrant B |
|---|---|---|---|
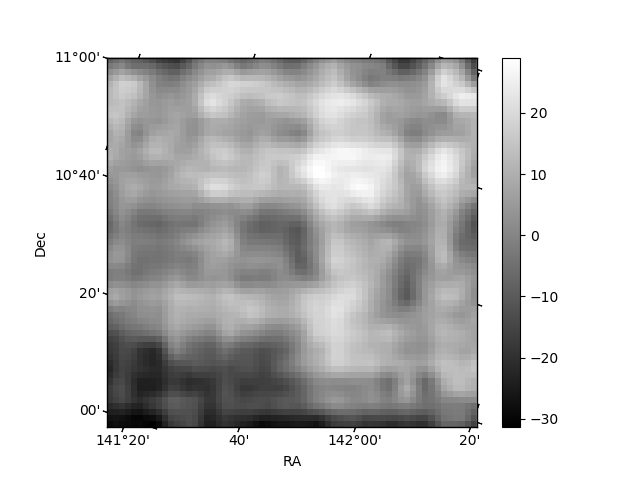
| Quadrant D |  |
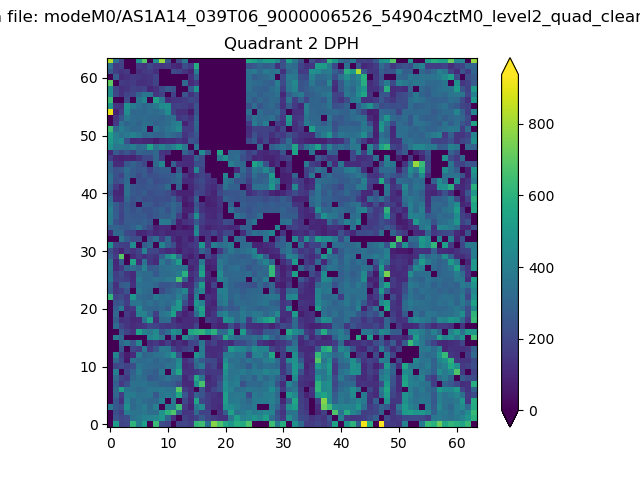 |
Quadrant C |
| Plot type | Count rate plots | Images |
|---|---|---|
| Comparison with Poisson distribution Blue bars denote a histogram of data divided into 1 sec bins. Red curve is a Poisson curve with rate = median count rate of data. |
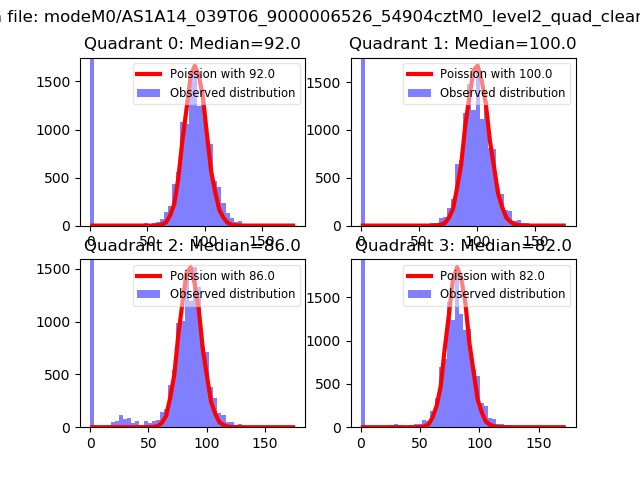 |
 |
| Quadrant-wise count rates Data is divided into 100 sec bins |
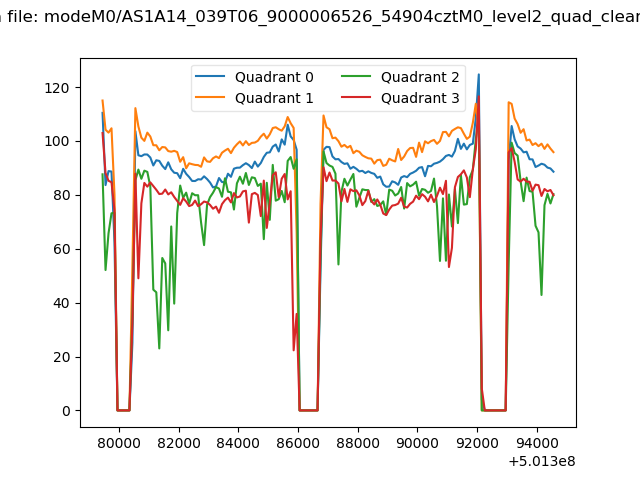 |
|
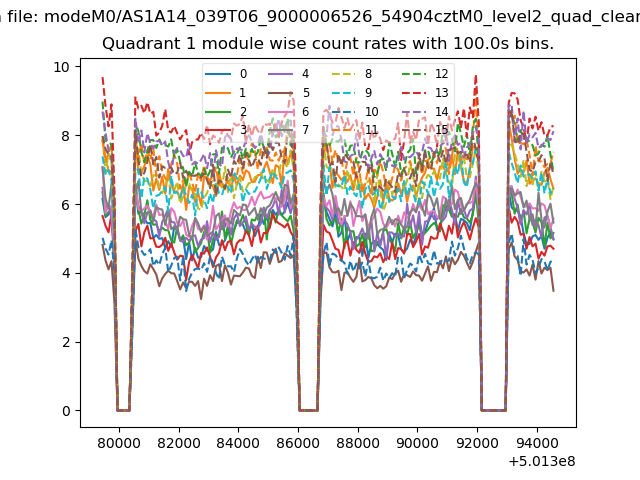
| Module-wise count rates for Quadrant A Data is divided into 100 sec bins |
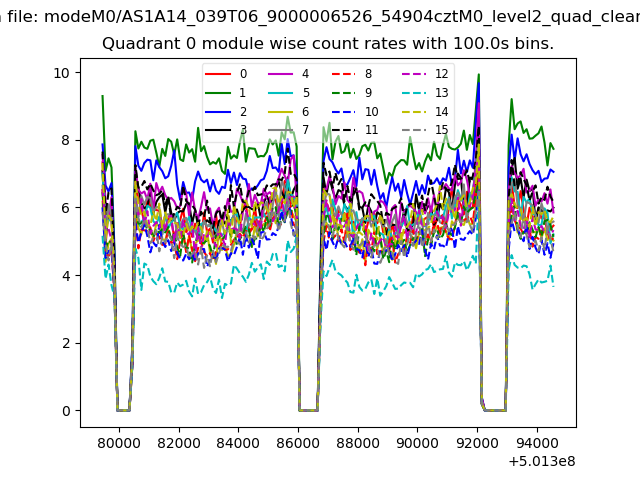 |
 |
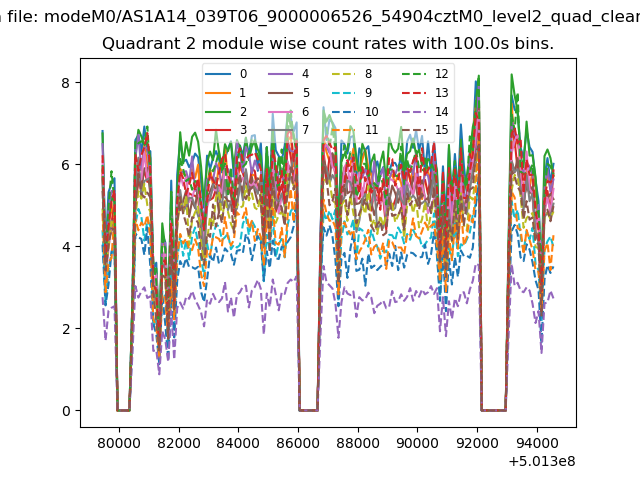
| Module-wise count rates for Quadrant B Data is divided into 100 sec bins |
 |
 |
| Module-wise count rates for Quadrant C Data is divided into 100 sec bins |
 |
 |
| Module-wise count rates for Quadrant D Data is divided into 100 sec bins |
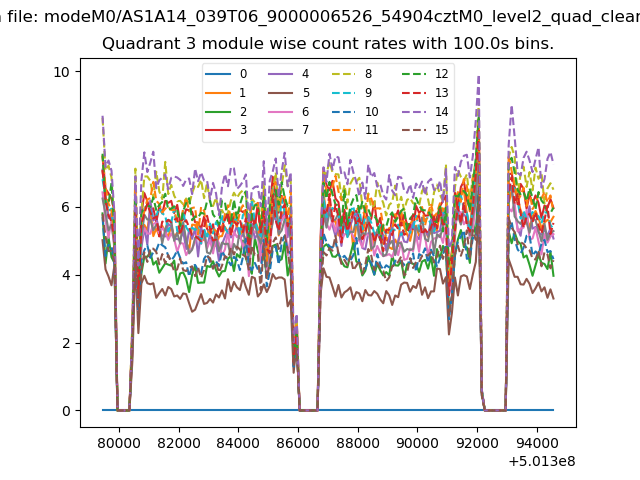 |
 |
| Parameter | Plot |
|---|---|
| CZT HV Monitor | 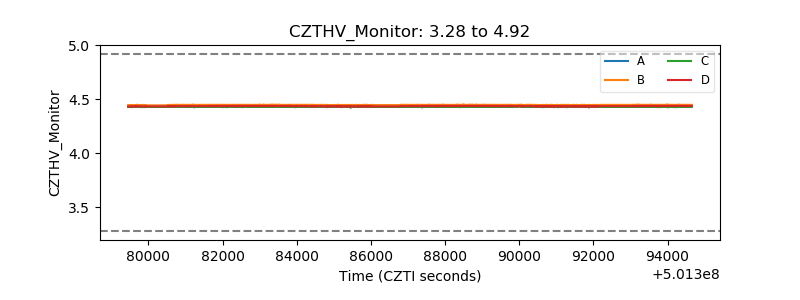 |
| D_VDD | 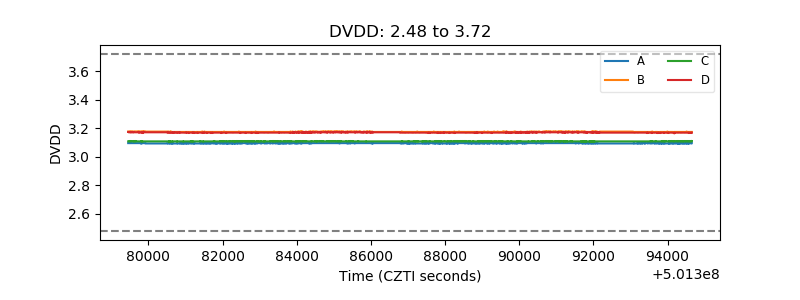 |
| Temperature 1 | 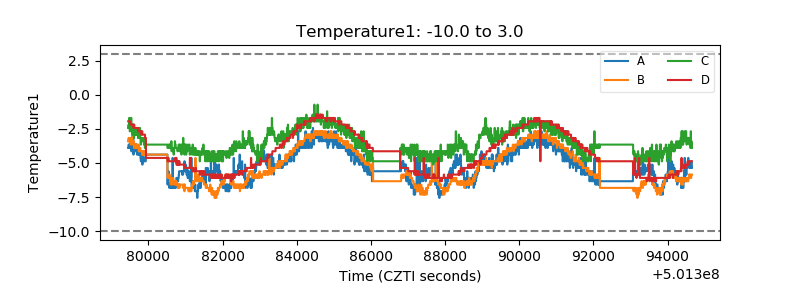 |
| Veto HV Monitor | 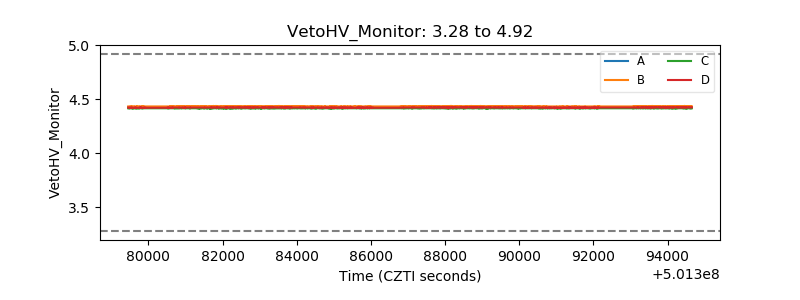 |
| Veto LLD | 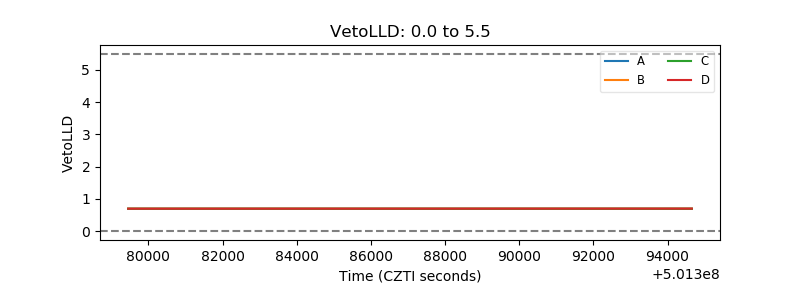 |
| Alpha Counter | 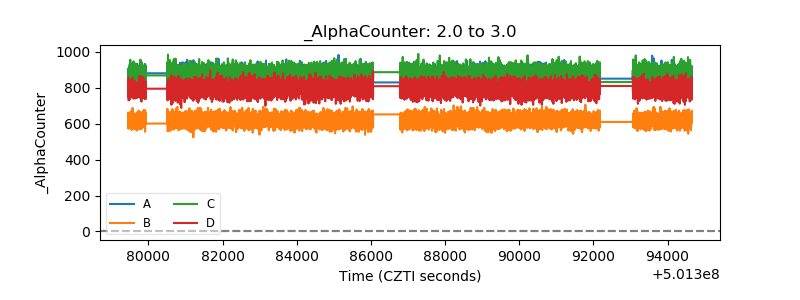 |
| _CPM_Rate | 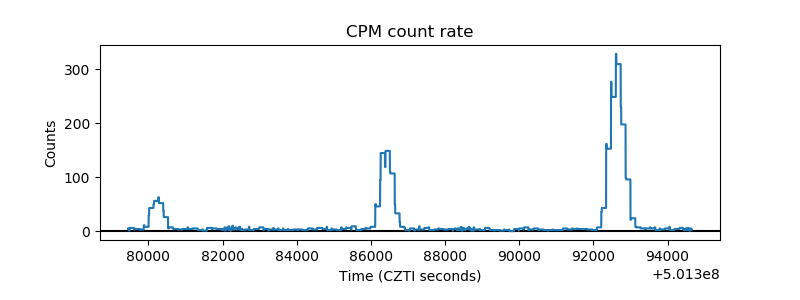 |
| CZT Counter | 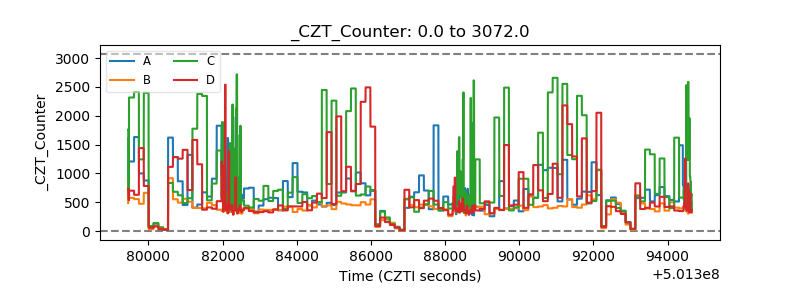 |
| +2.5 Volts monitor |  |
| +5 Volts monitor |  |
| _ROLL_ROT | 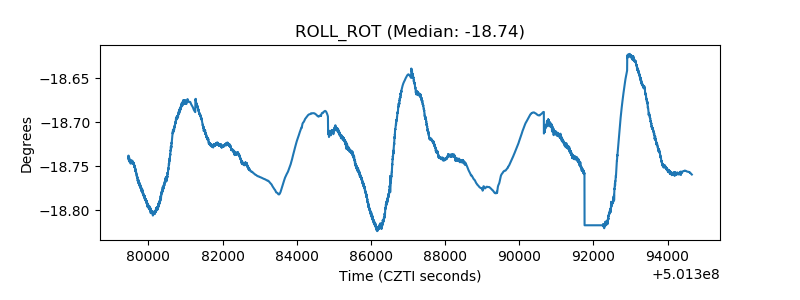 |
| _Roll_DEC | 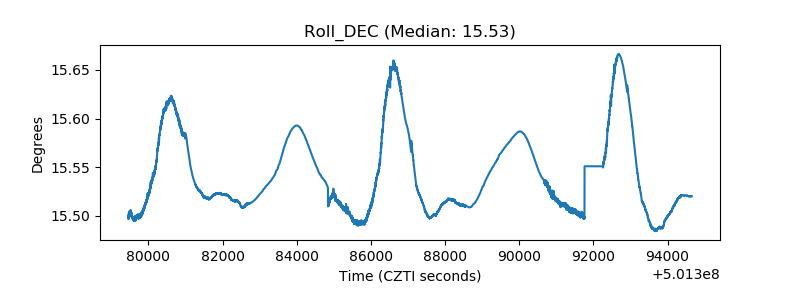 |
| _Roll_RA |  |
| Veto Counter | 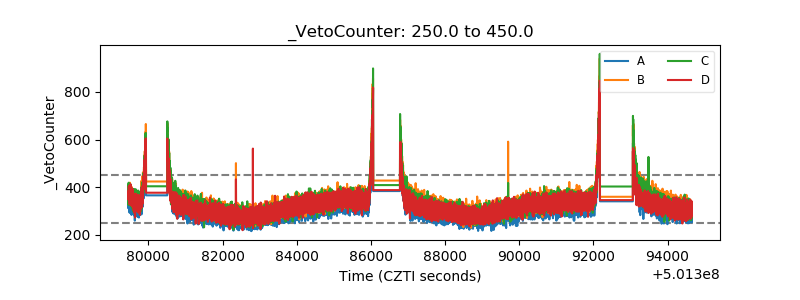 |