| Param | Original file | Final file |
|---|---|---|
| Filename | modeM0/AS1A14_039T06_9000006526_54906cztM0_level2.fits | modeM0/AS1A14_039T06_9000006526_54906cztM0_level2_quad_clean.evt |
| Size (bytes) | 529,551,360 | 98,110,080 |
| Size | 505.0 MB | 93.6 MB |
| Events in quadrant A | 4,886,427 | 649,638 |
| Events in quadrant B | 3,120,412 | 700,627 |
| Events in quadrant C | 6,879,797 | 560,831 |
| Events in quadrant D | 4,180,943 | 579,466 |
| Mode M9 | |||
|---|---|---|---|
| Quadrant | BADHDUFLAG | Total packets | Discarded packets |
| A | 0 | 19 | 0 |
| B | 0 | 19 | 0 |
| C | 0 | 19 | 0 |
| D | 0 | 19 | 0 |
| Mode M0 | |||
|---|---|---|---|
| Quadrant | BADHDUFLAG | Total packets | Discarded packets |
| A | 0 | 19461 | 2 |
| B | 0 | 14554 | 2 |
| C | 0 | 25218 | 2 |
| D | 0 | 17443 | 2 |
| Mode SS | |||
|---|---|---|---|
| Quadrant | BADHDUFLAG | Total packets | Discarded packets |
| A | 0 | 142 | 0 |
| B | 0 | 142 | 0 |
| C | 0 | 142 | 0 |
| D | 0 | 142 | 0 |
| Quadrant | Total seconds | Saturated seconds | Saturation percentage |
|---|---|---|---|
| A | 6888 | 169 | 2.453542% |
| B | 6889 | 104 | 1.509653% |
| C | 6889 | 945 | 13.717521% |
| D | 6889 | 219 | 3.178981% |
Noise dominated data is calculated using 1-second bins in cleaned event files. If a bin has >2000 counts, and if more than 50% of those come from <1% of pixels, then it is considered to be noise-dominated and hence unusable.
| Quadrant | # 1 sec bins | Bins with >0 counts | Bins with >2000 counts | High rate bins dominated by noise | Noise dominated (total time) | Noise dominated (detector-on time) | Marked lightcurve |
|---|---|---|---|---|---|---|---|
| A | 8809 | 6890 | 135 | 135 | 1.53% | 1.96% | 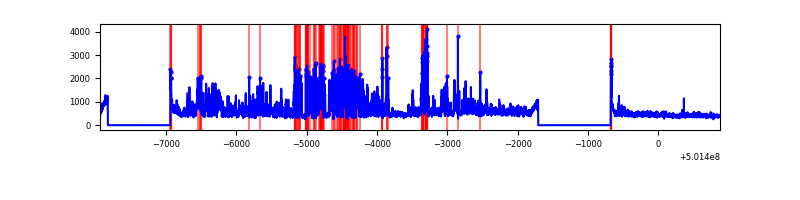 |
| B | 8810 | 6891 | 9 | 9 | 0.10% | 0.13% | 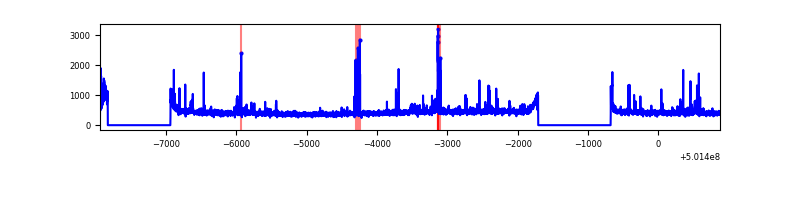 |
| C | 8810 | 6891 | 822 | 822 | 9.33% | 11.93% | 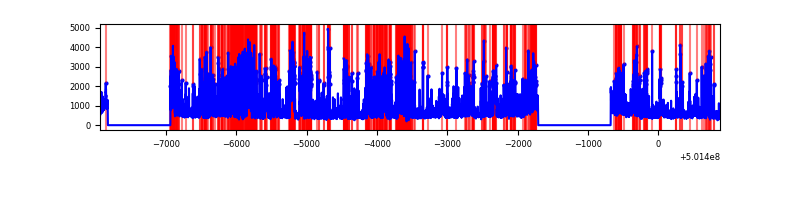 |
| D | 8810 | 6891 | 194 | 194 | 2.20% | 2.82% | 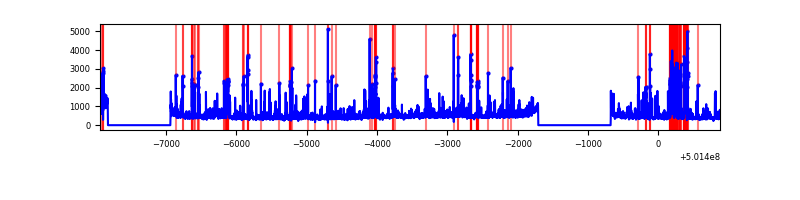 |
Top three noisy pixels from each quadrant. If the there are fewer than three noisy pixels in the level2.evt file, extra rows are filled as -1
| Pixel properties | Quadrant properties | ||||||
|---|---|---|---|---|---|---|---|
| Quadrant | DetID | PixID | Counts | Sigma | Mean | Median | Sigma |
| A | 3 | 14 | 1784474 | 9885.3 | 728 | 711 | 180.4 |
| A | 13 | 248 | 158992 | 877.17 | 728 | 711 | 180.4 |
| A | 0 | 8 | 54884 | 300.22 | 728 | 711 | 180.4 |
| B | 5 | 185 | 109423 | 689.49 | 722 | 692 | 157.7 |
| B | 10 | 247 | 59555 | 373.27 | 722 | 692 | 157.7 |
| B | 5 | 236 | 47970 | 299.8 | 722 | 692 | 157.7 |
| C | 9 | 38 | 2476426 | 13361.62 | 676 | 670 | 185.3 |
| C | 4 | 5 | 1146434 | 6183.67 | 676 | 670 | 185.3 |
| C | 12 | 252 | 139423 | 748.85 | 676 | 670 | 185.3 |
| D | 10 | 181 | 563018 | 2823.98 | 699 | 668 | 199.1 |
| D | 11 | 129 | 309234 | 1549.54 | 699 | 668 | 199.1 |
| D | 6 | 239 | 246218 | 1233.09 | 699 | 668 | 199.1 |
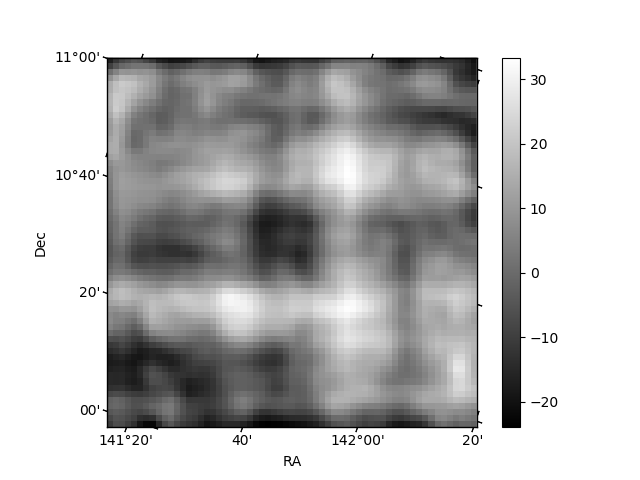
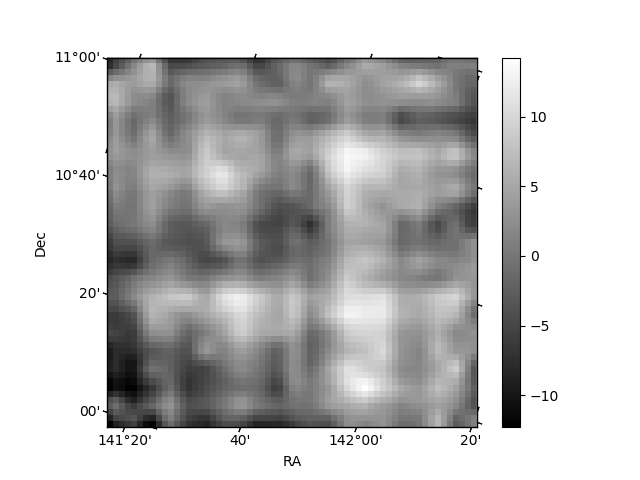
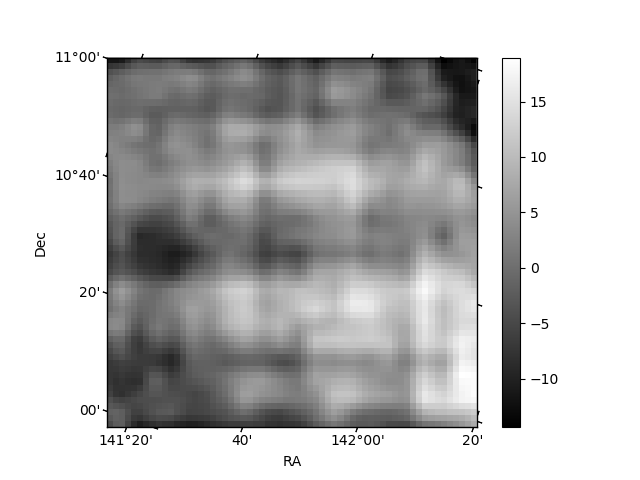
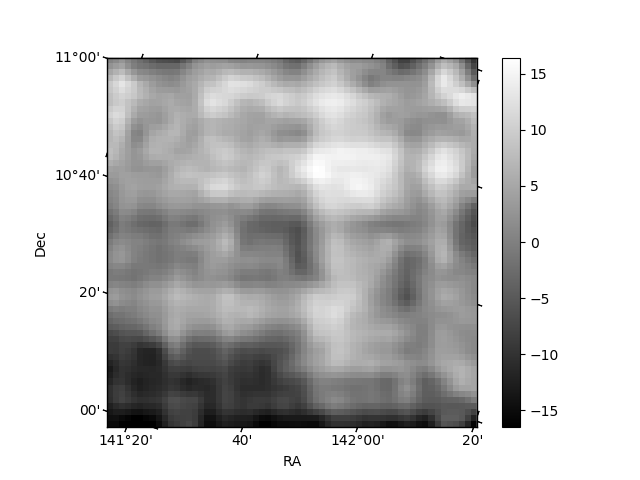
Histogram calculated using DETX and DETY for each event in the final _common_clean file
| Quadrant A | 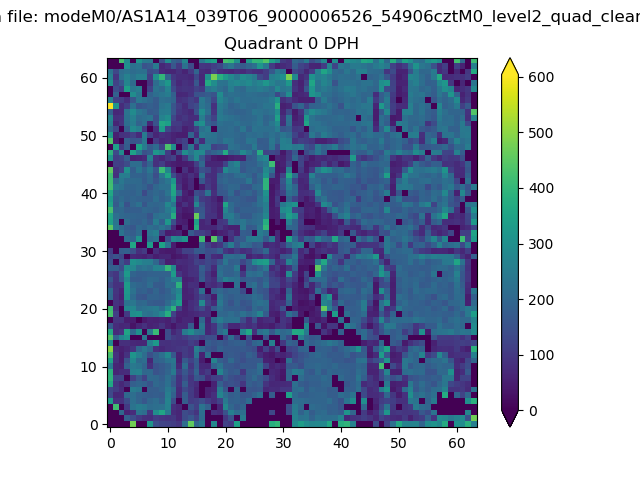 |
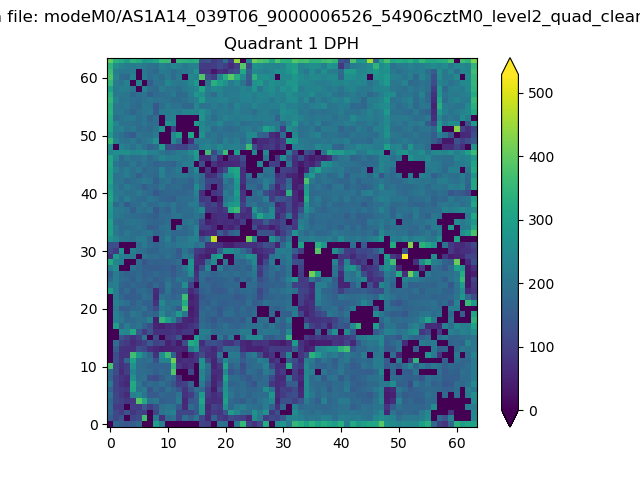 |
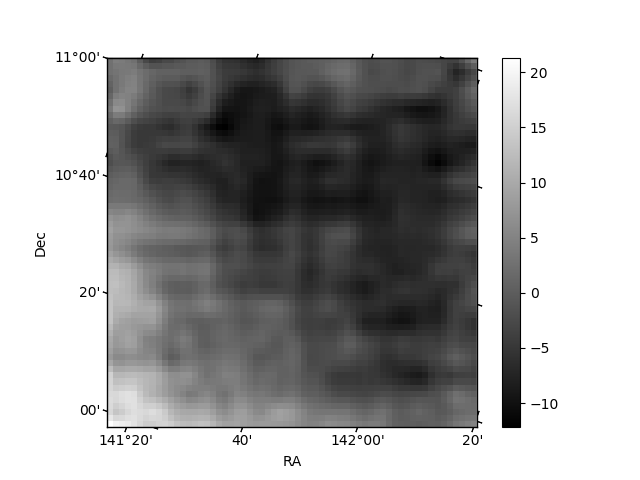
Quadrant B |
|---|---|---|---|
| Quadrant D | 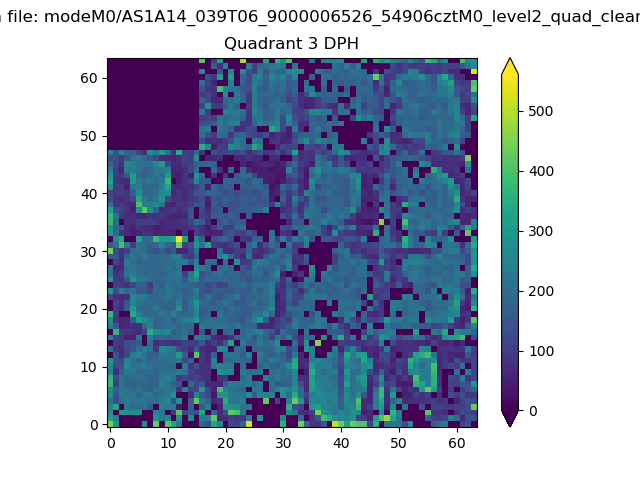 |
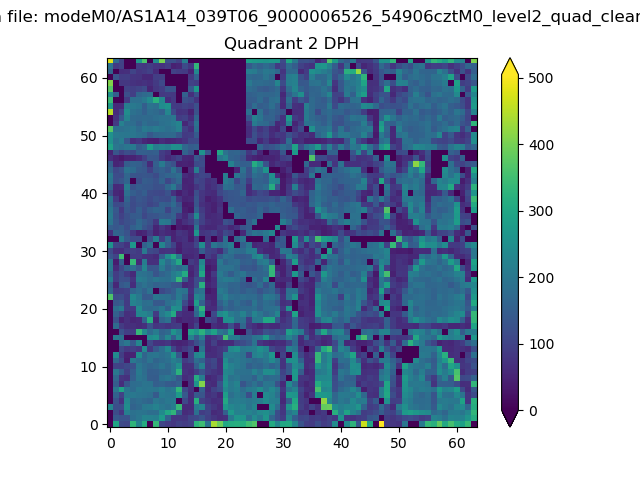 |
Quadrant C |
| Plot type | Count rate plots | Images |
|---|---|---|
| Comparison with Poisson distribution Blue bars denote a histogram of data divided into 1 sec bins. Red curve is a Poisson curve with rate = median count rate of data. |
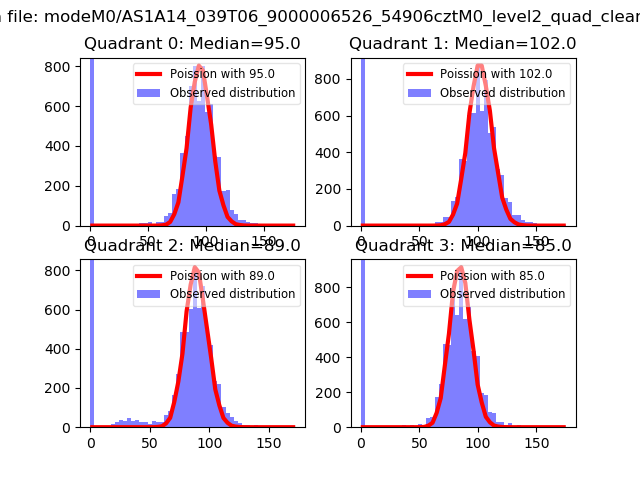 |
 |
| Quadrant-wise count rates Data is divided into 100 sec bins |
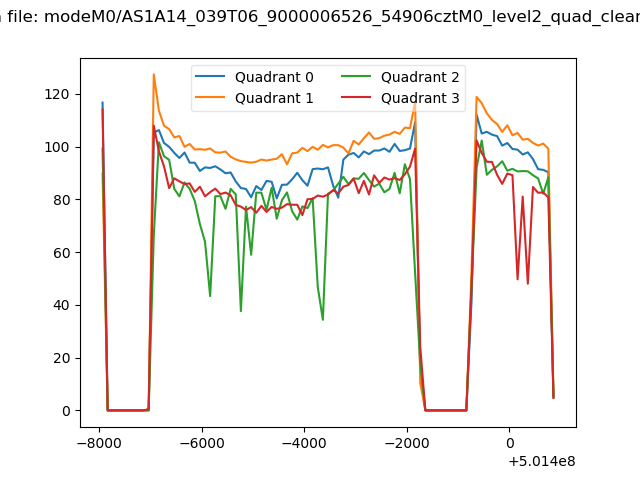 |
|
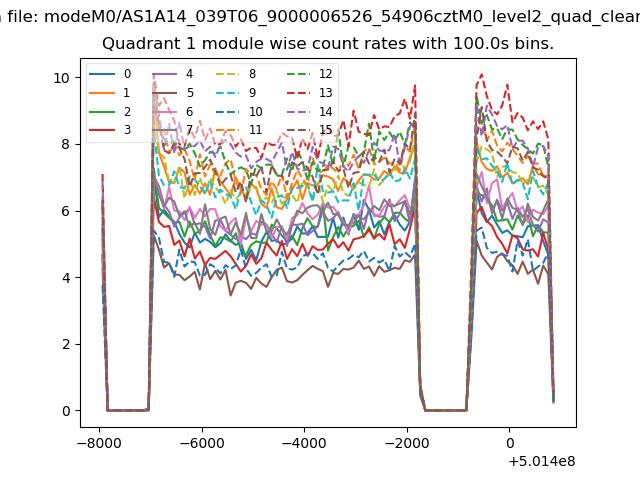
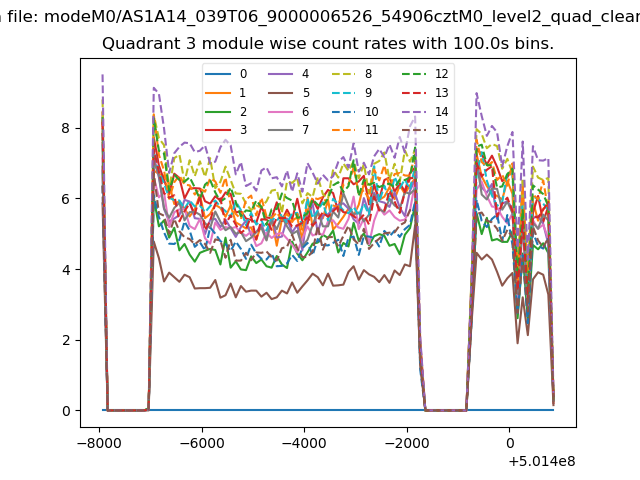
| Module-wise count rates for Quadrant A Data is divided into 100 sec bins |
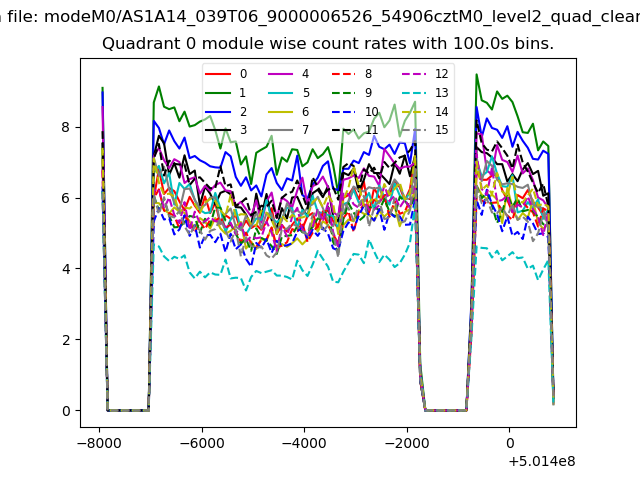 |
 |
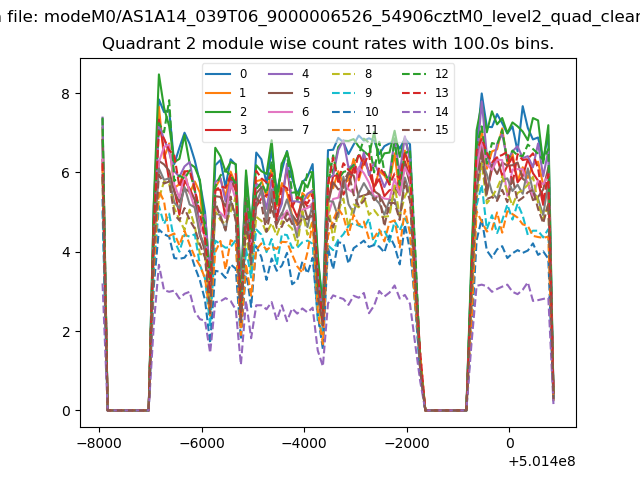
| Module-wise count rates for Quadrant B Data is divided into 100 sec bins |
 |
 |
| Module-wise count rates for Quadrant C Data is divided into 100 sec bins |
 |
 |
| Module-wise count rates for Quadrant D Data is divided into 100 sec bins |
 |
 |
| Parameter | Plot |
|---|---|
| CZT HV Monitor | 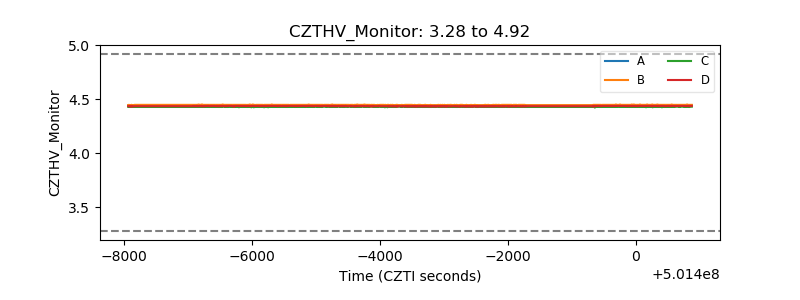 |
| D_VDD |  |
| Temperature 1 | 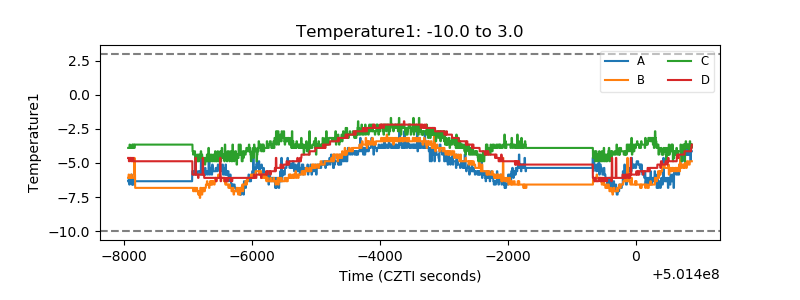 |
| Veto HV Monitor | 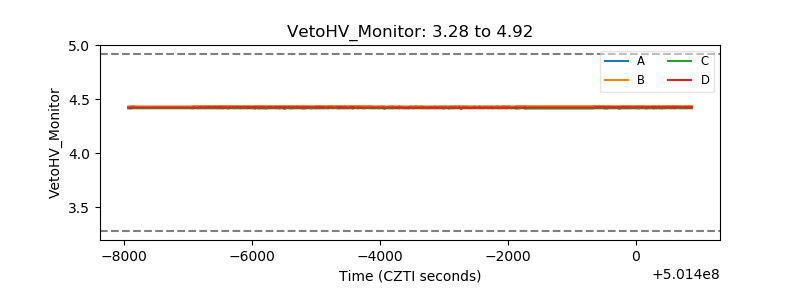 |
| Veto LLD | 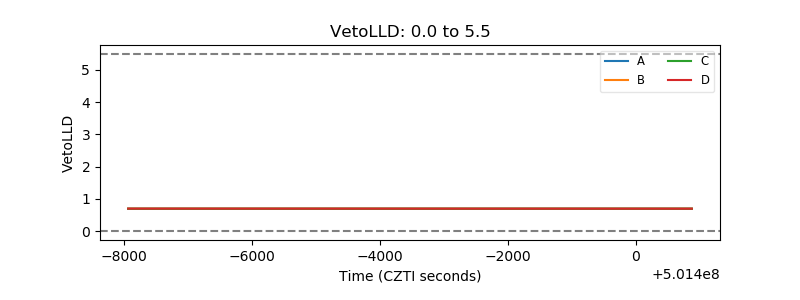 |
| Alpha Counter | 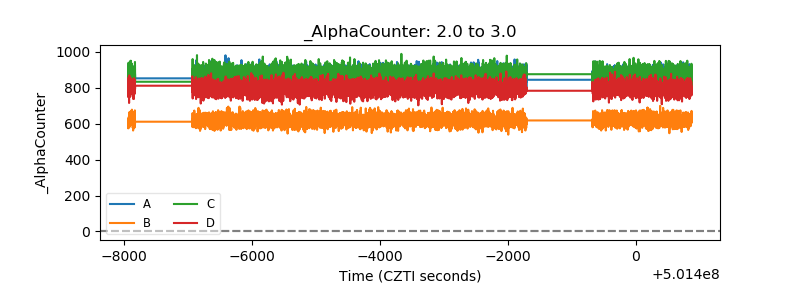 |
| _CPM_Rate | 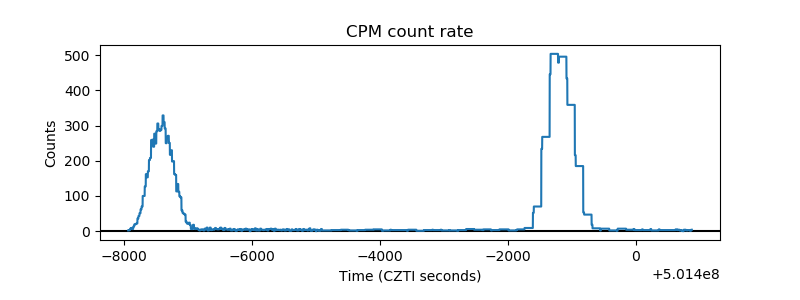 |
| CZT Counter | 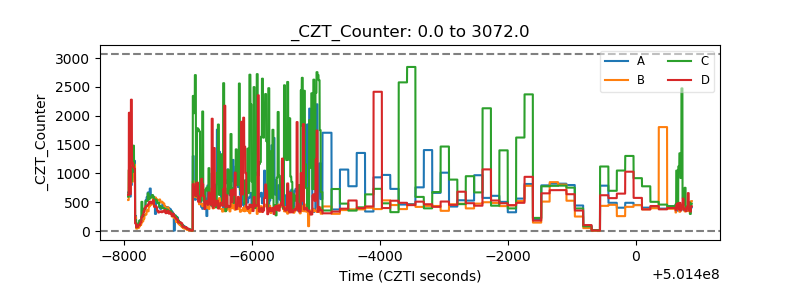 |
| +2.5 Volts monitor | 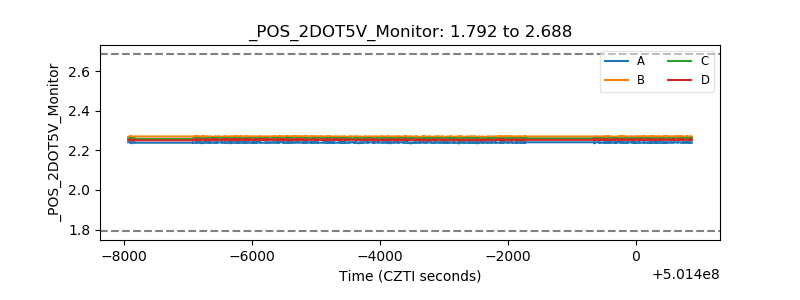 |
| +5 Volts monitor |  |
| _ROLL_ROT | 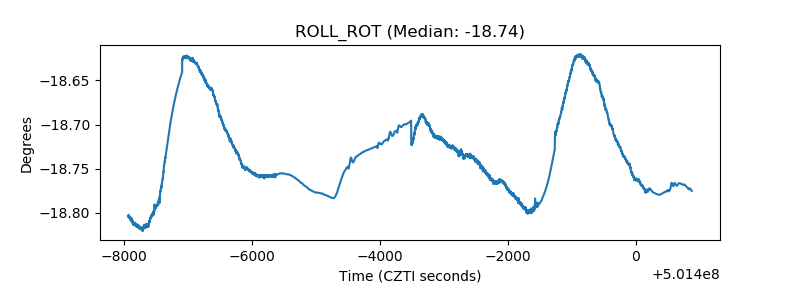 |
| _Roll_DEC | 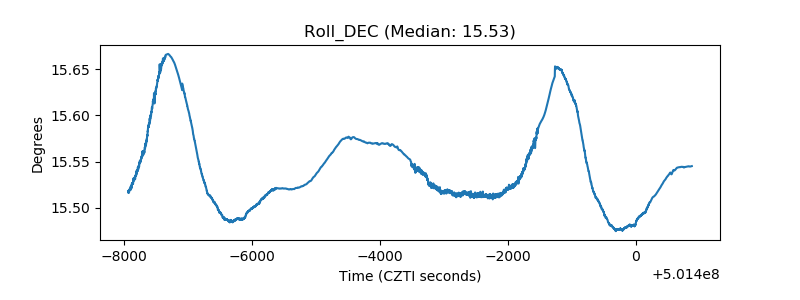 |
| _Roll_RA | 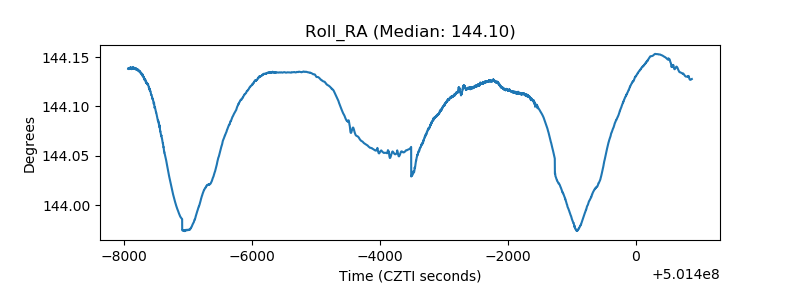 |
| Veto Counter | 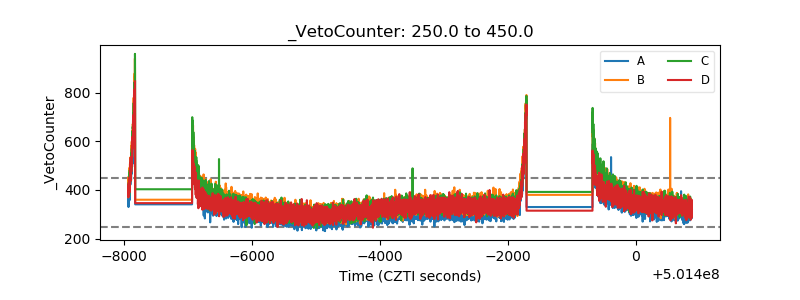 |