| Param | Original file | Final file |
|---|---|---|
| Filename | modeM0/AS1A14_014T01_9000006528cztM0_level2.fits | modeM0/AS1A14_014T01_9000006528cztM0_level2_quad_clean.evt |
| Size (bytes) | 4,442,112,000 | 1,471,924,800 |
| Size | 4.1 GB | 1.4 GB |
| Events in quadrant A | 32,543,313 | 4,701,174 |
| Events in quadrant B | 32,329,501 | 5,134,144 |
| Events in quadrant C | 29,433,798 | 4,502,203 |
| Events in quadrant D | 11,487,240 | 1,599,668 |
| Mode M0 | |||
|---|---|---|---|
| Quadrant | BADHDUFLAG | Total packets | Discarded packets |
| A | 0 | 1187354 | 0 |
| B | 0 | 924556 | 0 |
| C | 0 | 1165796 | 0 |
| D | 0 | 2370998 | 0 |
| Mode SS | |||
|---|---|---|---|
| Quadrant | BADHDUFLAG | Total packets | Discarded packets |
| A | 0 | 8477 | 0 |
| B | 0 | 8483 | 0 |
| C | 0 | 8665 | 0 |
| D | 0 | 8909 | 0 |
| Mode M9 | |||
|---|---|---|---|
| Quadrant | BADHDUFLAG | Total packets | Discarded packets |
| A | 0 | 540 | 0 |
| B | 0 | 537 | 0 |
| C | 0 | 541 | 0 |
| D | 0 | 538 | 0 |
| Quadrant | Total seconds | Saturated seconds | Saturation percentage |
|---|---|---|---|
| A | 424233 | 33105 | 7.803495% |
| B | 424870 | 8408 | 1.978958% |
| C | 425332 | 26726 | 6.283562% |
| D | 427627 | 209753 | 49.050458% |
Noise dominated data is calculated using 1-second bins in cleaned event files. If a bin has >2000 counts, and if more than 50% of those come from <1% of pixels, then it is considered to be noise-dominated and hence unusable.
| Quadrant | # 1 sec bins | Bins with >0 counts | Bins with >2000 counts | High rate bins dominated by noise | Noise dominated (total time) | Noise dominated (detector-on time) | Marked lightcurve |
|---|---|---|---|---|---|---|---|
| A | 594965 | 430656 | 0 | 0 | 0.00% | 0.00% | 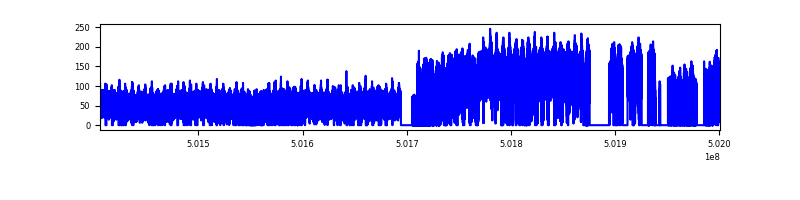 |
| B | 529003 | 417285 | 0 | 0 | 0.00% | 0.00% | 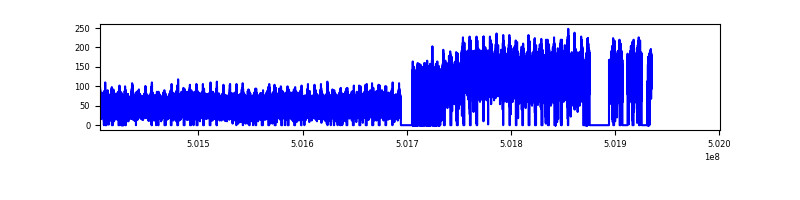 |
| C | 512758 | 407200 | 0 | 0 | 0.00% | 0.00% |  |
| D | 594963 | 392680 | 0 | 0 | 0.00% | 0.00% | 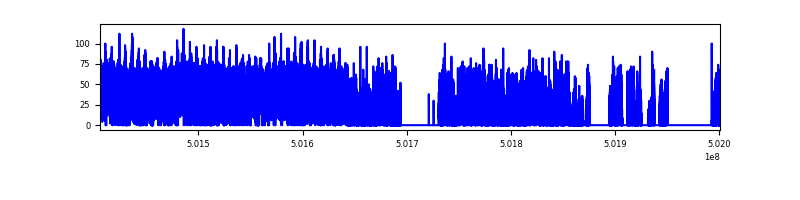 |
Top three noisy pixels from each quadrant. If the there are fewer than three noisy pixels in the level2.evt file, extra rows are filled as -1
| Pixel properties | Quadrant properties | ||||||
|---|---|---|---|---|---|---|---|
| Quadrant | DetID | PixID | Counts | Sigma | Mean | Median | Sigma |
| A | 14 | 188 | 26966 | 8.52 | 8611 | 8197 | 2203.4 |
| A | 9 | 255 | 22989 | 6.71 | 8611 | 8197 | 2203.4 |
| A | 14 | 204 | 22694 | 6.58 | 8611 | 8197 | 2203.4 |
| B | 2 | 9 | 26453 | 10.05 | 8671 | 8325 | 1803.7 |
| B | 2 | 8 | 23234 | 8.27 | 8671 | 8325 | 1803.7 |
| B | 3 | 25 | 20759 | 6.89 | 8671 | 8325 | 1803.7 |
| C | 6 | 179 | 21457 | 6.28 | 7923 | 7534 | 2217.2 |
| C | -1 | -1 | -1 | -1.0 | 7923 | 7534 | 2217.2 |
| C | -1 | -1 | -1 | -1.0 | 7923 | 7534 | 2217.2 |
| D | 6 | 218 | 14444 | 10.55 | 3291 | 2916 | 1093.1 |
| D | 3 | 30 | 10767 | 7.18 | 3291 | 2916 | 1093.1 |
| D | 8 | 12 | 10602 | 7.03 | 3291 | 2916 | 1093.1 |
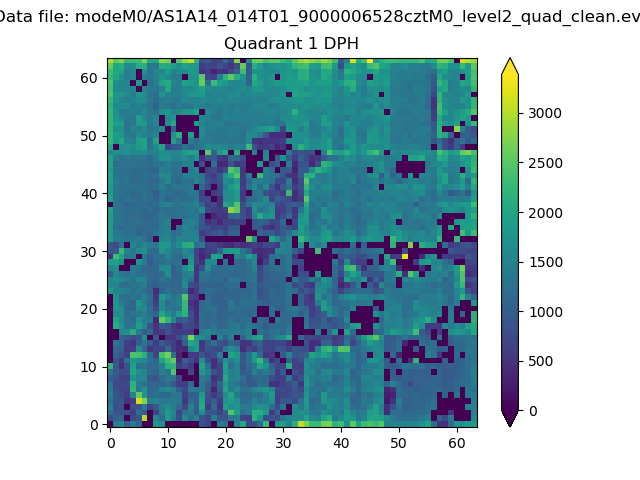
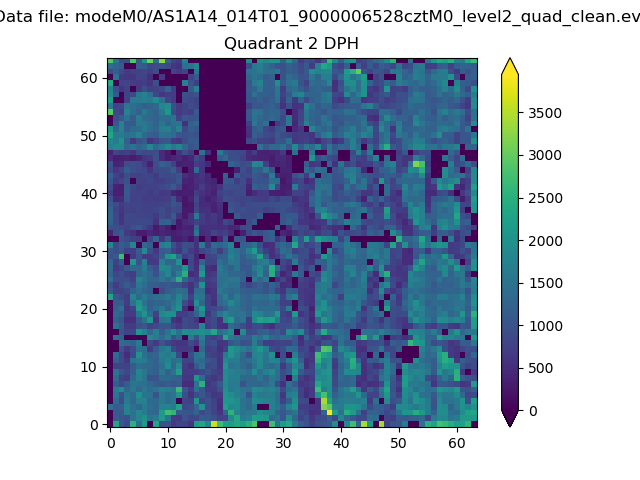
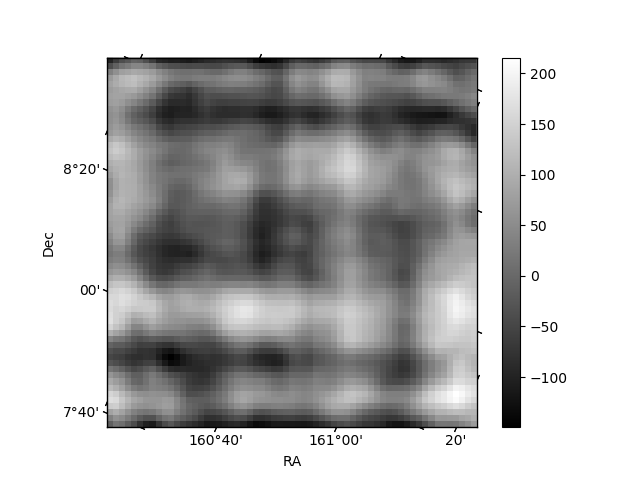
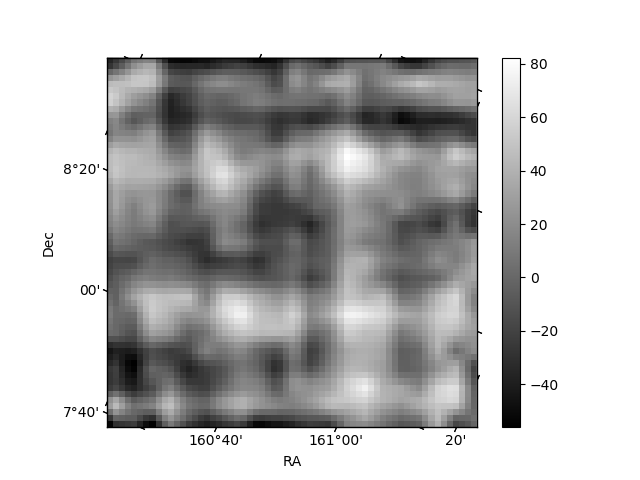
Histogram calculated using DETX and DETY for each event in the final _common_clean file
| Quadrant A | 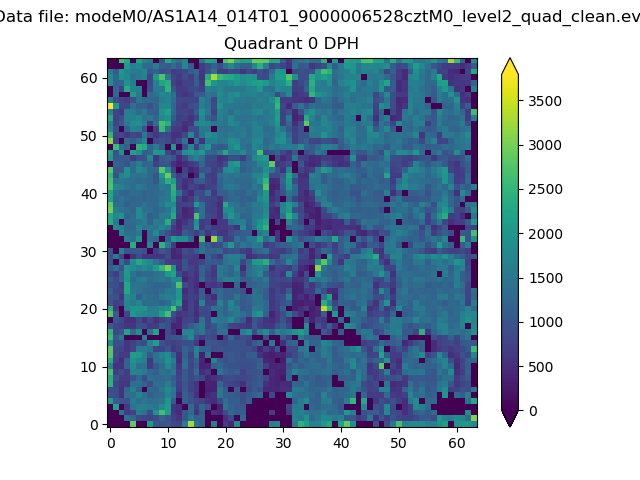 |
 |
Quadrant B |
|---|---|---|---|
| Quadrant D | 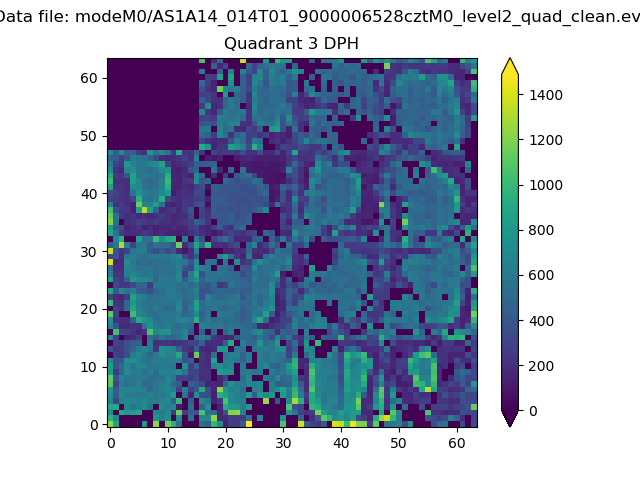 |
 |
Quadrant C |
| Plot type | Count rate plots | Images |
|---|---|---|
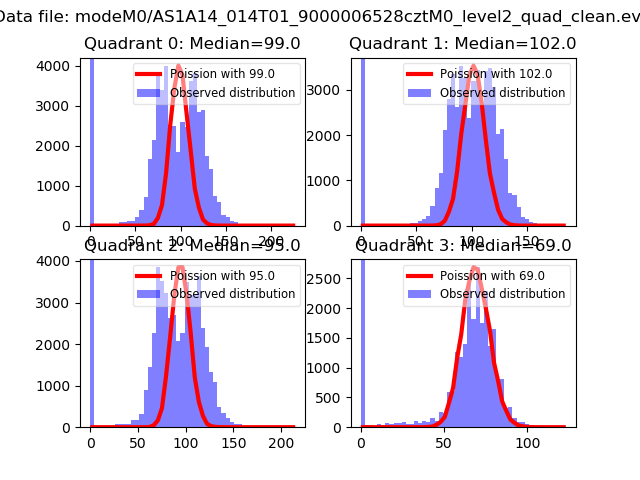
| Comparison with Poisson distribution Blue bars denote a histogram of data divided into 1 sec bins. Red curve is a Poisson curve with rate = median count rate of data. |
 |
 |
| Quadrant-wise count rates Data is divided into 100 sec bins |
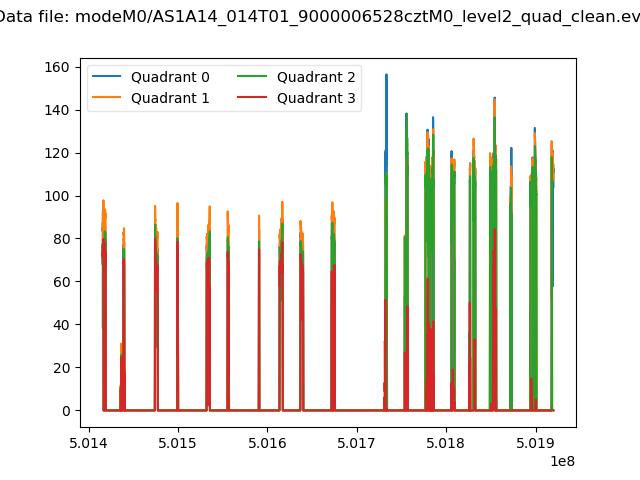 |
|
| Module-wise count rates for Quadrant A Data is divided into 100 sec bins |
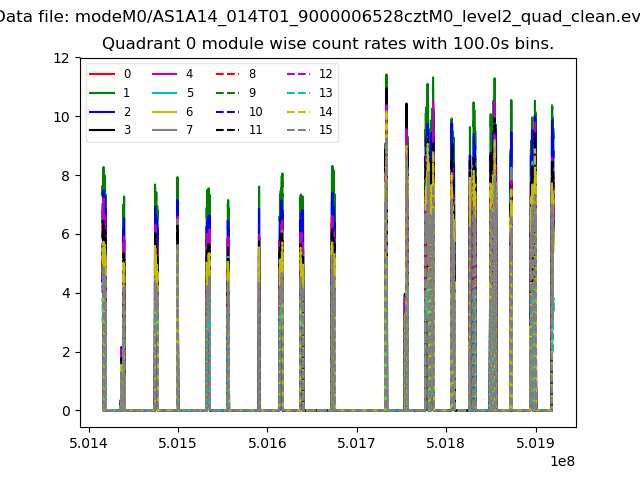 |
 |
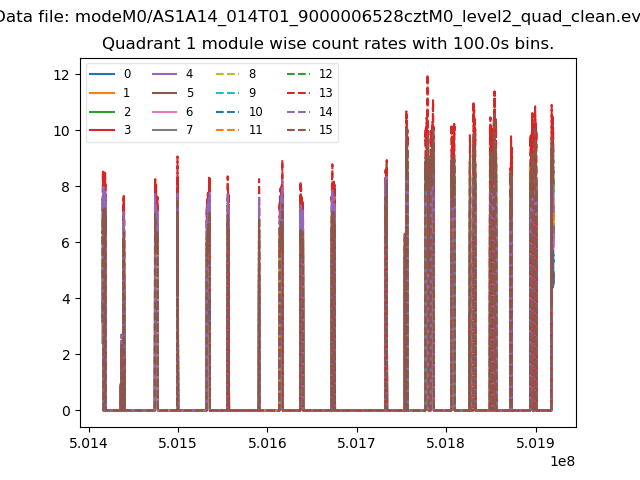
| Module-wise count rates for Quadrant B Data is divided into 100 sec bins |
 |
 |
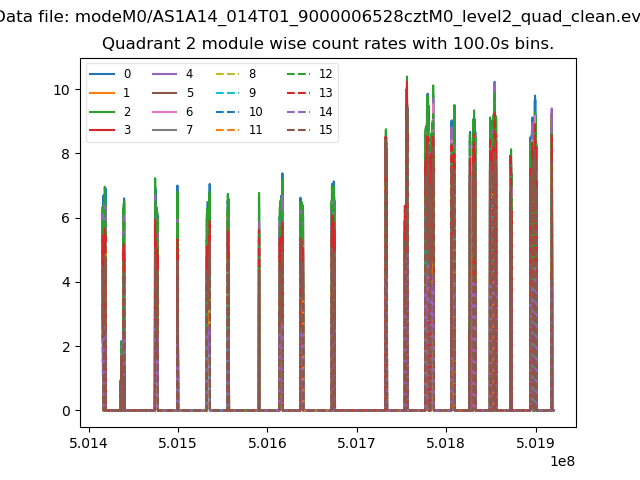
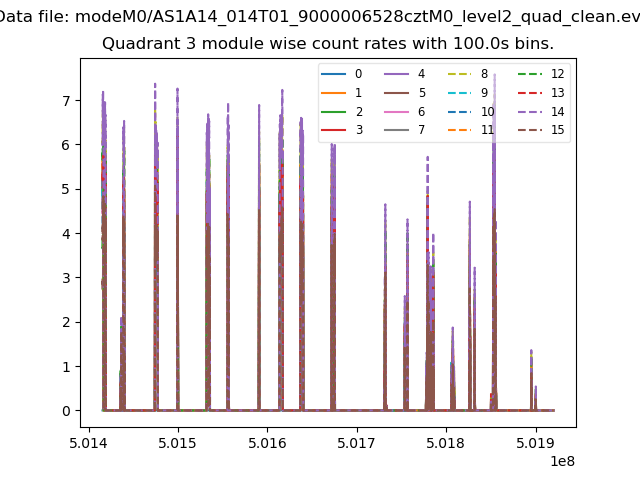
| Module-wise count rates for Quadrant C Data is divided into 100 sec bins |
 |
 |
| Module-wise count rates for Quadrant D Data is divided into 100 sec bins |
 |
 |
| Parameter | Plot |
|---|---|
| CZT HV Monitor | 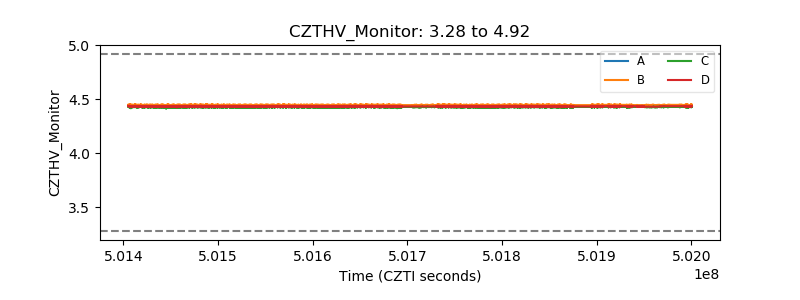 |
| D_VDD | 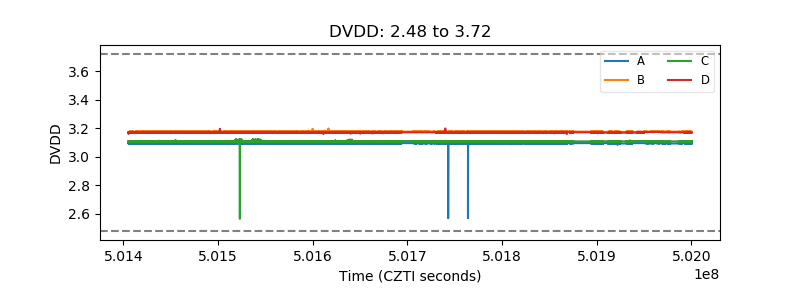 |
| Temperature 1 | 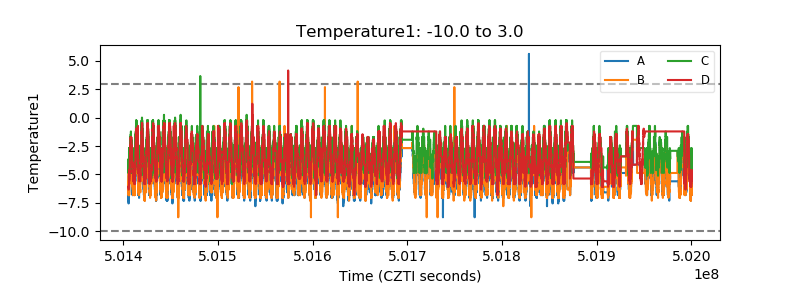 |
| Veto HV Monitor | 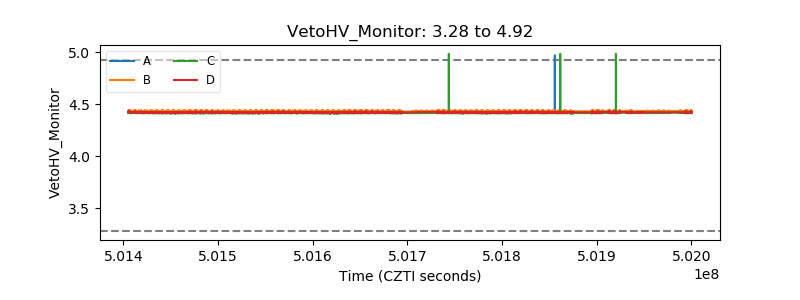 |
| Veto LLD | 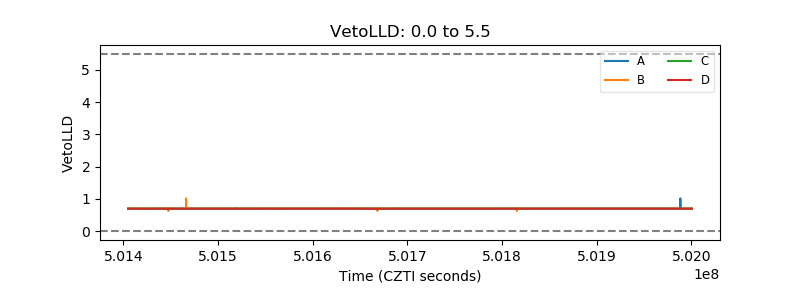 |
| Alpha Counter | 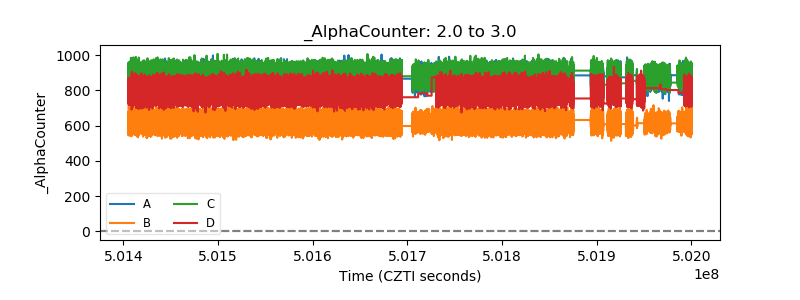 |
| _CPM_Rate | 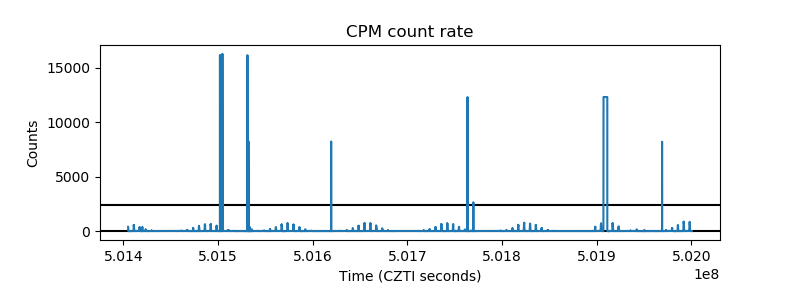 |
| CZT Counter |  |
| +2.5 Volts monitor | 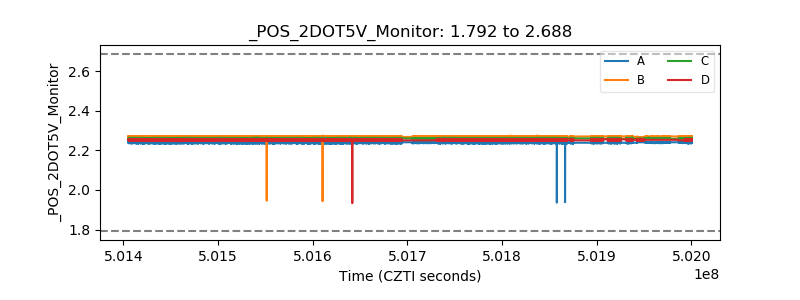 |
| +5 Volts monitor | 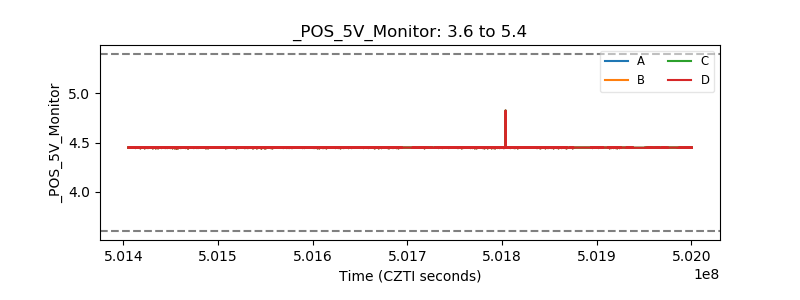 |
| _ROLL_ROT | 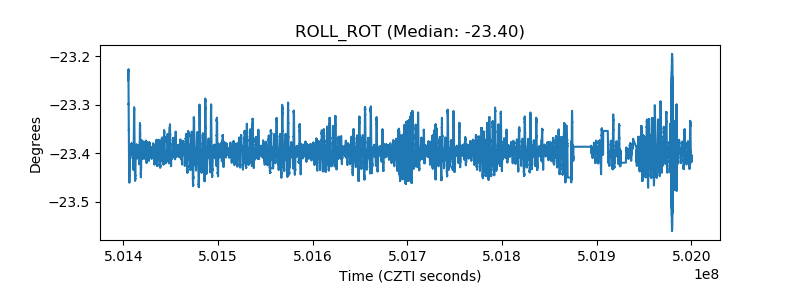 |
| _Roll_DEC | 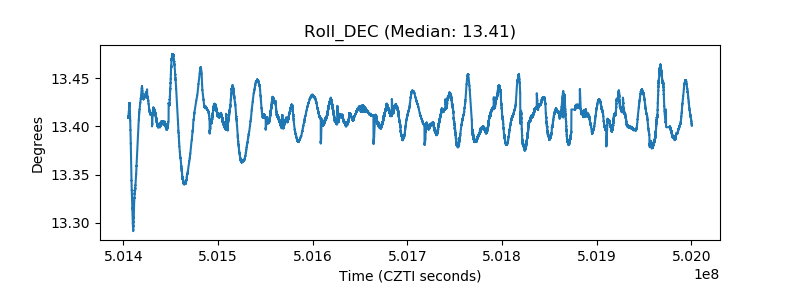 |
| _Roll_RA | 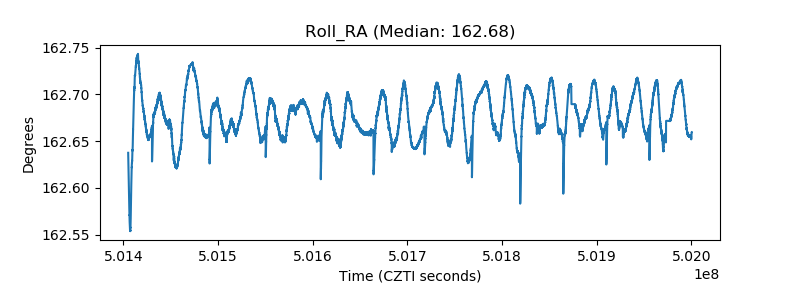 |
| Veto Counter | 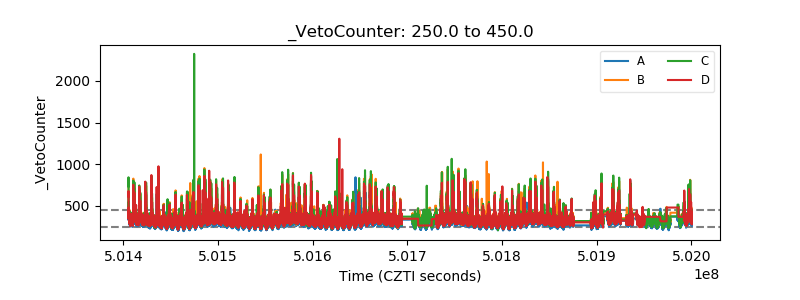 |