| Param | Original file | Final file |
|---|---|---|
| Filename | modeM0/AS1A14_014T01_9000006528_54908cztM0_level2.fits | modeM0/AS1A14_014T01_9000006528_54908cztM0_level2_quad_clean.evt |
| Size (bytes) | 497,099,520 | 94,337,280 |
| Size | 474.1 MB | 90.0 MB |
| Events in quadrant A | 3,437,645 | 637,971 |
| Events in quadrant B | 3,277,860 | 681,583 |
| Events in quadrant C | 6,544,460 | 523,640 |
| Events in quadrant D | 4,635,024 | 559,147 |
| Mode M0 | |||
|---|---|---|---|
| Quadrant | BADHDUFLAG | Total packets | Discarded packets |
| A | 0 | 14782 | 2 |
| B | 0 | 14557 | 2 |
| C | 0 | 23945 | 11 |
| D | 0 | 18309 | 2 |
| Mode SS | |||
|---|---|---|---|
| Quadrant | BADHDUFLAG | Total packets | Discarded packets |
| A | 0 | 132 | 0 |
| B | 0 | 132 | 0 |
| C | 0 | 132 | 0 |
| D | 0 | 132 | 0 |
| Mode M9 | |||
|---|---|---|---|
| Quadrant | BADHDUFLAG | Total packets | Discarded packets |
| A | 0 | 14 | 0 |
| B | 0 | 14 | 0 |
| C | 0 | 15 | 0 |
| D | 0 | 15 | 0 |
| Quadrant | Total seconds | Saturated seconds | Saturation percentage |
|---|---|---|---|
| A | 6514 | 89 | 1.366288% |
| B | 6514 | 210 | 3.223826% |
| C | 6510 | 1145 | 17.588326% |
| D | 6514 | 292 | 4.482653% |
Noise dominated data is calculated using 1-second bins in cleaned event files. If a bin has >2000 counts, and if more than 50% of those come from <1% of pixels, then it is considered to be noise-dominated and hence unusable.
| Quadrant | # 1 sec bins | Bins with >0 counts | Bins with >2000 counts | High rate bins dominated by noise | Noise dominated (total time) | Noise dominated (detector-on time) | Marked lightcurve |
|---|---|---|---|---|---|---|---|
| A | 7619 | 6515 | 15 | 15 | 0.20% | 0.23% | 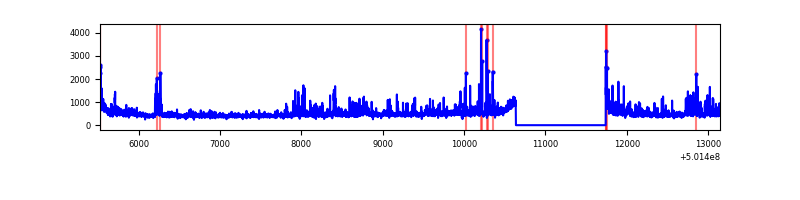 |
| B | 7619 | 6515 | 119 | 119 | 1.56% | 1.83% | 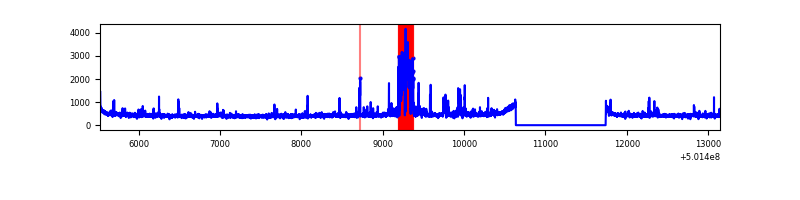 |
| C | 7619 | 6513 | 858 | 858 | 11.26% | 13.17% | 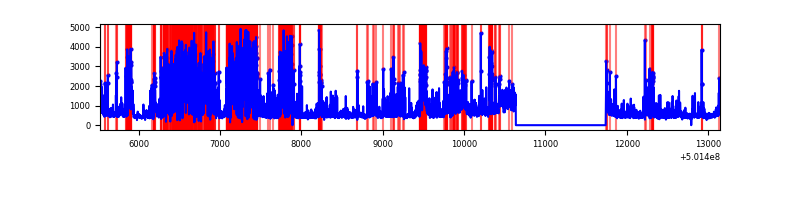 |
| D | 7619 | 6515 | 237 | 237 | 3.11% | 3.64% | 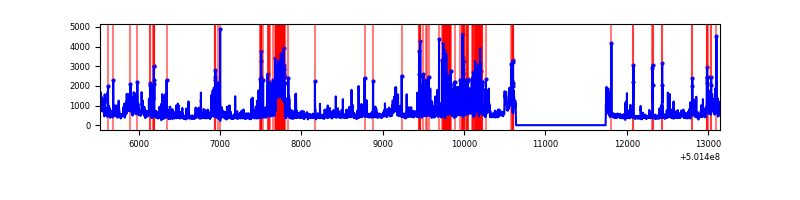 |
Top three noisy pixels from each quadrant. If the there are fewer than three noisy pixels in the level2.evt file, extra rows are filled as -1
| Pixel properties | Quadrant properties | ||||||
|---|---|---|---|---|---|---|---|
| Quadrant | DetID | PixID | Counts | Sigma | Mean | Median | Sigma |
| A | 3 | 14 | 506063 | 2870.86 | 712 | 694 | 176.0 |
| A | 0 | 8 | 89048 | 501.91 | 712 | 694 | 176.0 |
| A | 12 | 115 | 24041 | 132.63 | 712 | 694 | 176.0 |
| B | 5 | 185 | 364379 | 2433.97 | 696 | 669 | 149.4 |
| B | 10 | 247 | 85527 | 567.87 | 696 | 669 | 149.4 |
| B | 5 | 236 | 52270 | 345.32 | 696 | 669 | 149.4 |
| C | 4 | 5 | 2825159 | 16091.87 | 636 | 630 | 175.5 |
| C | 15 | 147 | 299735 | 1704.06 | 636 | 630 | 175.5 |
| C | 9 | 38 | 296171 | 1683.75 | 636 | 630 | 175.5 |
| D | 14 | 52 | 392685 | 2038.11 | 680 | 650 | 192.4 |
| D | 11 | 129 | 318862 | 1654.32 | 680 | 650 | 192.4 |
| D | 15 | 94 | 273310 | 1417.51 | 680 | 650 | 192.4 |
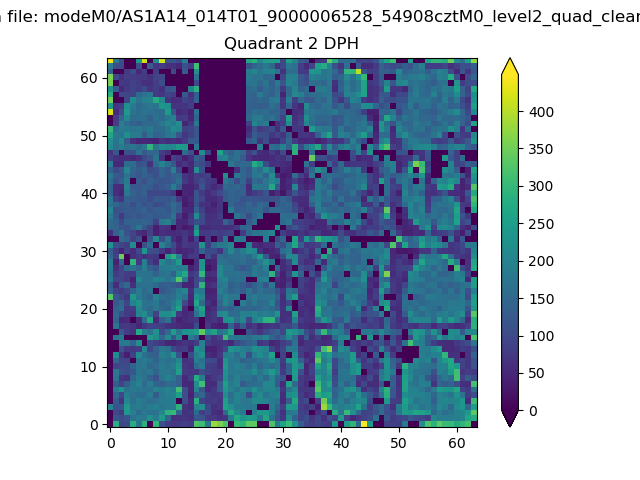
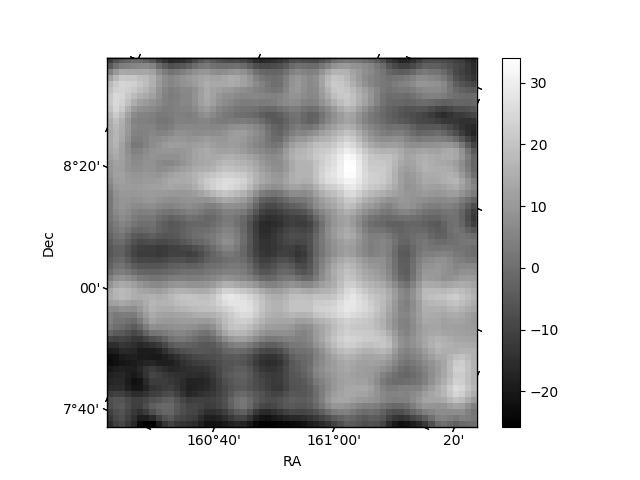
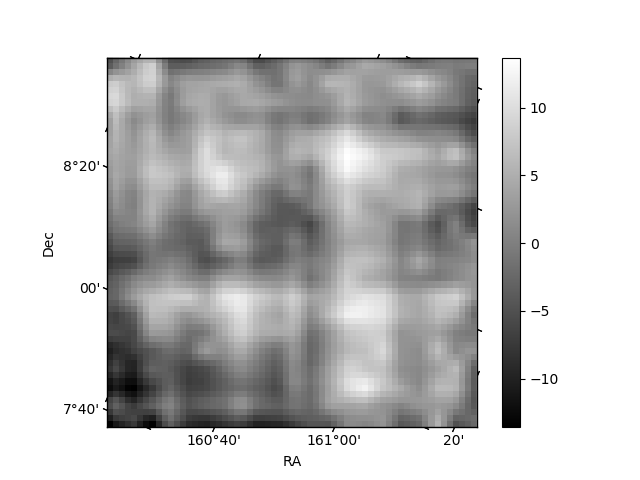
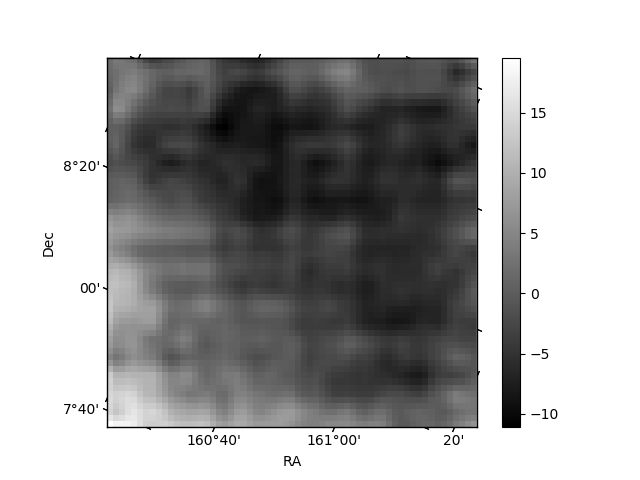
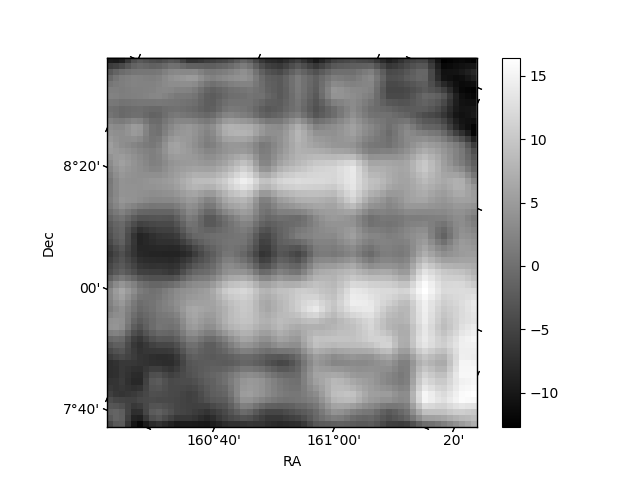
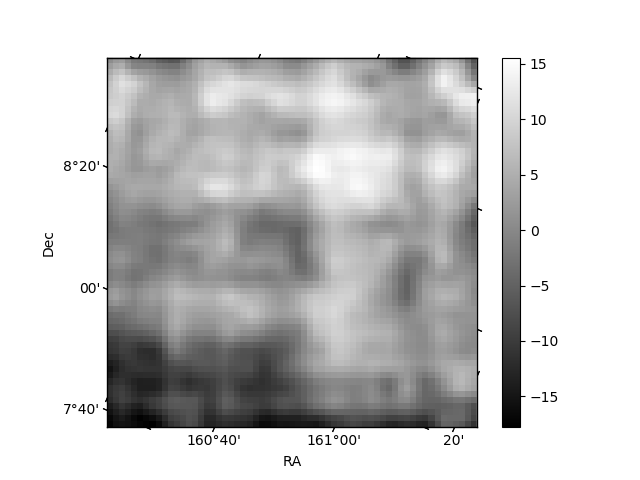
Histogram calculated using DETX and DETY for each event in the final _common_clean file
| Quadrant A | 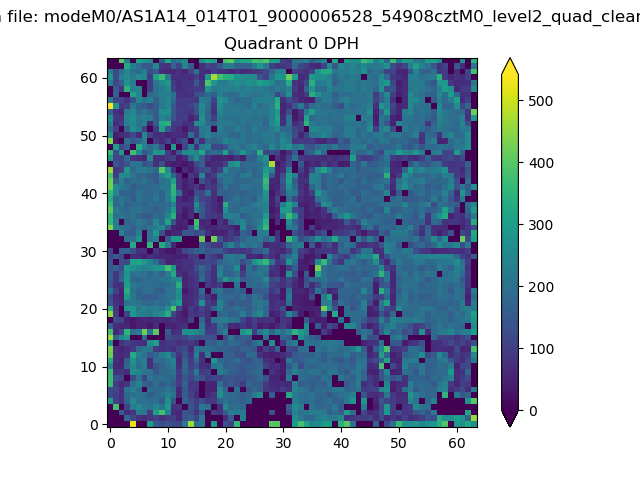 |
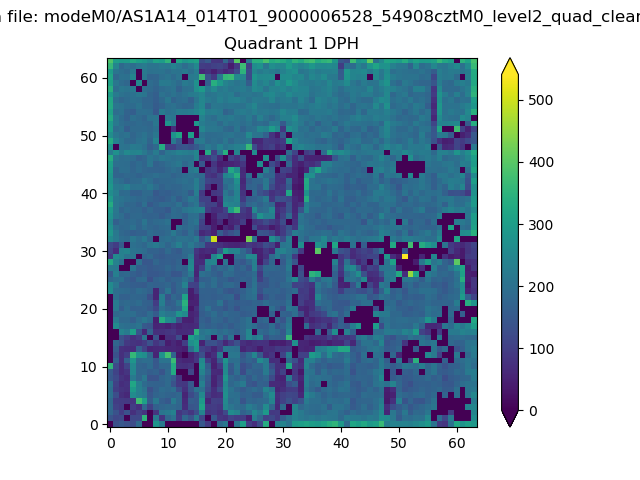 |
Quadrant B |
|---|---|---|---|
| Quadrant D | 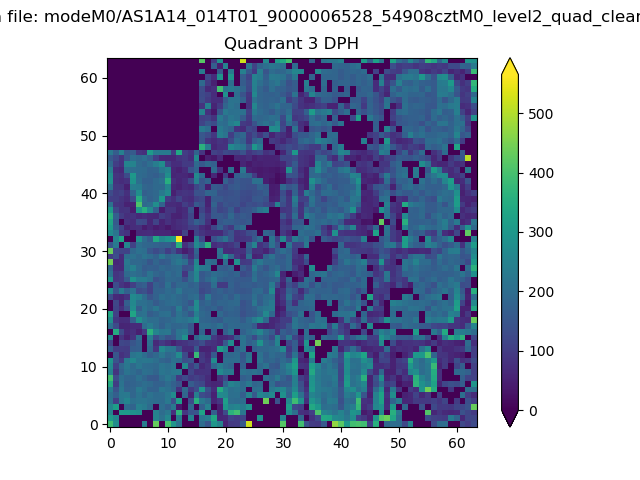 |
 |
Quadrant C |
| Plot type | Count rate plots | Images |
|---|---|---|
| Comparison with Poisson distribution Blue bars denote a histogram of data divided into 1 sec bins. Red curve is a Poisson curve with rate = median count rate of data. |
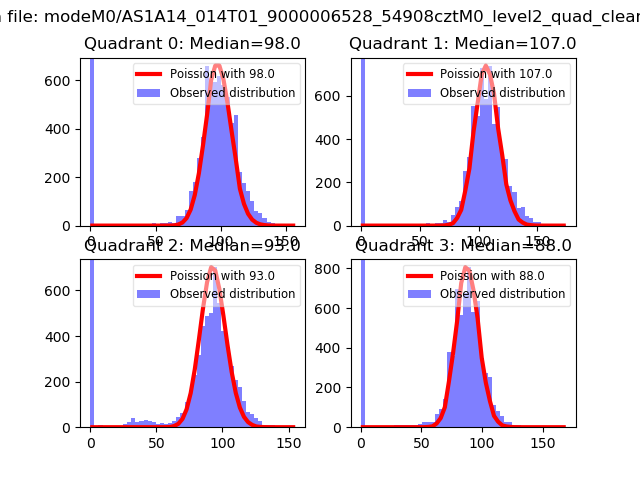 |
 |
| Quadrant-wise count rates Data is divided into 100 sec bins |
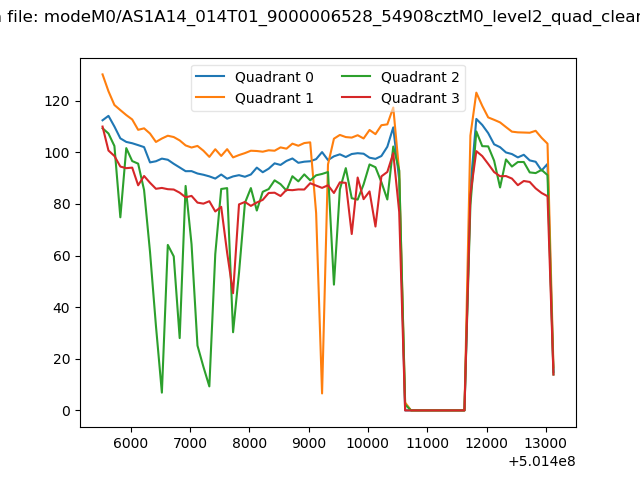 |
|
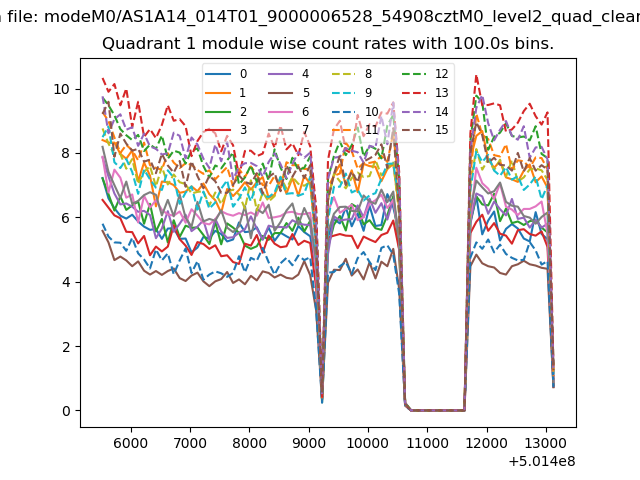
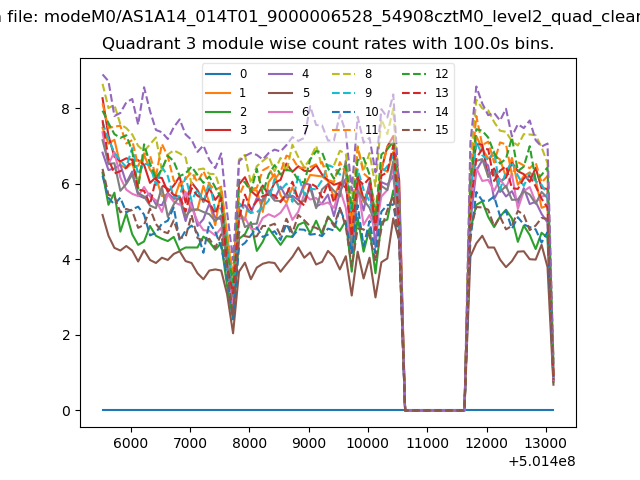
| Module-wise count rates for Quadrant A Data is divided into 100 sec bins |
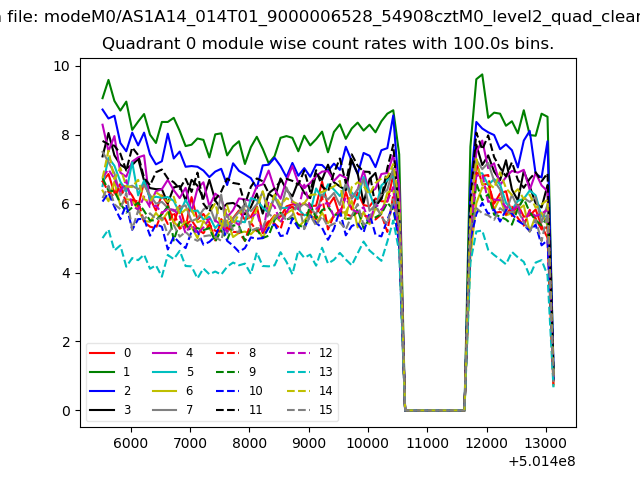 |
 |
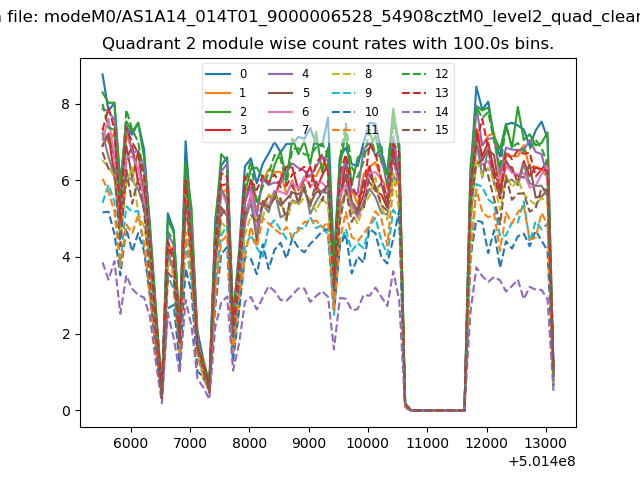
| Module-wise count rates for Quadrant B Data is divided into 100 sec bins |
 |
 |
| Module-wise count rates for Quadrant C Data is divided into 100 sec bins |
 |
 |
| Module-wise count rates for Quadrant D Data is divided into 100 sec bins |
 |
 |
| Parameter | Plot |
|---|---|
| CZT HV Monitor | 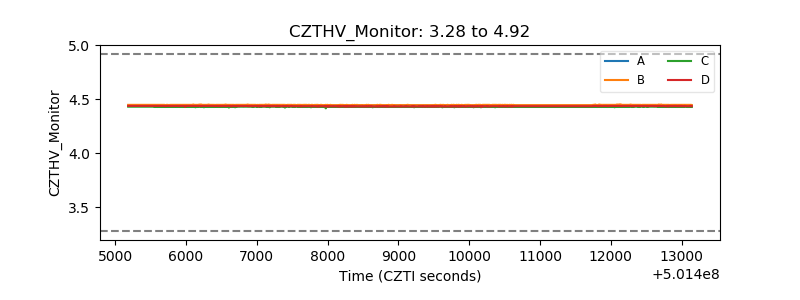 |
| D_VDD |  |
| Temperature 1 | 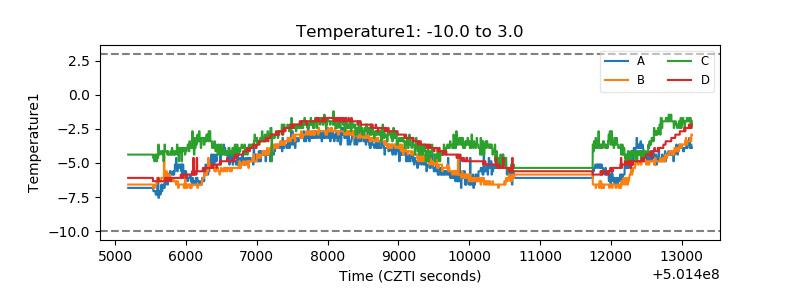 |
| Veto HV Monitor |  |
| Veto LLD | 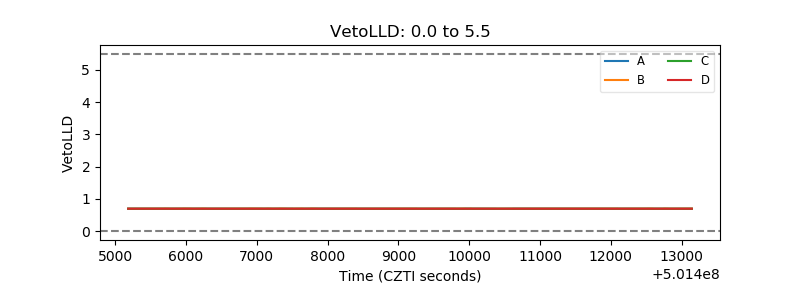 |
| Alpha Counter | 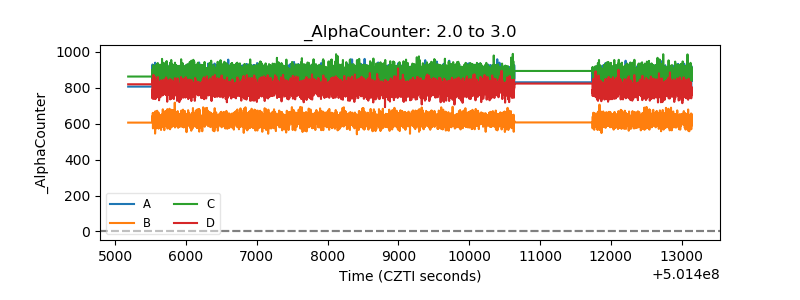 |
| _CPM_Rate | 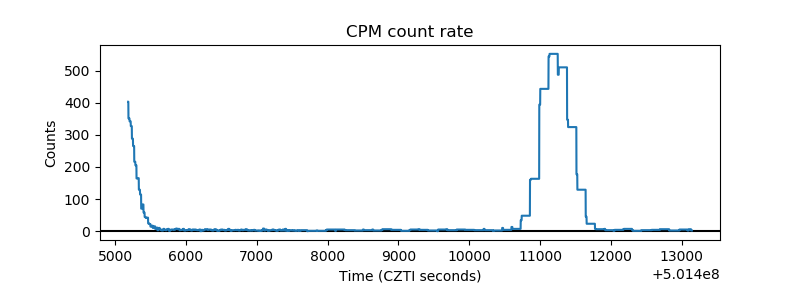 |
| CZT Counter | 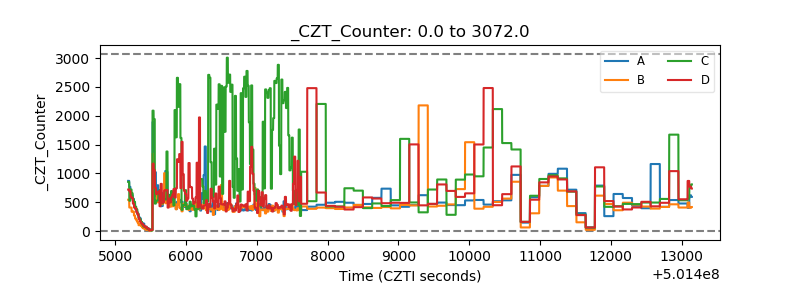 |
| +2.5 Volts monitor |  |
| +5 Volts monitor |  |
| _ROLL_ROT | 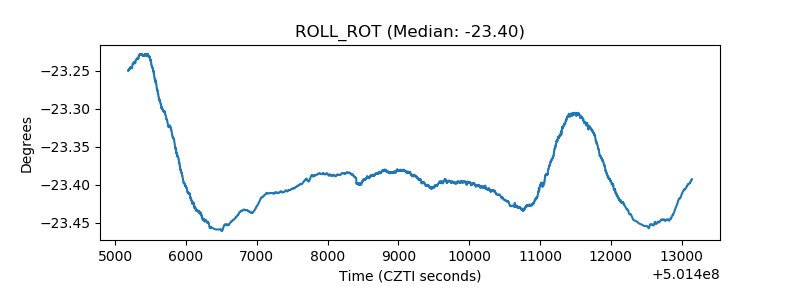 |
| _Roll_DEC | 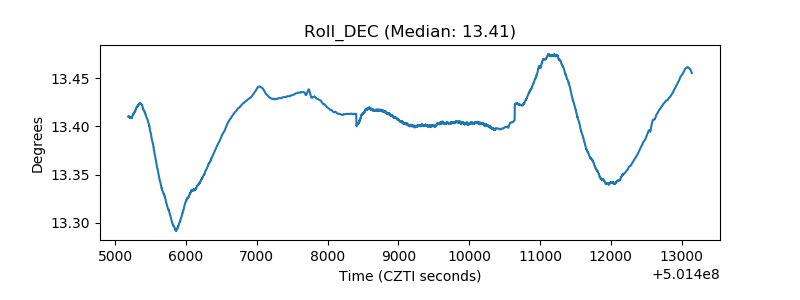 |
| _Roll_RA |  |
| Veto Counter | 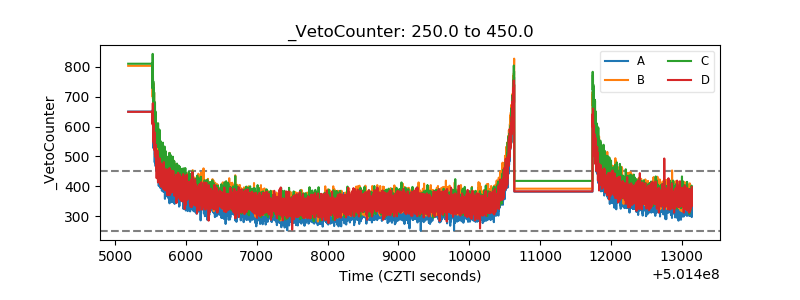 |