| Param | Original file | Final file |
|---|---|---|
| Filename | modeM0/AS1A14_014T01_9000006528_54909cztM0_level2.fits | modeM0/AS1A14_014T01_9000006528_54909cztM0_level2_quad_clean.evt |
| Size (bytes) | 455,644,800 | 94,029,120 |
| Size | 434.5 MB | 89.7 MB |
| Events in quadrant A | 3,652,680 | 619,775 |
| Events in quadrant B | 3,258,221 | 669,404 |
| Events in quadrant C | 5,452,381 | 558,233 |
| Events in quadrant D | 4,005,701 | 553,306 |
| Mode M0 | |||
|---|---|---|---|
| Quadrant | BADHDUFLAG | Total packets | Discarded packets |
| A | 0 | 15162 | 10 |
| B | 0 | 14358 | 2 |
| C | 0 | 20560 | 8 |
| D | 0 | 16296 | 2 |
| Mode SS | |||
|---|---|---|---|
| Quadrant | BADHDUFLAG | Total packets | Discarded packets |
| A | 0 | 130 | 0 |
| B | 0 | 130 | 0 |
| C | 0 | 130 | 0 |
| D | 0 | 130 | 0 |
| Mode M9 | |||
|---|---|---|---|
| Quadrant | BADHDUFLAG | Total packets | Discarded packets |
| A | 0 | 16 | 0 |
| B | 0 | 17 | 0 |
| C | 0 | 17 | 0 |
| D | 0 | 17 | 0 |
| Quadrant | Total seconds | Saturated seconds | Saturation percentage |
|---|---|---|---|
| A | 6400 | 124 | 1.937500% |
| B | 6402 | 162 | 2.530459% |
| C | 6399 | 616 | 9.626504% |
| D | 6401 | 167 | 2.608967% |
Noise dominated data is calculated using 1-second bins in cleaned event files. If a bin has >2000 counts, and if more than 50% of those come from <1% of pixels, then it is considered to be noise-dominated and hence unusable.
| Quadrant | # 1 sec bins | Bins with >0 counts | Bins with >2000 counts | High rate bins dominated by noise | Noise dominated (total time) | Noise dominated (detector-on time) | Marked lightcurve |
|---|---|---|---|---|---|---|---|
| A | 7502 | 6402 | 40 | 40 | 0.53% | 0.62% | 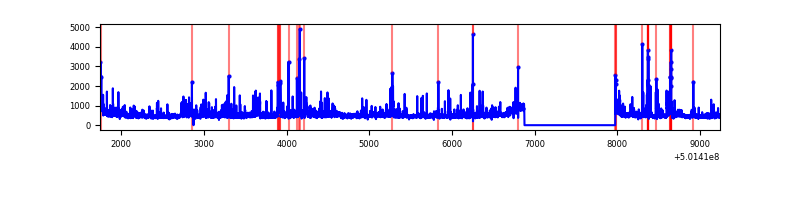 |
| B | 7502 | 6403 | 65 | 65 | 0.87% | 1.02% | 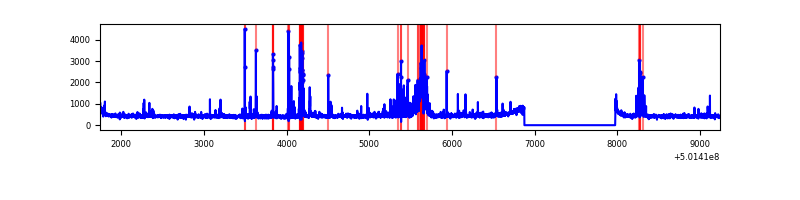 |
| C | 7501 | 6401 | 481 | 481 | 6.41% | 7.51% | 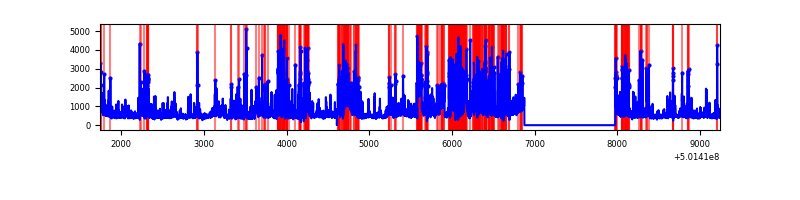 |
| D | 7501 | 6402 | 90 | 90 | 1.20% | 1.41% | 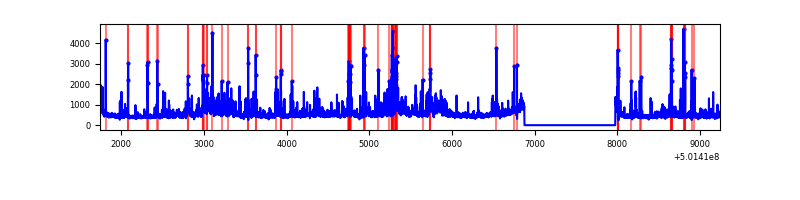 |
Top three noisy pixels from each quadrant. If the there are fewer than three noisy pixels in the level2.evt file, extra rows are filled as -1
| Pixel properties | Quadrant properties | ||||||
|---|---|---|---|---|---|---|---|
| Quadrant | DetID | PixID | Counts | Sigma | Mean | Median | Sigma |
| A | 3 | 14 | 628612 | 3629.15 | 701 | 681 | 173.0 |
| A | 3 | 45 | 119418 | 686.25 | 701 | 681 | 173.0 |
| A | 0 | 8 | 83822 | 480.52 | 701 | 681 | 173.0 |
| B | 5 | 185 | 390731 | 2634.57 | 690 | 665 | 148.1 |
| B | 7 | 252 | 64738 | 432.76 | 690 | 665 | 148.1 |
| B | 5 | 236 | 18061 | 117.49 | 690 | 665 | 148.1 |
| C | 4 | 5 | 1686710 | 9365.34 | 657 | 649 | 180.0 |
| C | 9 | 38 | 412701 | 2288.77 | 657 | 649 | 180.0 |
| C | 13 | 3 | 255153 | 1413.66 | 657 | 649 | 180.0 |
| D | 11 | 129 | 362732 | 1879.8 | 679 | 650 | 192.6 |
| D | 15 | 94 | 156523 | 809.24 | 679 | 650 | 192.6 |
| D | 6 | 42 | 144787 | 748.31 | 679 | 650 | 192.6 |
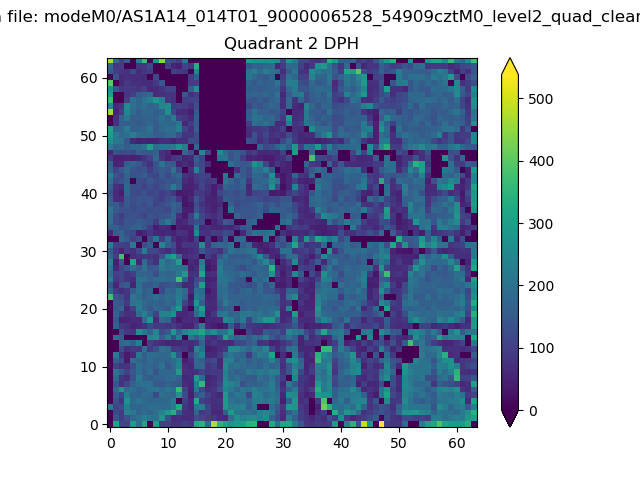
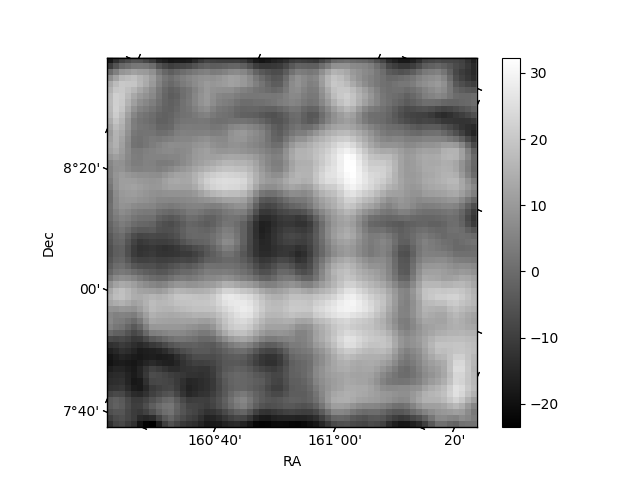
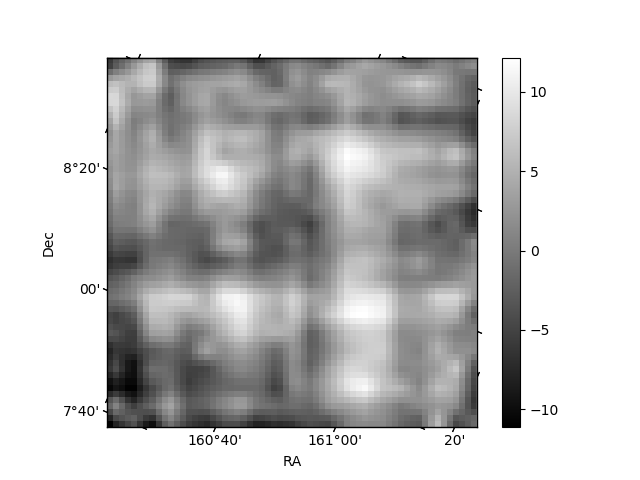
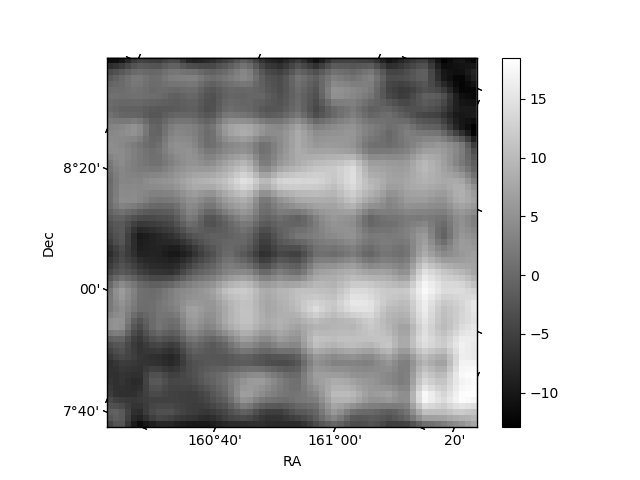
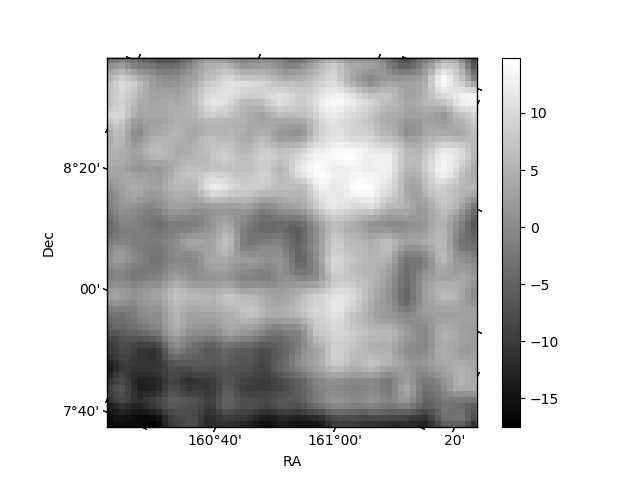
Histogram calculated using DETX and DETY for each event in the final _common_clean file
| Quadrant A | 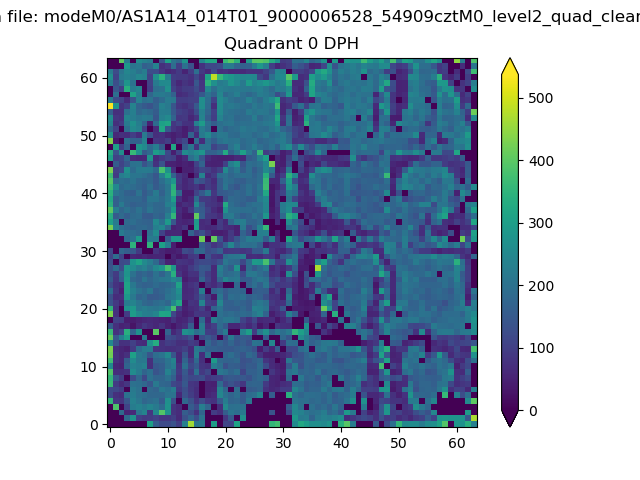 |
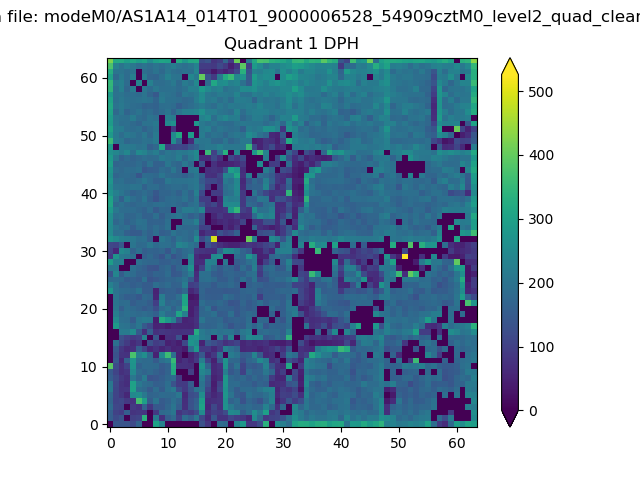 |
Quadrant B |
|---|---|---|---|
| Quadrant D | 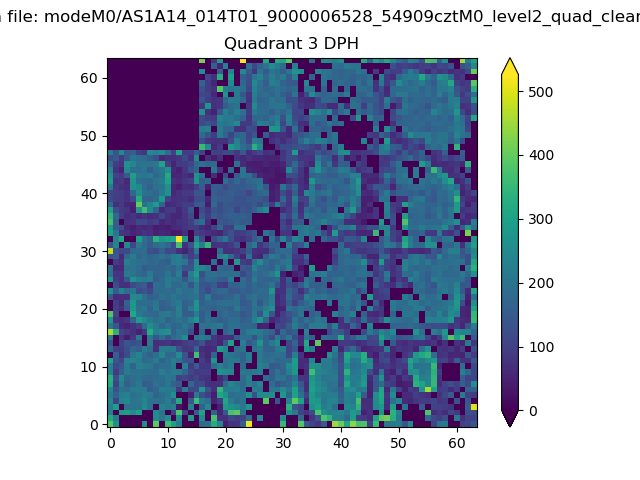 |
 |
Quadrant C |
| Plot type | Count rate plots | Images |
|---|---|---|
| Comparison with Poisson distribution Blue bars denote a histogram of data divided into 1 sec bins. Red curve is a Poisson curve with rate = median count rate of data. |
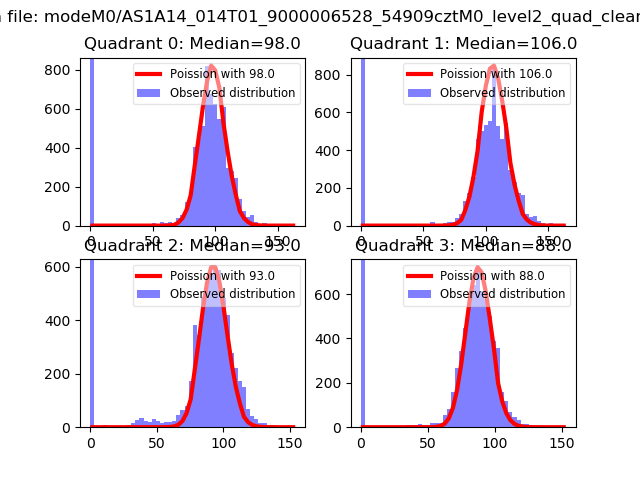 |
 |
| Quadrant-wise count rates Data is divided into 100 sec bins |
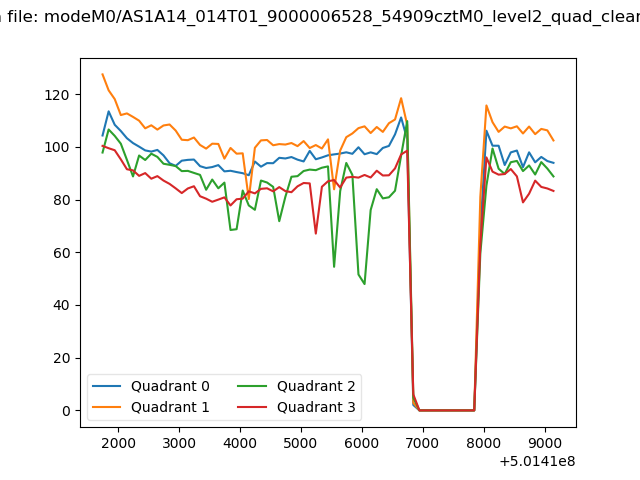 |
|
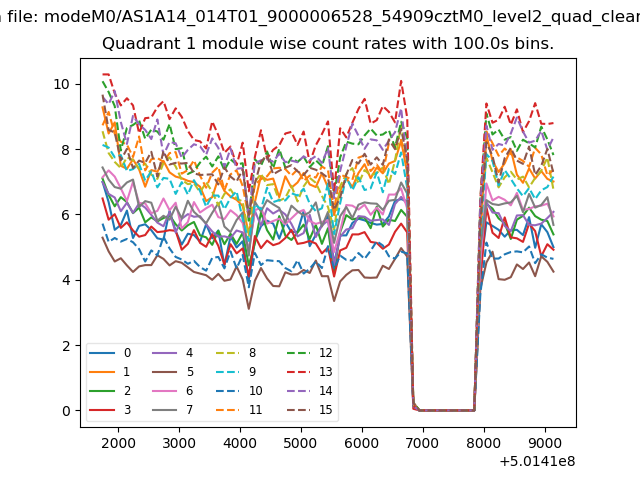
| Module-wise count rates for Quadrant A Data is divided into 100 sec bins |
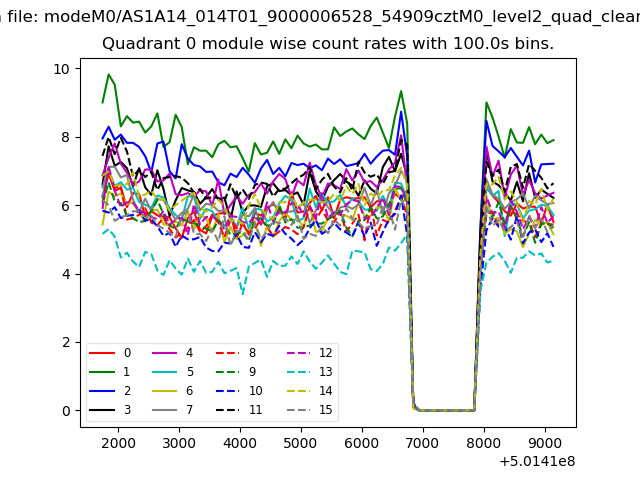 |
 |
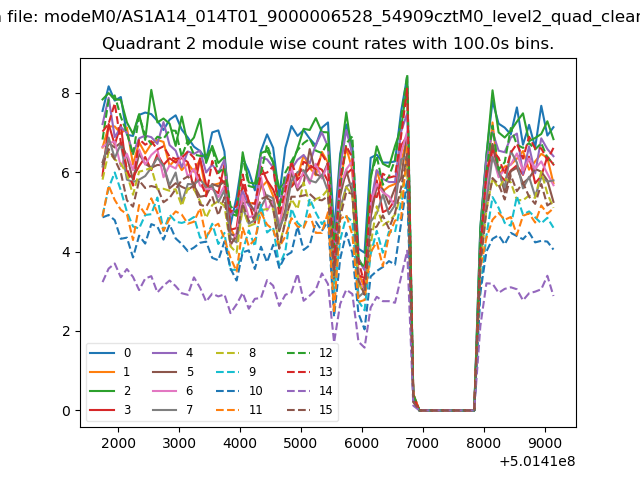
| Module-wise count rates for Quadrant B Data is divided into 100 sec bins |
 |
 |
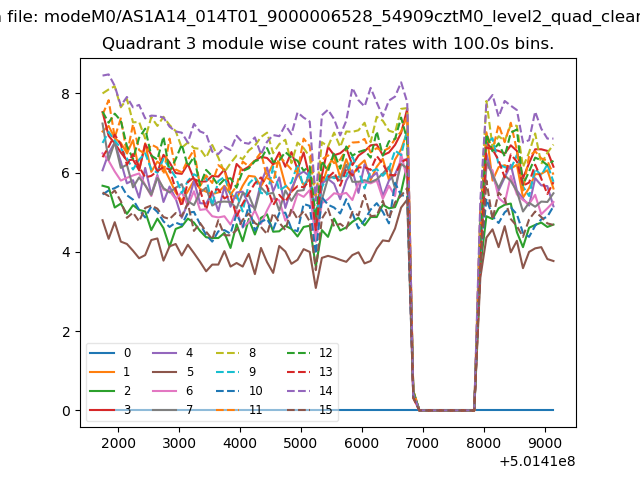
| Module-wise count rates for Quadrant C Data is divided into 100 sec bins |
 |
 |
| Module-wise count rates for Quadrant D Data is divided into 100 sec bins |
 |
 |
| Parameter | Plot |
|---|---|
| CZT HV Monitor | 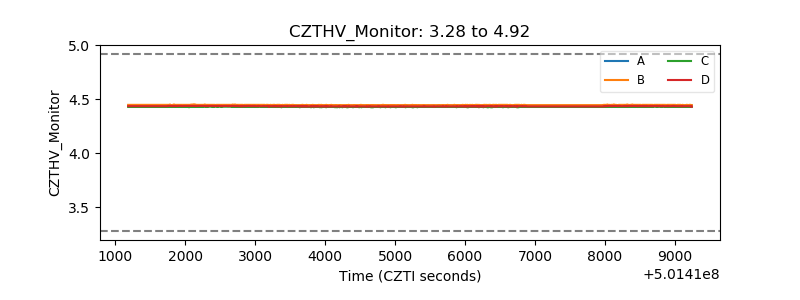 |
| D_VDD |  |
| Temperature 1 |  |
| Veto HV Monitor | 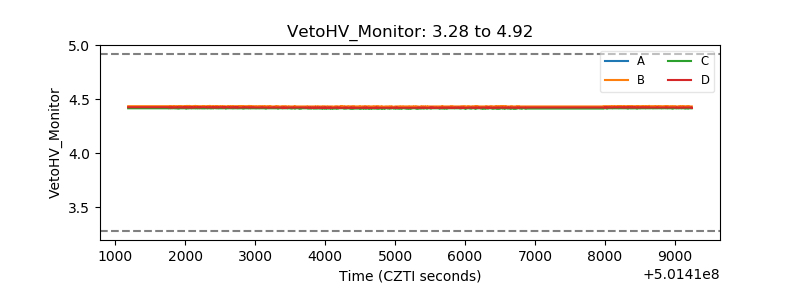 |
| Veto LLD | 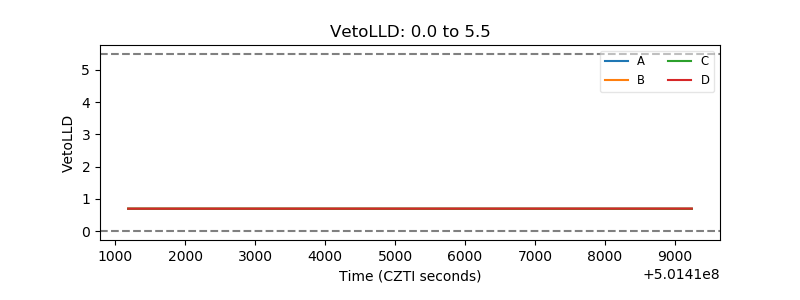 |
| Alpha Counter | 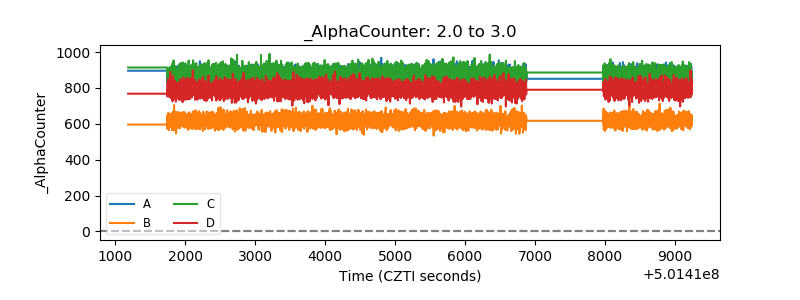 |
| _CPM_Rate | 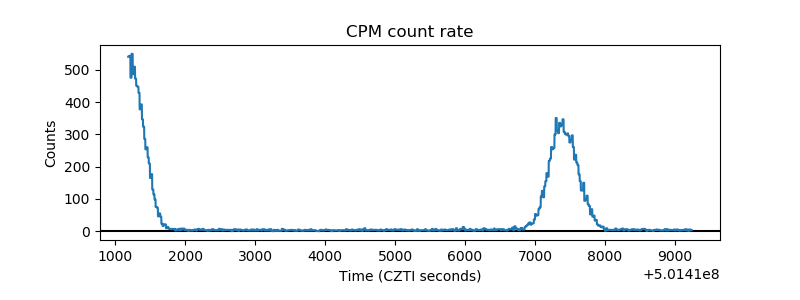 |
| CZT Counter | 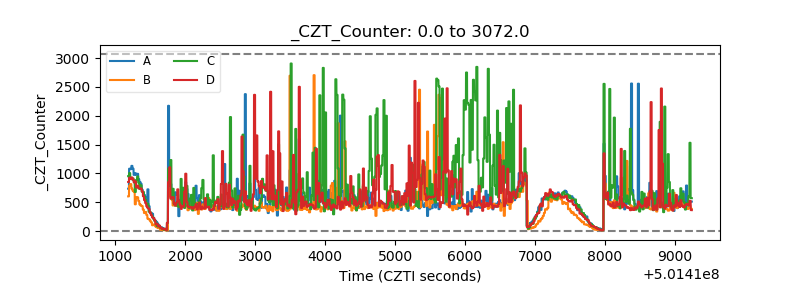 |
| +2.5 Volts monitor |  |
| +5 Volts monitor |  |
| _ROLL_ROT | 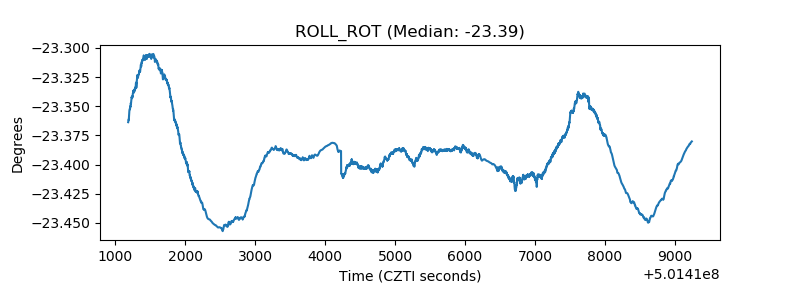 |
| _Roll_DEC |  |
| _Roll_RA | 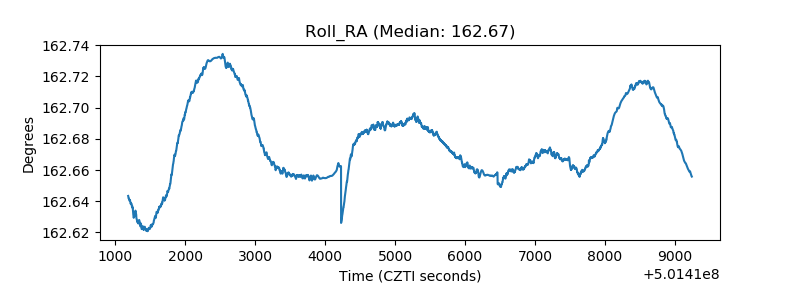 |
| Veto Counter | 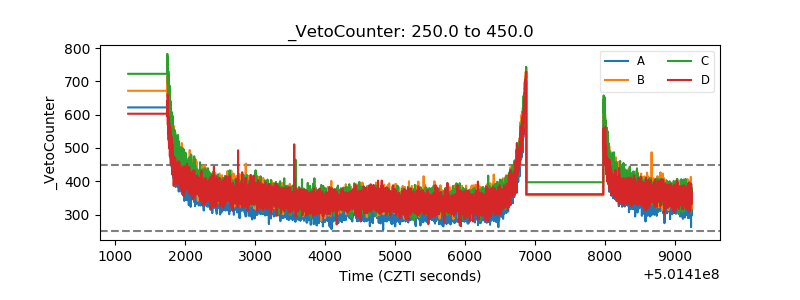 |