| Param | Original file | Final file |
|---|---|---|
| Filename | modeM0/AS1A14_014T01_9000006528_54910cztM0_level2.fits | modeM0/AS1A14_014T01_9000006528_54910cztM0_level2_quad_clean.evt |
| Size (bytes) | 448,185,600 | 95,425,920 |
| Size | 427.4 MB | 91.0 MB |
| Events in quadrant A | 3,604,393 | 618,548 |
| Events in quadrant B | 3,476,116 | 676,010 |
| Events in quadrant C | 4,431,949 | 587,604 |
| Events in quadrant D | 4,566,915 | 548,637 |
| Mode M0 | |||
|---|---|---|---|
| Quadrant | BADHDUFLAG | Total packets | Discarded packets |
| A | 0 | 15322 | 2 |
| B | 0 | 14900 | 2 |
| C | 0 | 17647 | 2 |
| D | 0 | 18014 | 2 |
| Mode SS | |||
|---|---|---|---|
| Quadrant | BADHDUFLAG | Total packets | Discarded packets |
| A | 0 | 136 | 0 |
| B | 0 | 136 | 0 |
| C | 0 | 136 | 0 |
| D | 0 | 136 | 0 |
| Mode M9 | |||
|---|---|---|---|
| Quadrant | BADHDUFLAG | Total packets | Discarded packets |
| A | 0 | 14 | 0 |
| B | 0 | 15 | 0 |
| C | 0 | 15 | 0 |
| D | 0 | 15 | 0 |
| Quadrant | Total seconds | Saturated seconds | Saturation percentage |
|---|---|---|---|
| A | 6577 | 194 | 2.949673% |
| B | 6577 | 112 | 1.702904% |
| C | 6577 | 286 | 4.348487% |
| D | 6577 | 289 | 4.394101% |
Noise dominated data is calculated using 1-second bins in cleaned event files. If a bin has >2000 counts, and if more than 50% of those come from <1% of pixels, then it is considered to be noise-dominated and hence unusable.
| Quadrant | # 1 sec bins | Bins with >0 counts | Bins with >2000 counts | High rate bins dominated by noise | Noise dominated (total time) | Noise dominated (detector-on time) | Marked lightcurve |
|---|---|---|---|---|---|---|---|
| A | 7527 | 6579 | 73 | 73 | 0.97% | 1.11% | 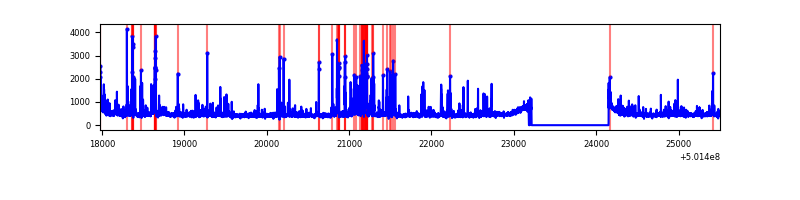 |
| B | 7527 | 6578 | 12 | 12 | 0.16% | 0.18% | 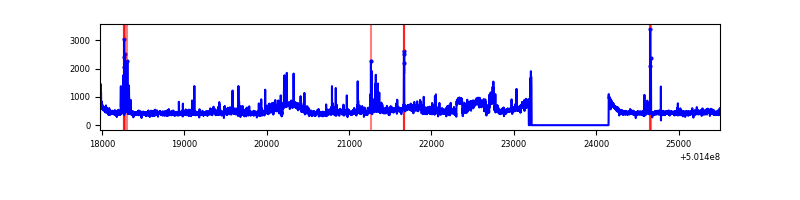 |
| C | 7527 | 6579 | 188 | 188 | 2.50% | 2.86% | 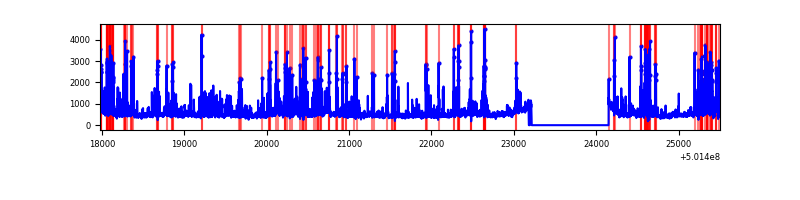 |
| D | 7527 | 6579 | 197 | 197 | 2.62% | 2.99% | 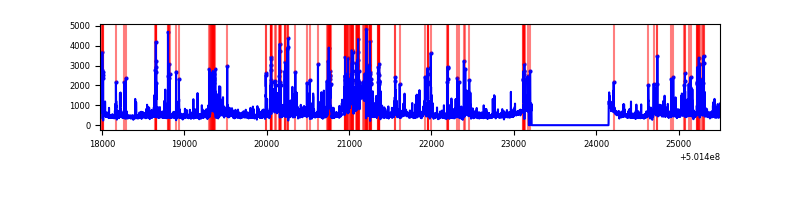 |
Top three noisy pixels from each quadrant. If the there are fewer than three noisy pixels in the level2.evt file, extra rows are filled as -1
| Pixel properties | Quadrant properties | ||||||
|---|---|---|---|---|---|---|---|
| Quadrant | DetID | PixID | Counts | Sigma | Mean | Median | Sigma |
| A | 0 | 8 | 345572 | 1926.23 | 719 | 700 | 179.0 |
| A | 3 | 14 | 199348 | 1109.52 | 719 | 700 | 179.0 |
| A | 3 | 45 | 163646 | 910.11 | 719 | 700 | 179.0 |
| B | 5 | 236 | 415783 | 2725.05 | 706 | 682 | 152.3 |
| B | 5 | 185 | 121632 | 794.01 | 706 | 682 | 152.3 |
| B | 4 | 216 | 33462 | 215.19 | 706 | 682 | 152.3 |
| C | 4 | 5 | 506360 | 2661.1 | 691 | 687 | 190.0 |
| C | 9 | 38 | 350477 | 1840.77 | 691 | 687 | 190.0 |
| C | 13 | 3 | 264987 | 1390.88 | 691 | 687 | 190.0 |
| D | 11 | 129 | 478060 | 2440.34 | 692 | 665 | 195.6 |
| D | 2 | 172 | 268041 | 1366.77 | 692 | 665 | 195.6 |
| D | 10 | 181 | 266809 | 1360.47 | 692 | 665 | 195.6 |
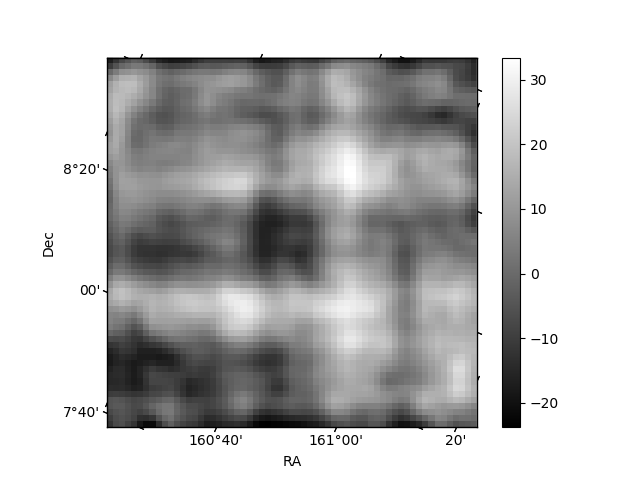
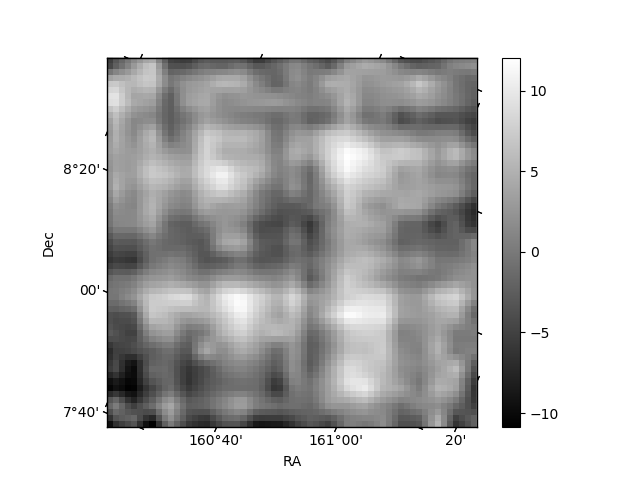
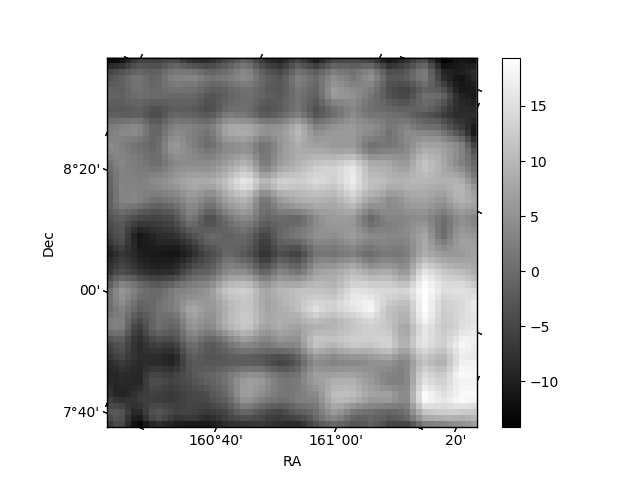
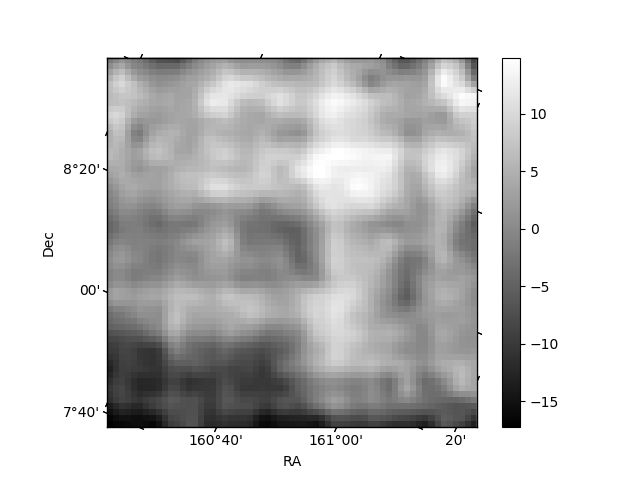
Histogram calculated using DETX and DETY for each event in the final _common_clean file
| Quadrant A | 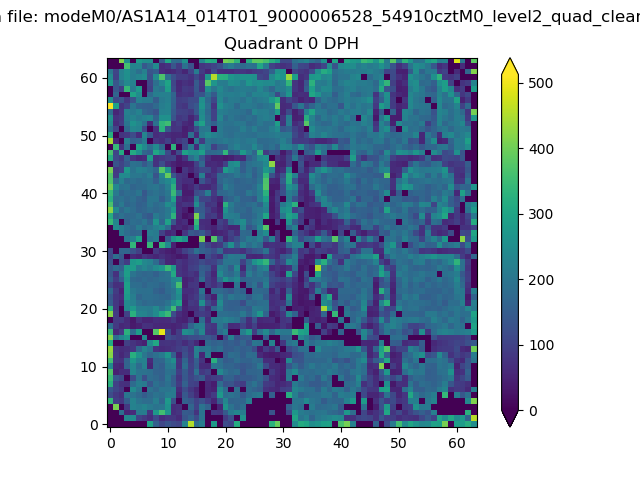 |
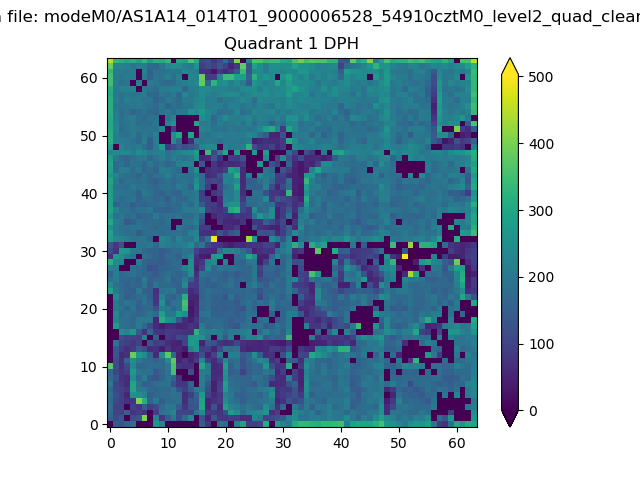 |
Quadrant B |
|---|---|---|---|
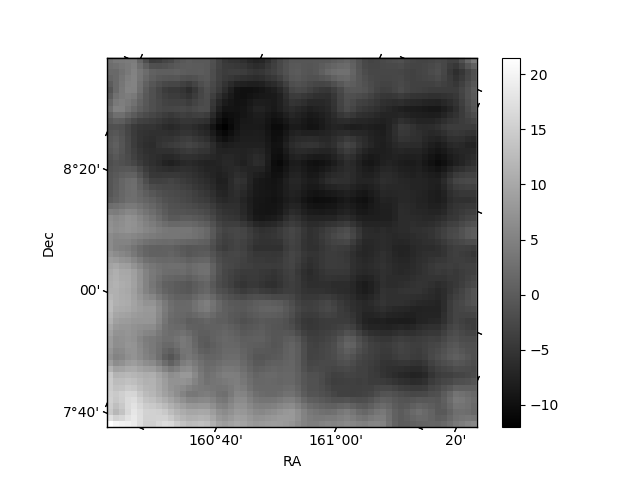
| Quadrant D | 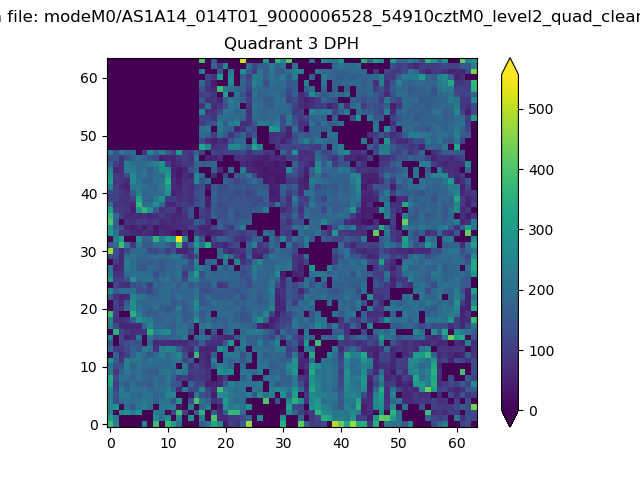 |
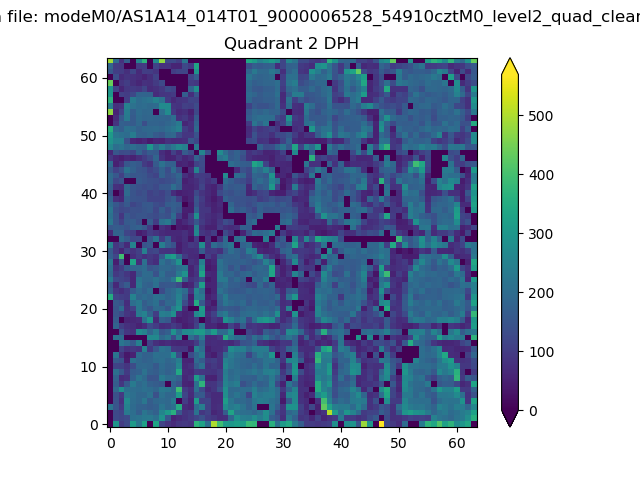 |
Quadrant C |
| Plot type | Count rate plots | Images |
|---|---|---|
| Comparison with Poisson distribution Blue bars denote a histogram of data divided into 1 sec bins. Red curve is a Poisson curve with rate = median count rate of data. |
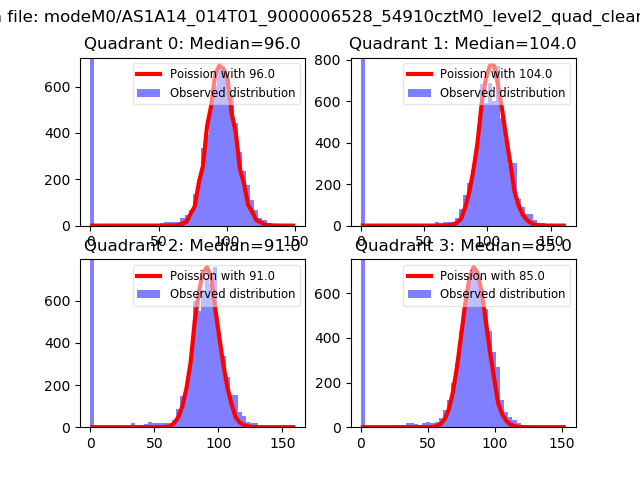 |
 |
| Quadrant-wise count rates Data is divided into 100 sec bins |
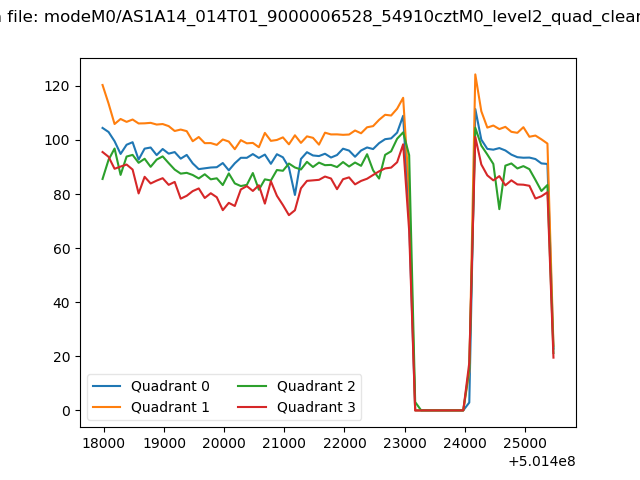 |
|
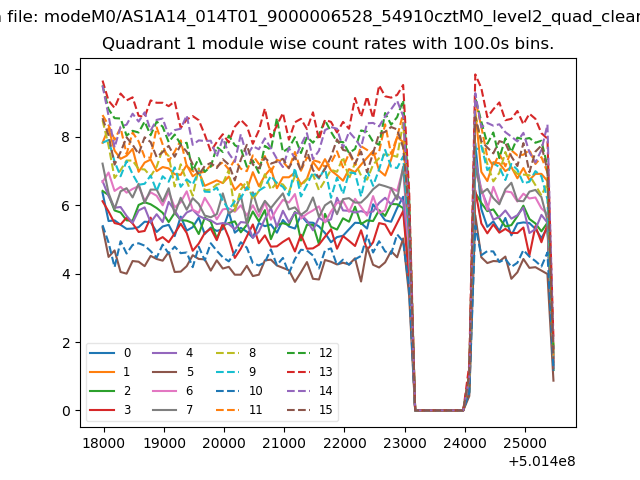
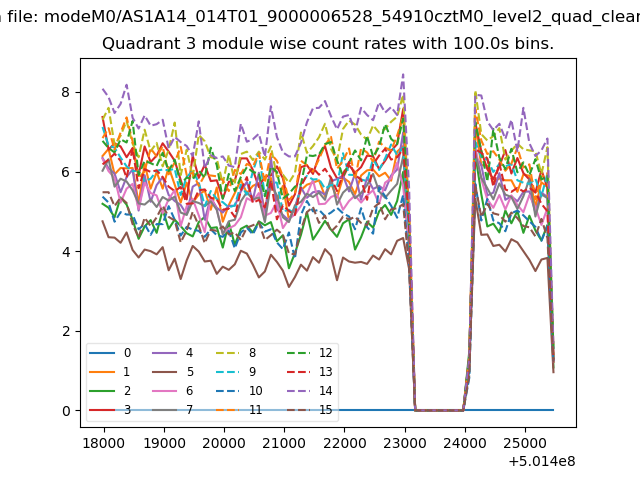
| Module-wise count rates for Quadrant A Data is divided into 100 sec bins |
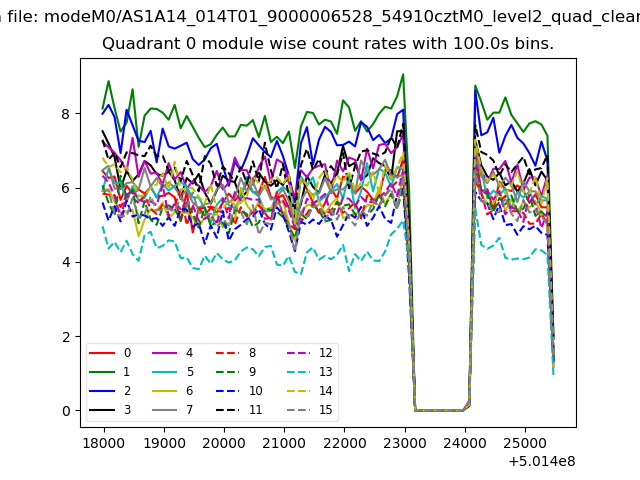 |
 |
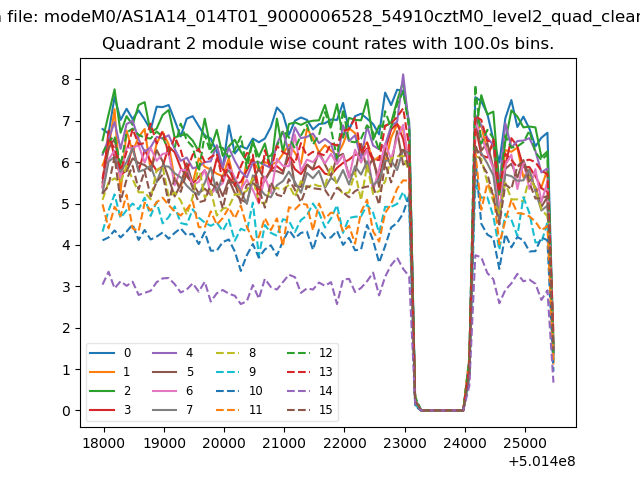
| Module-wise count rates for Quadrant B Data is divided into 100 sec bins |
 |
 |
| Module-wise count rates for Quadrant C Data is divided into 100 sec bins |
 |
 |
| Module-wise count rates for Quadrant D Data is divided into 100 sec bins |
 |
 |
| Parameter | Plot |
|---|---|
| CZT HV Monitor | 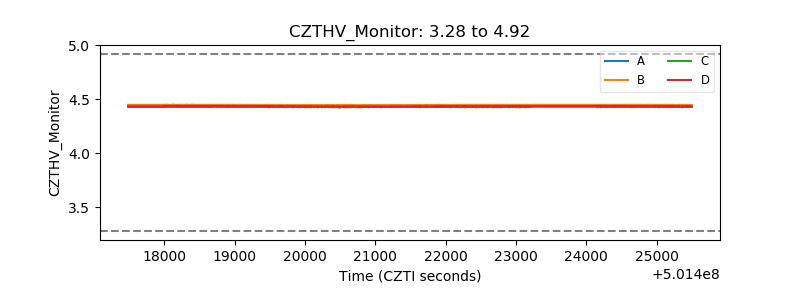 |
| D_VDD |  |
| Temperature 1 | 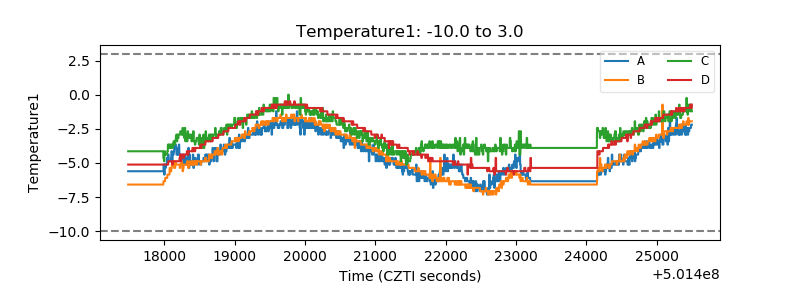 |
| Veto HV Monitor |  |
| Veto LLD |  |
| Alpha Counter | 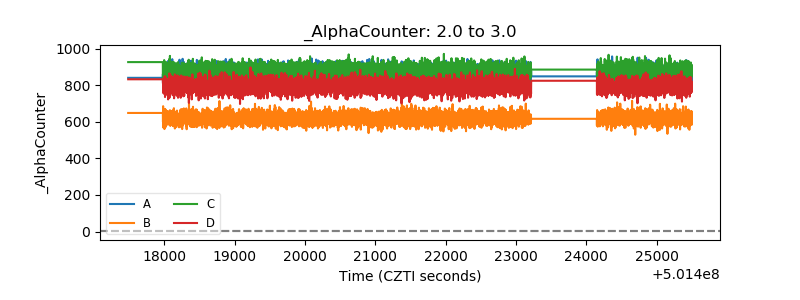 |
| _CPM_Rate | 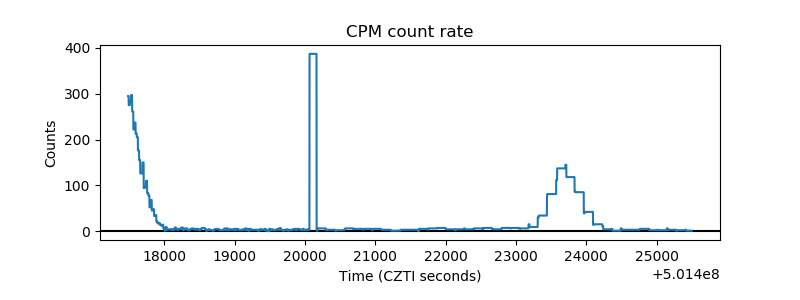 |
| CZT Counter | 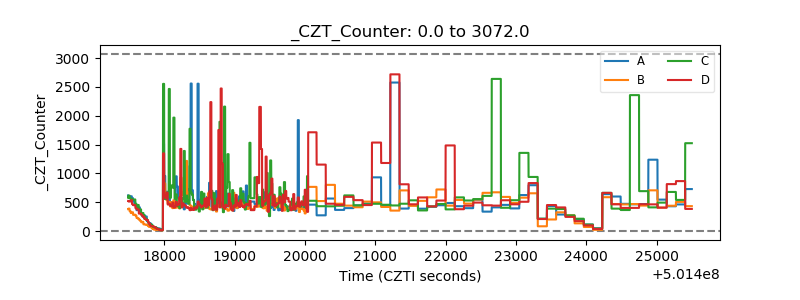 |
| +2.5 Volts monitor |  |
| +5 Volts monitor |  |
| _ROLL_ROT | 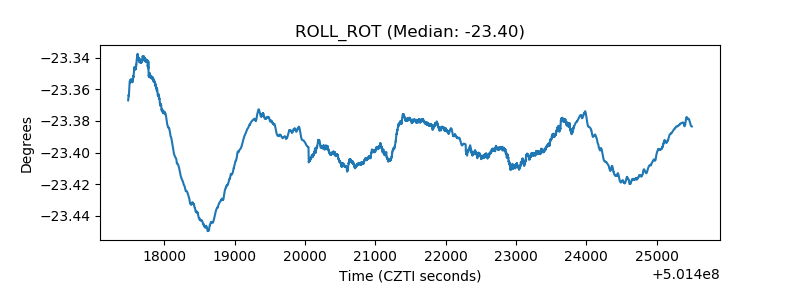 |
| _Roll_DEC | 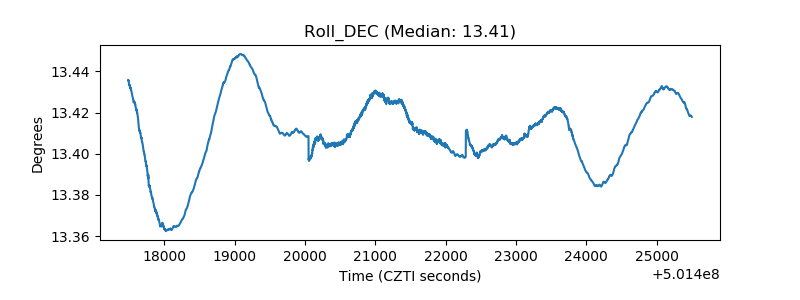 |
| _Roll_RA | 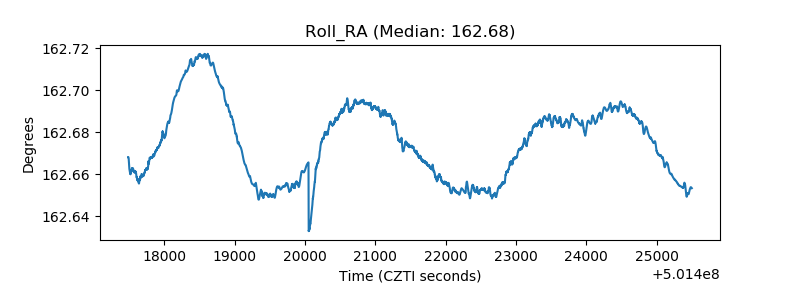 |
| Veto Counter | 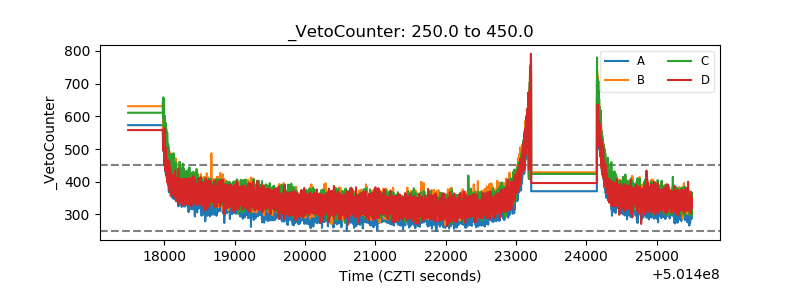 |