| Param | Original file | Final file |
|---|---|---|
| Filename | modeM0/AS1A14_014T01_9000006528_54912cztM0_level2.fits | modeM0/AS1A14_014T01_9000006528_54912cztM0_level2_quad_clean.evt |
| Size (bytes) | 569,226,240 | 99,434,880 |
| Size | 542.9 MB | 94.8 MB |
| Events in quadrant A | 5,689,165 | 638,379 |
| Events in quadrant B | 3,756,647 | 709,757 |
| Events in quadrant C | 4,202,374 | 633,161 |
| Events in quadrant D | 6,854,995 | 519,533 |
| Mode M0 | |||
|---|---|---|---|
| Quadrant | BADHDUFLAG | Total packets | Discarded packets |
| A | 0 | 22355 | 369 |
| B | 0 | 16375 | 308 |
| C | 0 | 18176 | 345 |
| D | 0 | 26473 | 1096 |
| Mode SS | |||
|---|---|---|---|
| Quadrant | BADHDUFLAG | Total packets | Discarded packets |
| A | 0 | 154 | 0 |
| B | 0 | 154 | 4 |
| C | 0 | 154 | 0 |
| D | 0 | 154 | 6 |
| Quadrant | Total seconds | Saturated seconds | Saturation percentage |
|---|---|---|---|
| A | 7317 | 574 | 7.844745% |
| B | 7339 | 349 | 4.755416% |
| C | 7333 | 328 | 4.472931% |
| D | 7243 | 1153 | 15.918818% |
Noise dominated data is calculated using 1-second bins in cleaned event files. If a bin has >2000 counts, and if more than 50% of those come from <1% of pixels, then it is considered to be noise-dominated and hence unusable.
| Quadrant | # 1 sec bins | Bins with >0 counts | Bins with >2000 counts | High rate bins dominated by noise | Noise dominated (total time) | Noise dominated (detector-on time) | Marked lightcurve |
|---|---|---|---|---|---|---|---|
| A | 7719 | 7397 | 176 | 176 | 2.28% | 2.38% | 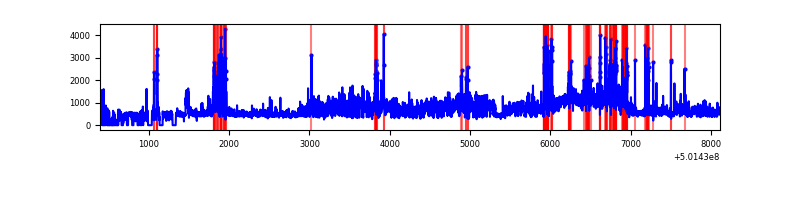 |
| B | 7716 | 7419 | 21 | 21 | 0.27% | 0.28% | 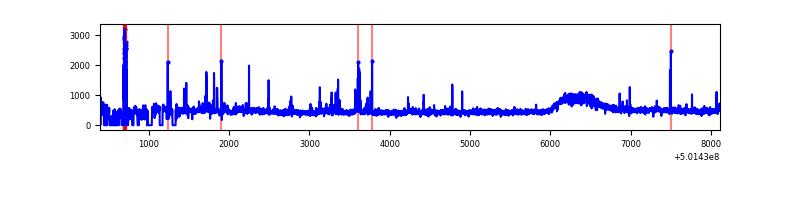 |
| C | 7717 | 7416 | 90 | 90 | 1.17% | 1.21% | 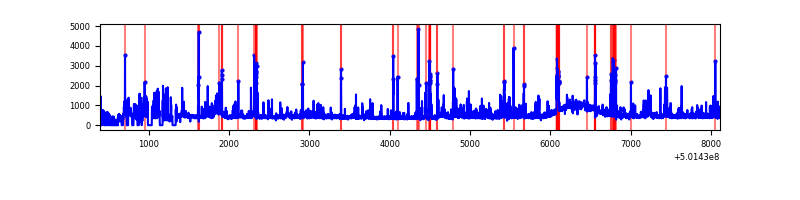 |
| D | 7719 | 7346 | 720 | 720 | 9.33% | 9.80% | 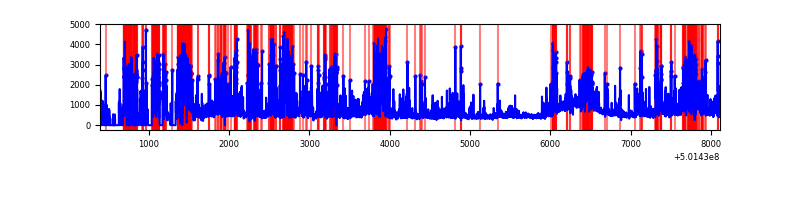 |
Top three noisy pixels from each quadrant. If the there are fewer than three noisy pixels in the level2.evt file, extra rows are filled as -1
| Pixel properties | Quadrant properties | ||||||
|---|---|---|---|---|---|---|---|
| Quadrant | DetID | PixID | Counts | Sigma | Mean | Median | Sigma |
| A | 3 | 14 | 1589776 | 7922.12 | 809 | 785 | 200.6 |
| A | 0 | 8 | 619780 | 3086.08 | 809 | 785 | 200.6 |
| A | 0 | 250 | 163442 | 810.95 | 809 | 785 | 200.6 |
| B | 5 | 236 | 336151 | 1879.56 | 820 | 787 | 178.4 |
| B | 5 | 185 | 74885 | 415.28 | 820 | 787 | 178.4 |
| B | 7 | 252 | 43523 | 239.52 | 820 | 787 | 178.4 |
| C | 4 | 5 | 354837 | 1598.86 | 814 | 807 | 221.4 |
| C | 9 | 38 | 212071 | 954.1 | 814 | 807 | 221.4 |
| C | 12 | 252 | 105551 | 473.04 | 814 | 807 | 221.4 |
| D | 3 | 12 | 921011 | 4312.7 | 757 | 727 | 213.4 |
| D | 15 | 94 | 843608 | 3949.97 | 757 | 727 | 213.4 |
| D | 14 | 52 | 686579 | 3214.09 | 757 | 727 | 213.4 |
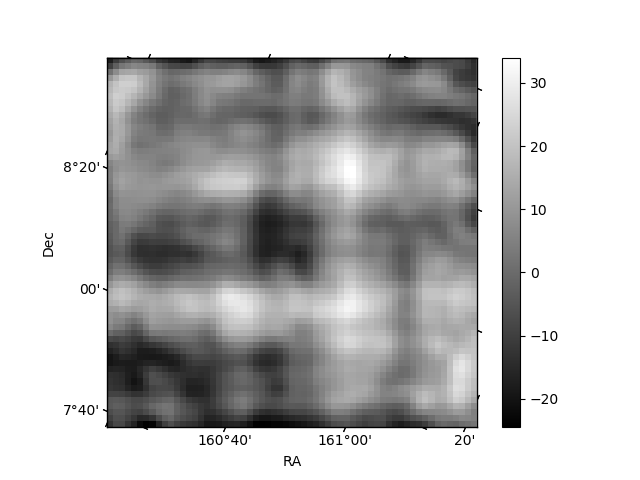
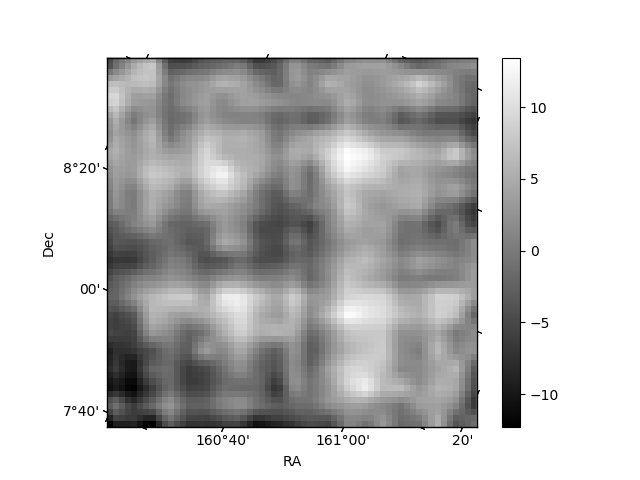
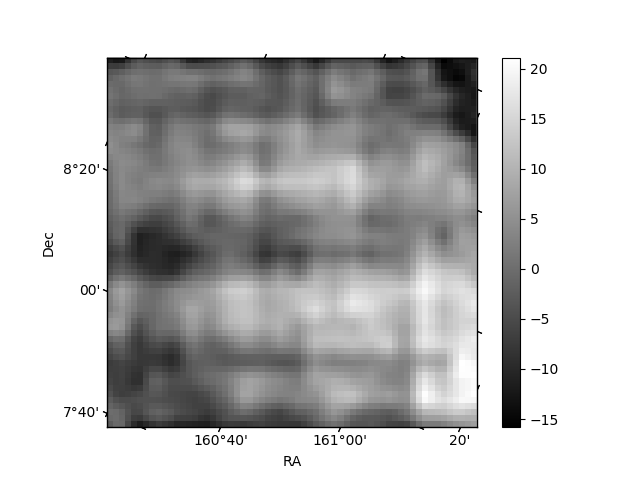
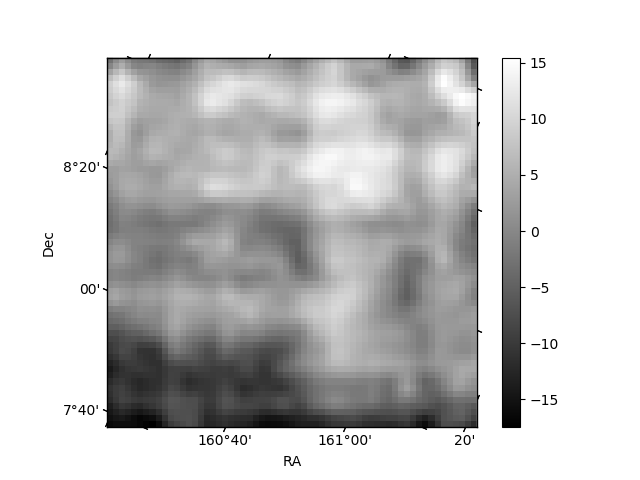
Histogram calculated using DETX and DETY for each event in the final _common_clean file
| Quadrant A | 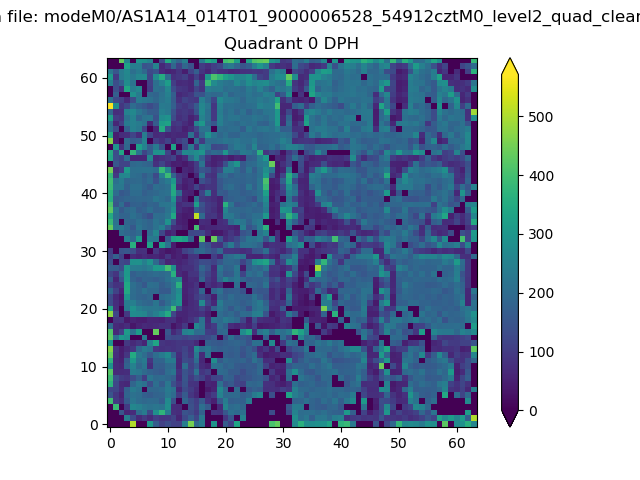 |
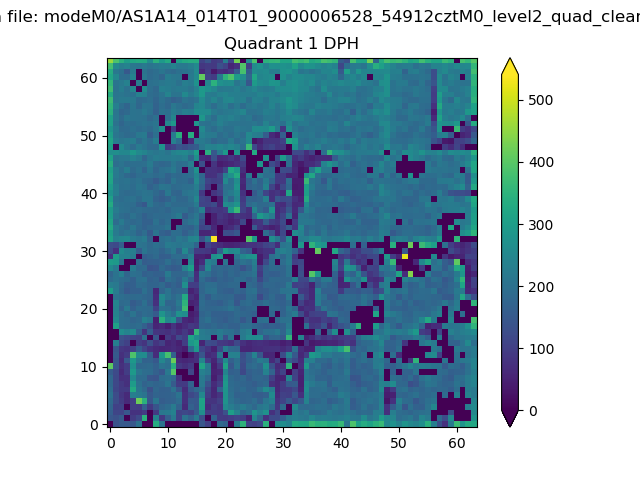 |
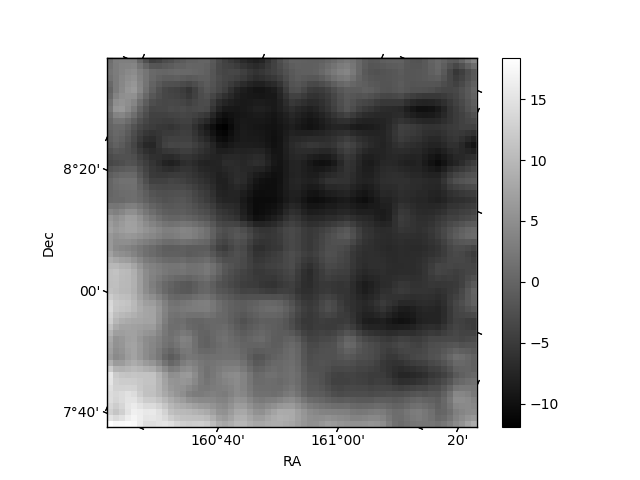
Quadrant B |
|---|---|---|---|
| Quadrant D | 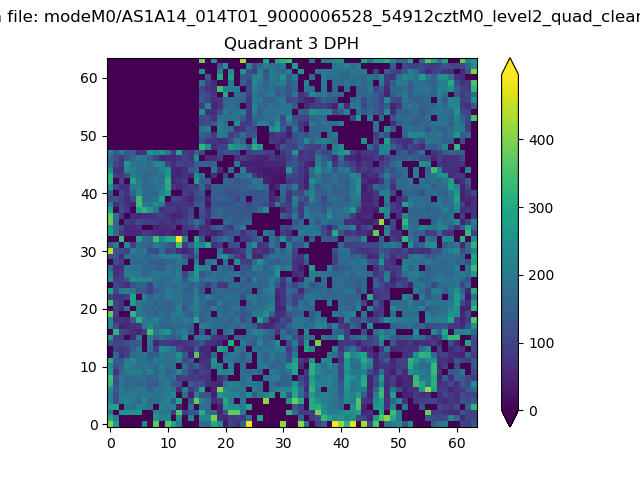 |
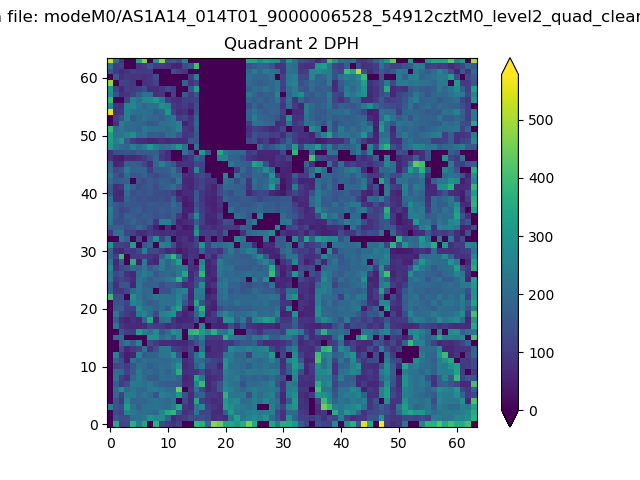 |
Quadrant C |
| Plot type | Count rate plots | Images |
|---|---|---|
| Comparison with Poisson distribution Blue bars denote a histogram of data divided into 1 sec bins. Red curve is a Poisson curve with rate = median count rate of data. |
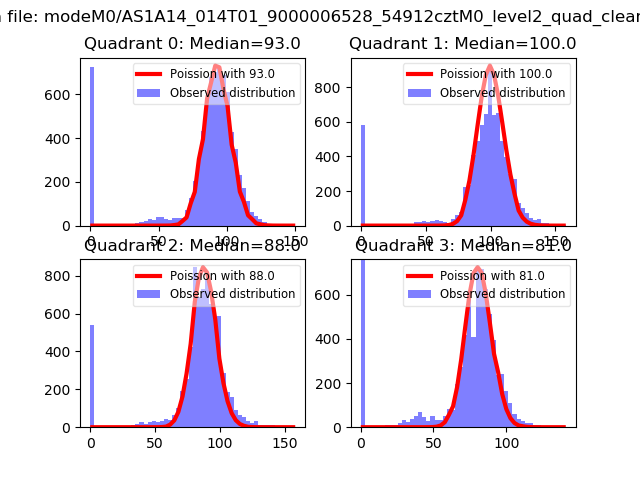 |
 |
| Quadrant-wise count rates Data is divided into 100 sec bins |
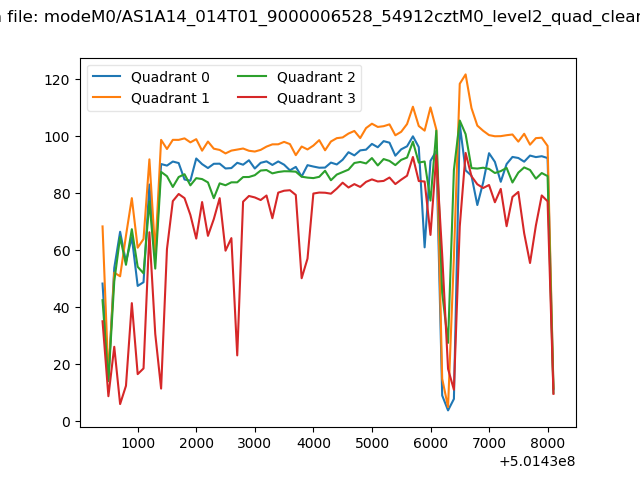 |
|
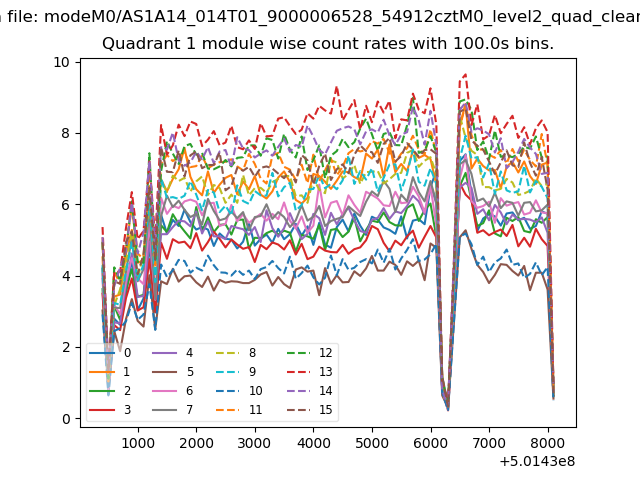
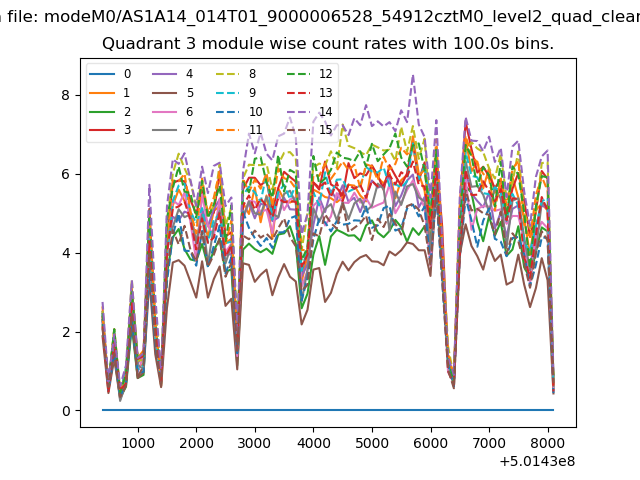
| Module-wise count rates for Quadrant A Data is divided into 100 sec bins |
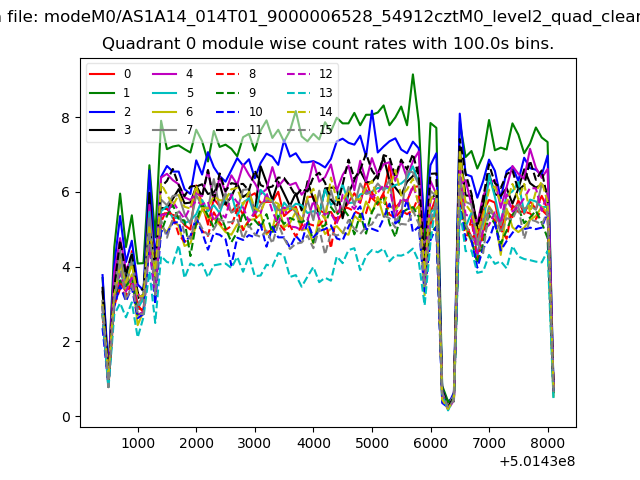 |
 |
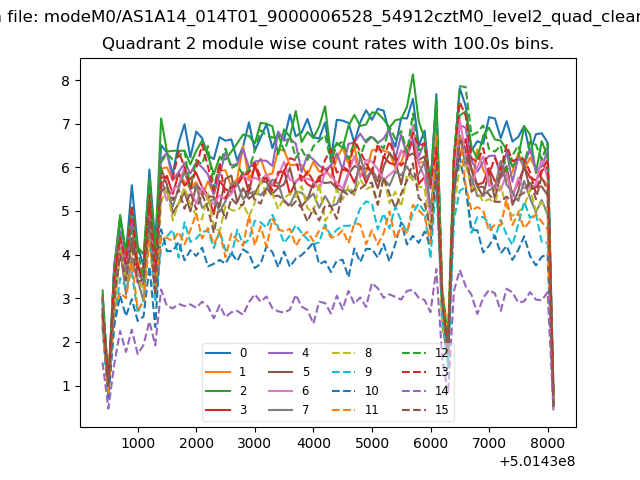
| Module-wise count rates for Quadrant B Data is divided into 100 sec bins |
 |
 |
| Module-wise count rates for Quadrant C Data is divided into 100 sec bins |
 |
 |
| Module-wise count rates for Quadrant D Data is divided into 100 sec bins |
 |
 |
| Parameter | Plot |
|---|---|
| CZT HV Monitor | 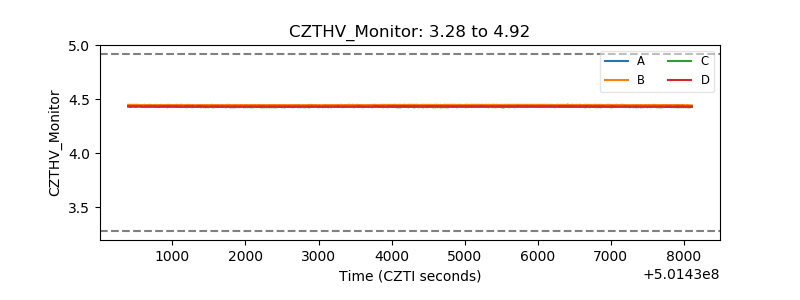 |
| D_VDD | 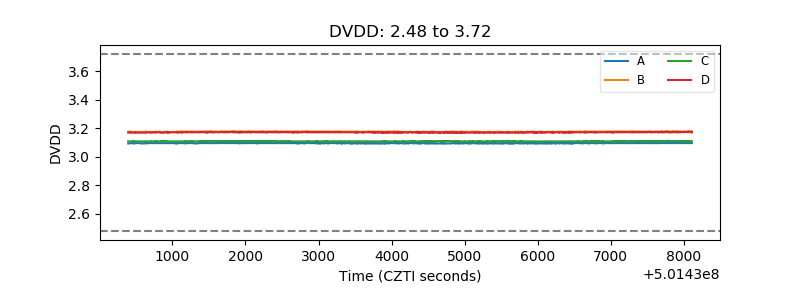 |
| Temperature 1 | 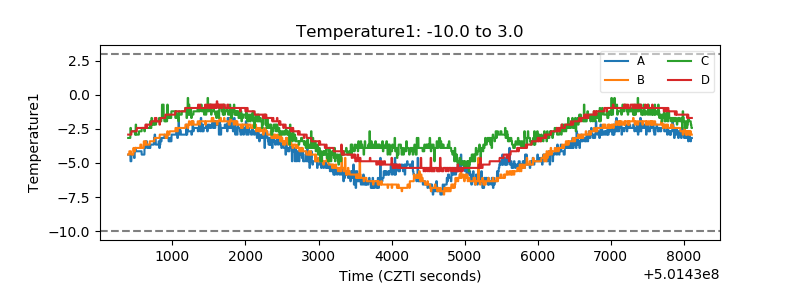 |
| Veto HV Monitor |  |
| Veto LLD | 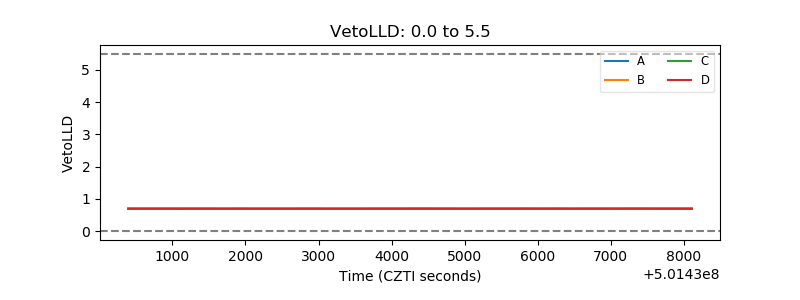 |
| Alpha Counter | 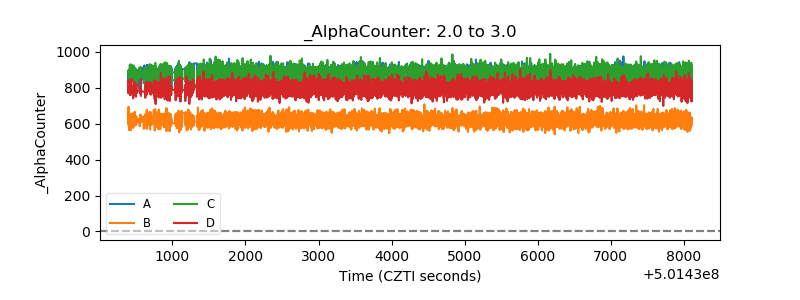 |
| _CPM_Rate | 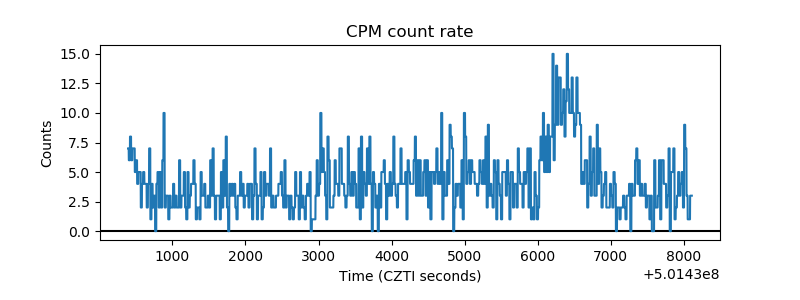 |
| CZT Counter | 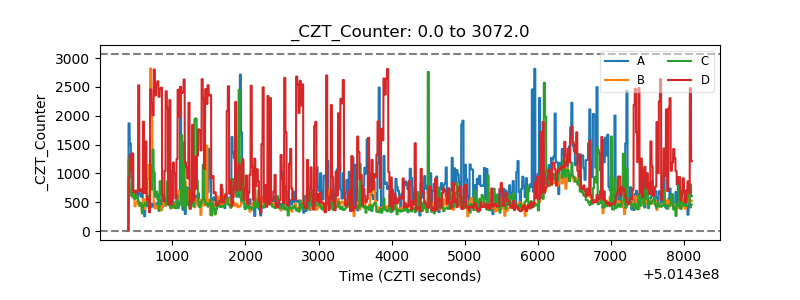 |
| +2.5 Volts monitor |  |
| +5 Volts monitor |  |
| _ROLL_ROT | 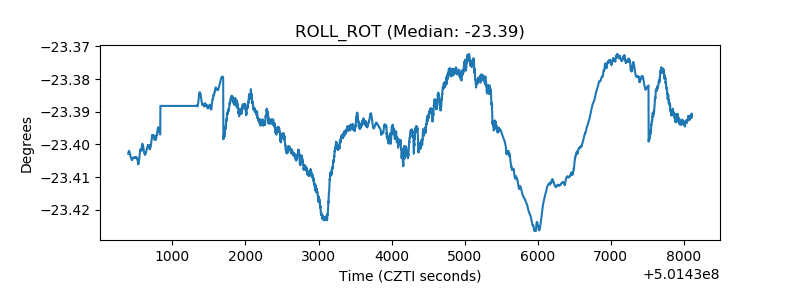 |
| _Roll_DEC | 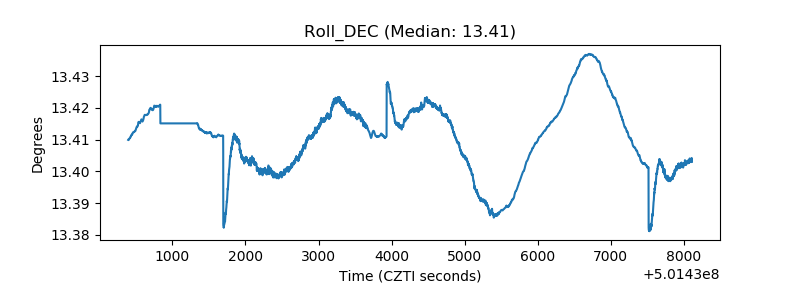 |
| _Roll_RA | 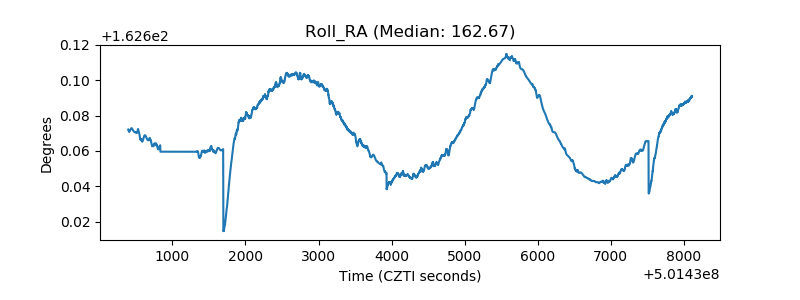 |
| Veto Counter | 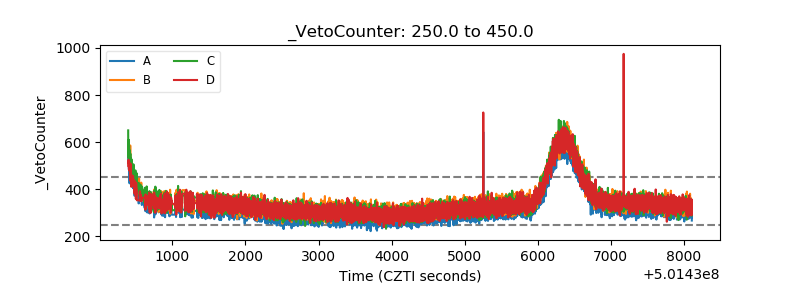 |