| Param | Original file | Final file |
|---|---|---|
| Filename | modeM0/AS1A14_014T01_9000006528_54913cztM0_level2.fits | modeM0/AS1A14_014T01_9000006528_54913cztM0_level2_quad_clean.evt |
| Size (bytes) | 608,123,520 | 108,190,080 |
| Size | 580.0 MB | 103.2 MB |
| Events in quadrant A | 5,928,724 | 710,253 |
| Events in quadrant B | 3,670,822 | 778,362 |
| Events in quadrant C | 5,735,067 | 640,678 |
| Events in quadrant D | 6,572,040 | 604,837 |
| Mode M0 | |||
|---|---|---|---|
| Quadrant | BADHDUFLAG | Total packets | Discarded packets |
| A | 0 | 23090 | 10 |
| B | 0 | 16360 | 3 |
| C | 0 | 22638 | 1 |
| D | 0 | 25156 | 1 |
| Mode SS | |||
|---|---|---|---|
| Quadrant | BADHDUFLAG | Total packets | Discarded packets |
| A | 0 | 154 | 0 |
| B | 0 | 154 | 0 |
| C | 0 | 154 | 0 |
| D | 0 | 154 | 0 |
| Quadrant | Total seconds | Saturated seconds | Saturation percentage |
|---|---|---|---|
| A | 7790 | 262 | 3.363286% |
| B | 7792 | 21 | 0.269507% |
| C | 7794 | 696 | 8.929946% |
| D | 7794 | 690 | 8.852964% |
Noise dominated data is calculated using 1-second bins in cleaned event files. If a bin has >2000 counts, and if more than 50% of those come from <1% of pixels, then it is considered to be noise-dominated and hence unusable.
| Quadrant | # 1 sec bins | Bins with >0 counts | Bins with >2000 counts | High rate bins dominated by noise | Noise dominated (total time) | Noise dominated (detector-on time) | Marked lightcurve |
|---|---|---|---|---|---|---|---|
| A | 7794 | 7793 | 175 | 175 | 2.25% | 2.25% | 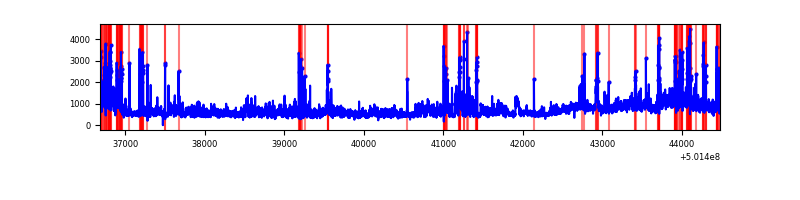 |
| B | 7794 | 7793 | 7 | 7 | 0.09% | 0.09% | 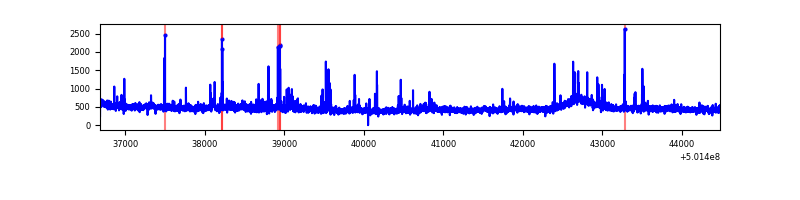 |
| C | 7795 | 7795 | 474 | 474 | 6.08% | 6.08% | 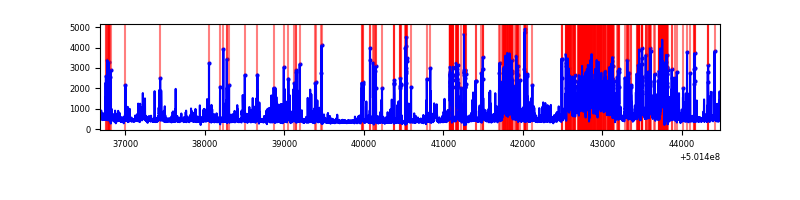 |
| D | 7795 | 7795 | 553 | 553 | 7.09% | 7.09% | 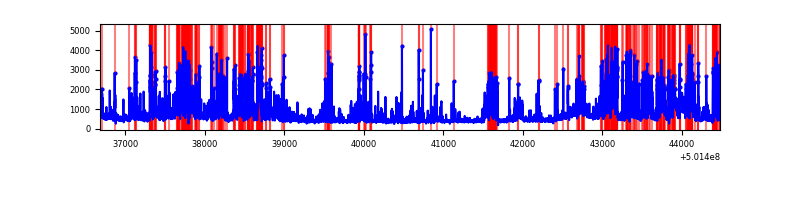 |
Top three noisy pixels from each quadrant. If the there are fewer than three noisy pixels in the level2.evt file, extra rows are filled as -1
| Pixel properties | Quadrant properties | ||||||
|---|---|---|---|---|---|---|---|
| Quadrant | DetID | PixID | Counts | Sigma | Mean | Median | Sigma |
| A | 3 | 14 | 1235314 | 5982.16 | 831 | 811 | 206.4 |
| A | 0 | 250 | 593796 | 2873.49 | 831 | 811 | 206.4 |
| A | 0 | 8 | 560184 | 2710.61 | 831 | 811 | 206.4 |
| B | 5 | 236 | 223409 | 1250.39 | 828 | 797 | 178.0 |
| B | 5 | 185 | 111957 | 624.38 | 828 | 797 | 178.0 |
| B | 7 | 252 | 27985 | 152.71 | 828 | 797 | 178.0 |
| C | 4 | 5 | 1193298 | 5553.97 | 788 | 782 | 214.7 |
| C | 6 | 223 | 733618 | 3413.08 | 788 | 782 | 214.7 |
| C | 13 | 3 | 304095 | 1412.64 | 788 | 782 | 214.7 |
| D | 15 | 94 | 646194 | 2873.52 | 786 | 751 | 224.6 |
| D | 14 | 52 | 590677 | 2626.36 | 786 | 751 | 224.6 |
| D | 3 | 12 | 560084 | 2490.16 | 786 | 751 | 224.6 |
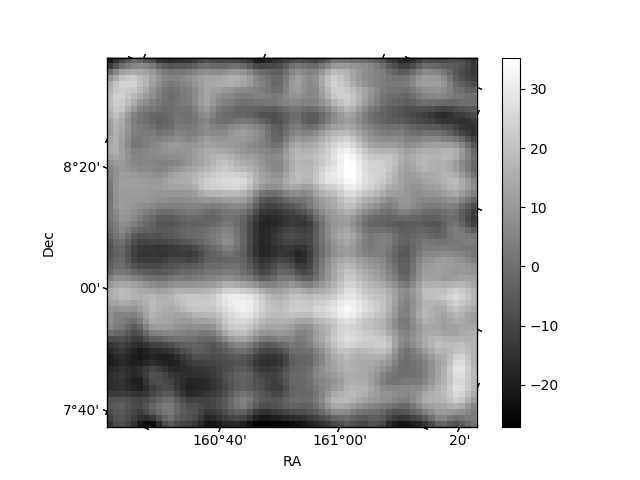
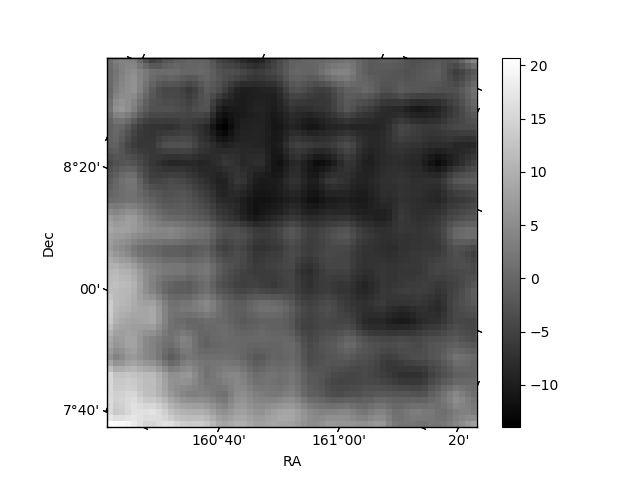
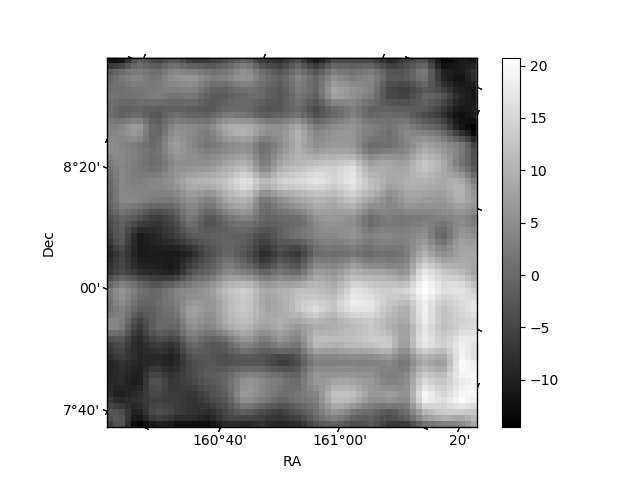
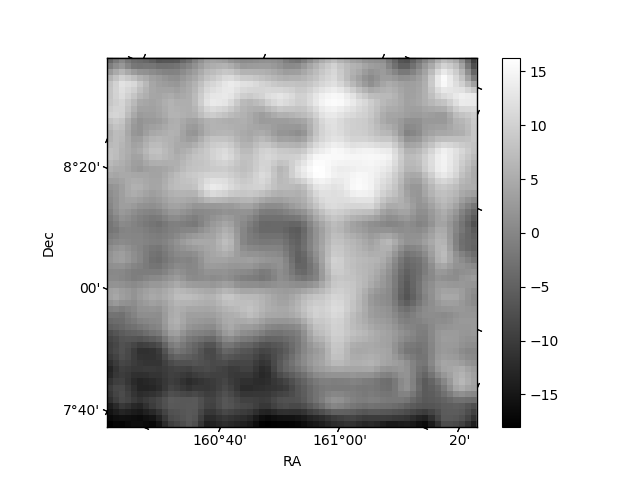
Histogram calculated using DETX and DETY for each event in the final _common_clean file
| Quadrant A | 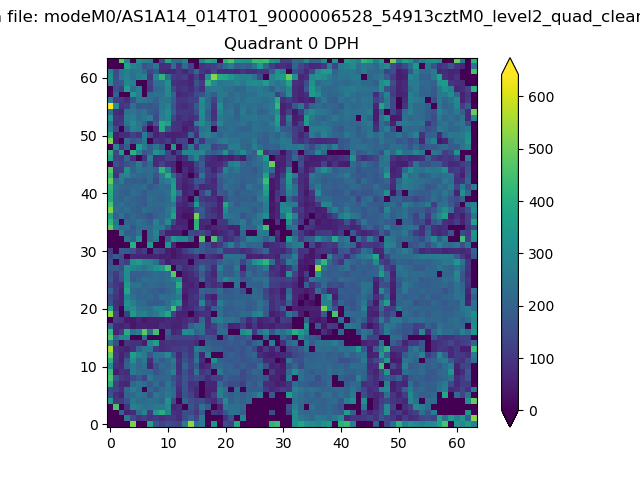 |
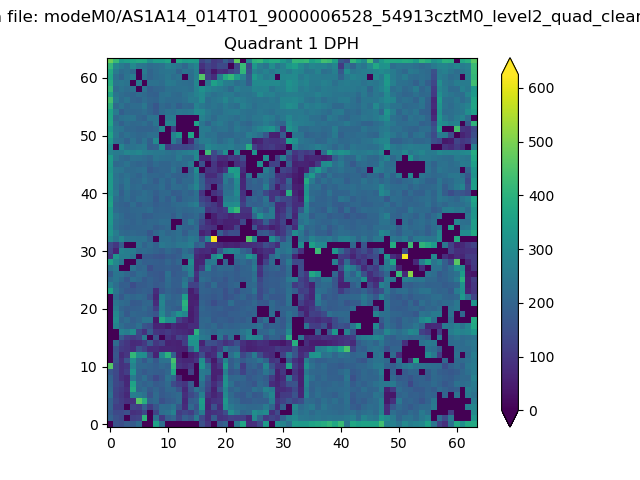 |
Quadrant B |
|---|---|---|---|
| Quadrant D | 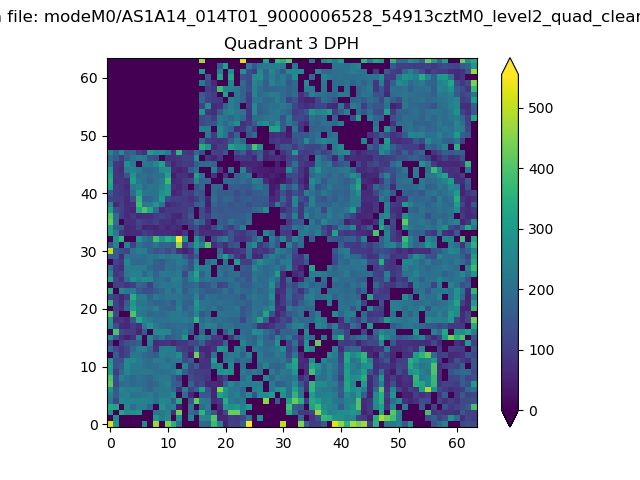 |
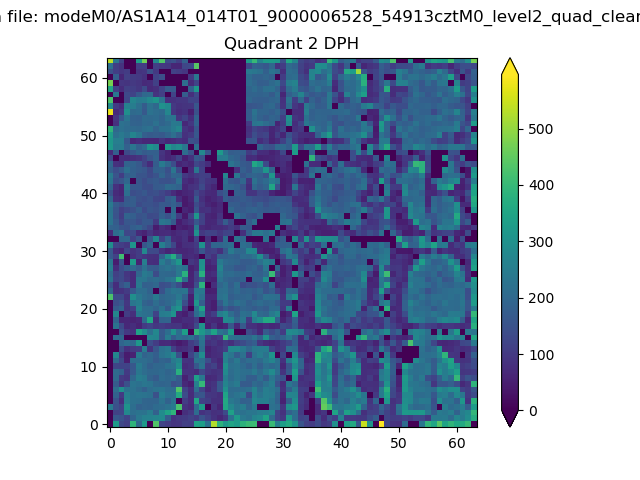 |
Quadrant C |
| Plot type | Count rate plots | Images |
|---|---|---|
| Comparison with Poisson distribution Blue bars denote a histogram of data divided into 1 sec bins. Red curve is a Poisson curve with rate = median count rate of data. |
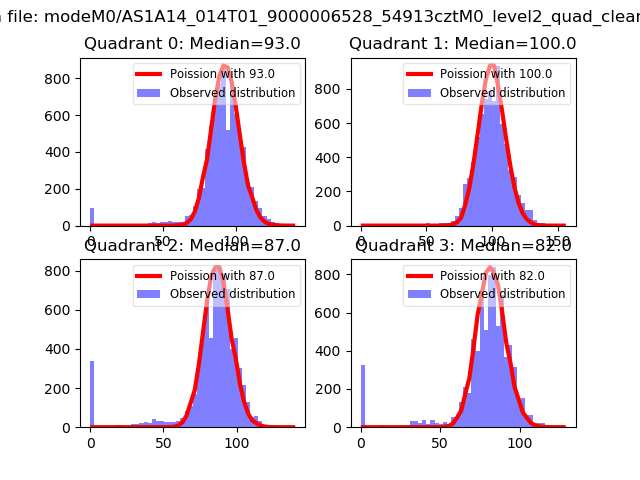 |
 |
| Quadrant-wise count rates Data is divided into 100 sec bins |
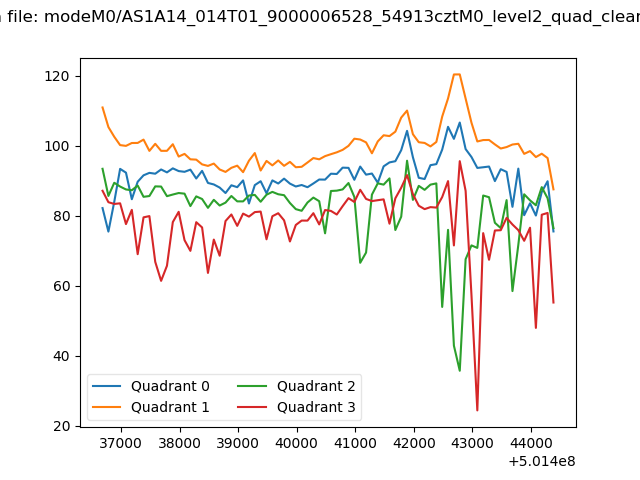 |
|
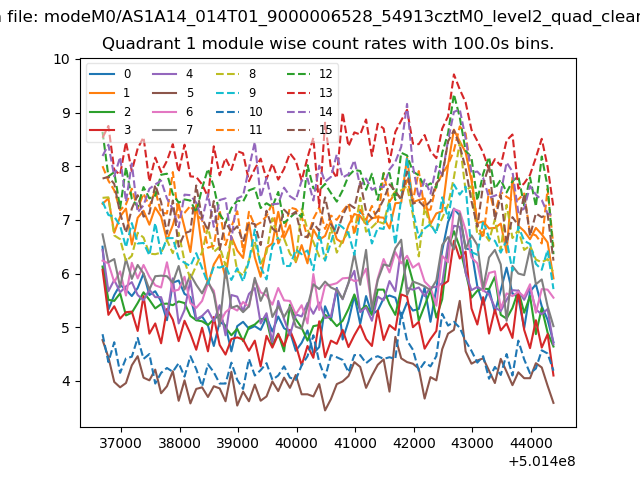
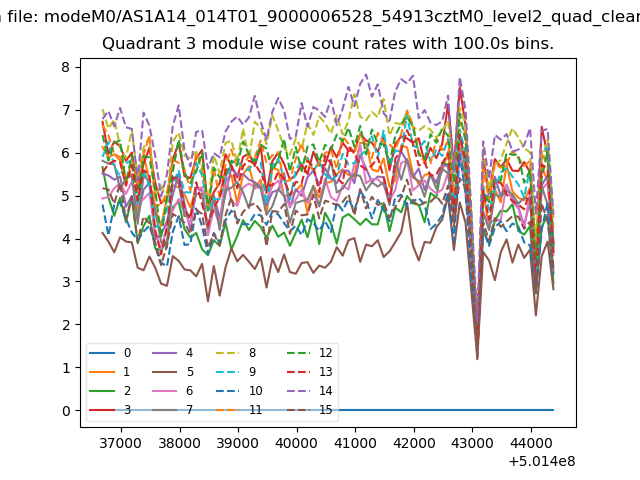
| Module-wise count rates for Quadrant A Data is divided into 100 sec bins |
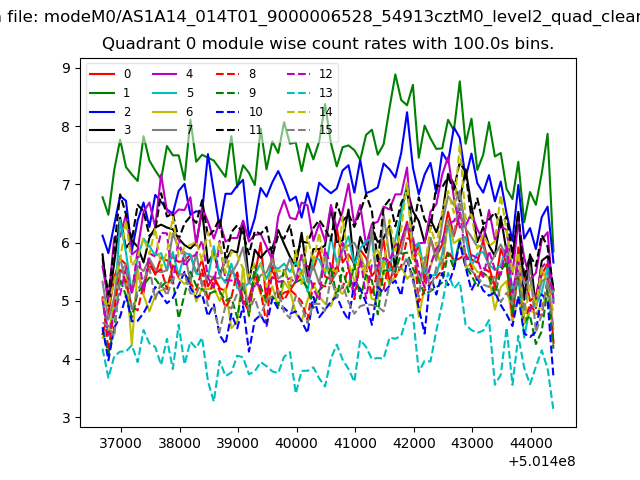 |
 |
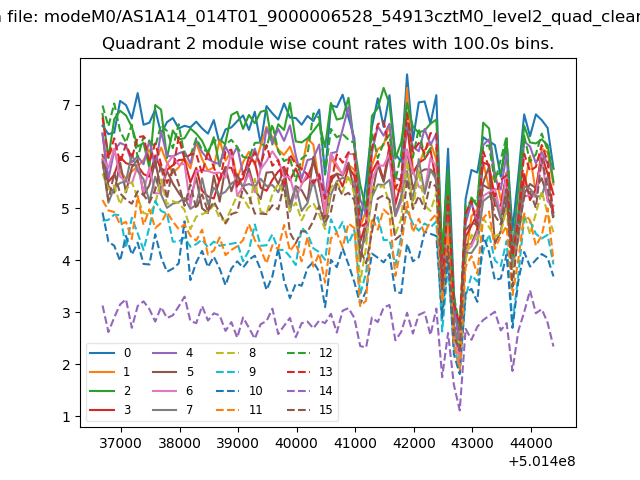
| Module-wise count rates for Quadrant B Data is divided into 100 sec bins |
 |
 |
| Module-wise count rates for Quadrant C Data is divided into 100 sec bins |
 |
 |
| Module-wise count rates for Quadrant D Data is divided into 100 sec bins |
 |
 |
| Parameter | Plot |
|---|---|
| CZT HV Monitor | 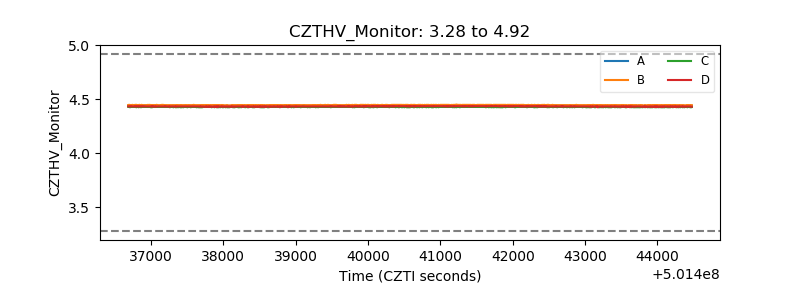 |
| D_VDD | 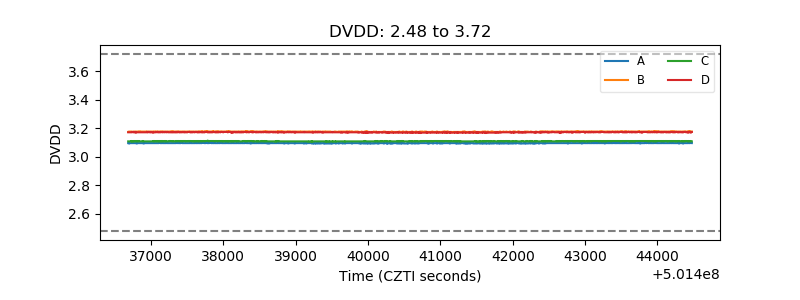 |
| Temperature 1 |  |
| Veto HV Monitor | 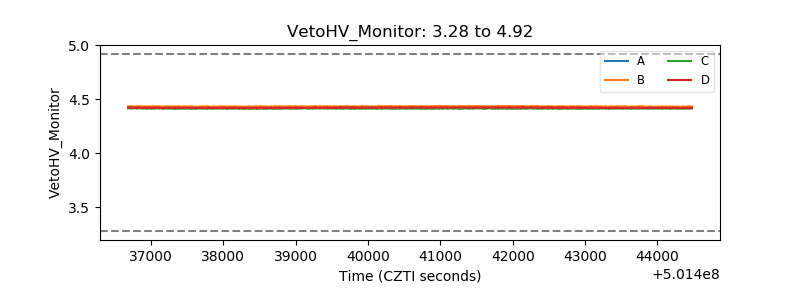 |
| Veto LLD |  |
| Alpha Counter |  |
| _CPM_Rate | 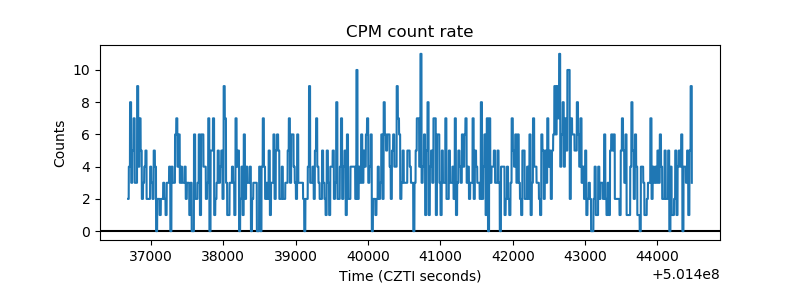 |
| CZT Counter | 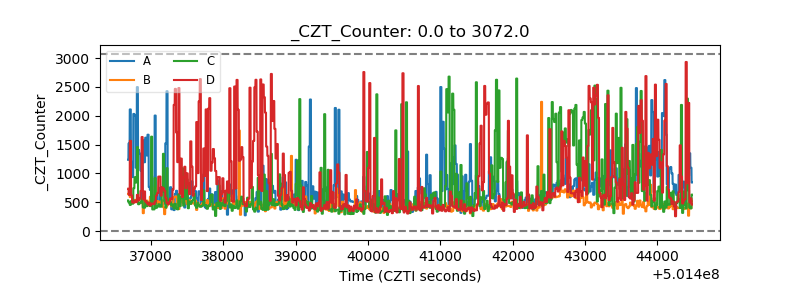 |
| +2.5 Volts monitor |  |
| +5 Volts monitor |  |
| _ROLL_ROT | 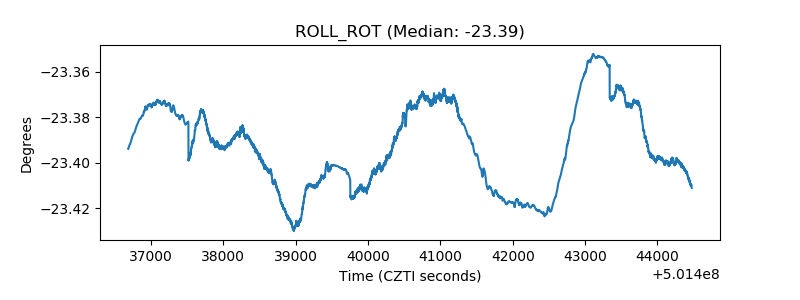 |
| _Roll_DEC |  |
| _Roll_RA | 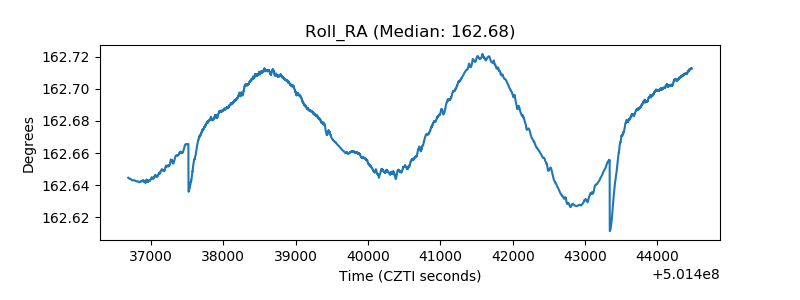 |
| Veto Counter | 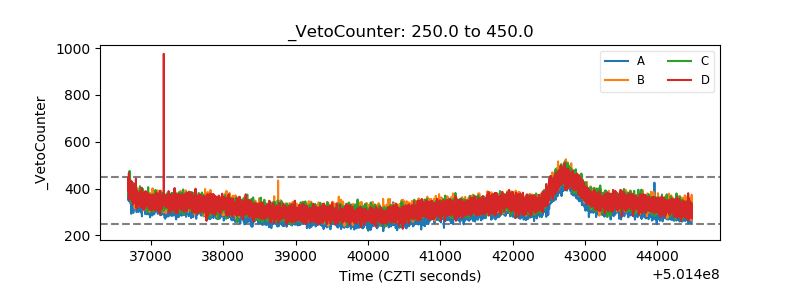 |