| Param | Original file | Final file |
|---|---|---|
| Filename | modeM0/AS1A14_014T01_9000006528_54918cztM0_level2.fits | modeM0/AS1A14_014T01_9000006528_54918cztM0_level2_quad_clean.evt |
| Size (bytes) | 1,573,758,720 | 272,499,840 |
| Size | 1.5 GB | 259.9 MB |
| Events in quadrant A | 16,741,812 | 1,732,626 |
| Events in quadrant B | 9,911,232 | 1,947,182 |
| Events in quadrant C | 12,693,686 | 1,714,857 |
| Events in quadrant D | 17,338,475 | 1,455,245 |
| Mode M0 | |||
|---|---|---|---|
| Quadrant | BADHDUFLAG | Total packets | Discarded packets |
| A | 0 | 64234 | 36 |
| B | 0 | 44472 | 15 |
| C | 0 | 52559 | 15 |
| D | 0 | 66440 | 42 |
| Mode SS | |||
|---|---|---|---|
| Quadrant | BADHDUFLAG | Total packets | Discarded packets |
| A | 0 | 414 | 0 |
| B | 0 | 414 | 0 |
| C | 0 | 414 | 0 |
| D | 0 | 413 | 1 |
| Mode M9 | |||
|---|---|---|---|
| Quadrant | BADHDUFLAG | Total packets | Discarded packets |
| A | 0 | 12 | 0 |
| B | 0 | 12 | 0 |
| C | 0 | 12 | 0 |
| D | 0 | 12 | 0 |
| Quadrant | Total seconds | Saturated seconds | Saturation percentage |
|---|---|---|---|
| A | 20324 | 1410 | 6.937611% |
| B | 20324 | 392 | 1.928754% |
| C | 20326 | 813 | 3.999803% |
| D | 20323 | 2079 | 10.229789% |
Noise dominated data is calculated using 1-second bins in cleaned event files. If a bin has >2000 counts, and if more than 50% of those come from <1% of pixels, then it is considered to be noise-dominated and hence unusable.
| Quadrant | # 1 sec bins | Bins with >0 counts | Bins with >2000 counts | High rate bins dominated by noise | Noise dominated (total time) | Noise dominated (detector-on time) | Marked lightcurve |
|---|---|---|---|---|---|---|---|
| A | 21597 | 20334 | 981 | 981 | 4.54% | 4.82% | 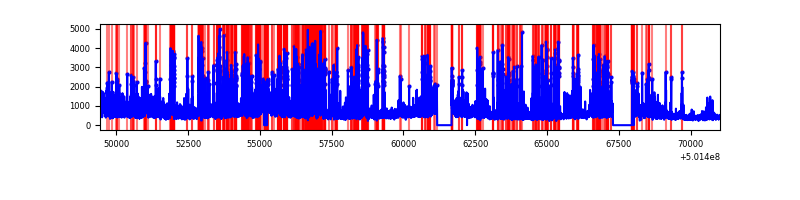 |
| B | 21597 | 20333 | 142 | 142 | 0.66% | 0.70% | 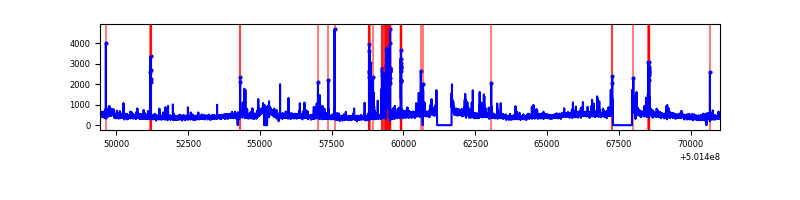 |
| C | 21598 | 20336 | 590 | 590 | 2.73% | 2.90% | 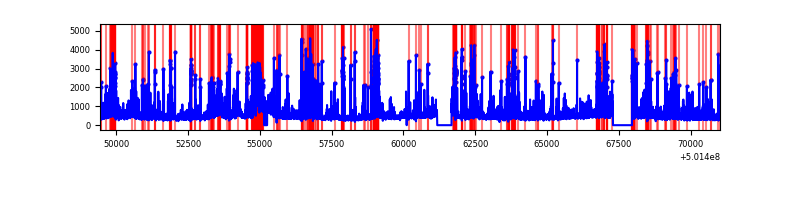 |
| D | 21597 | 20332 | 1758 | 1758 | 8.14% | 8.65% | 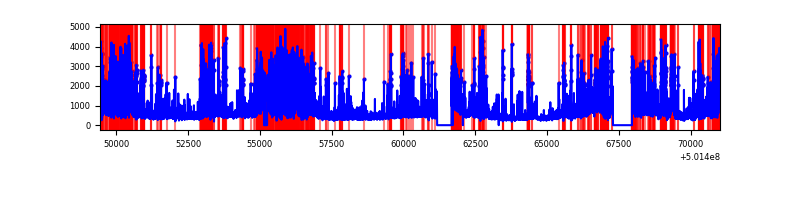 |
Top three noisy pixels from each quadrant. If the there are fewer than three noisy pixels in the level2.evt file, extra rows are filled as -1
| Pixel properties | Quadrant properties | ||||||
|---|---|---|---|---|---|---|---|
| Quadrant | DetID | PixID | Counts | Sigma | Mean | Median | Sigma |
| A | 3 | 14 | 4576680 | 8943.6 | 2051 | 1998 | 511.5 |
| A | 3 | 45 | 2926609 | 5717.67 | 2051 | 1998 | 511.5 |
| A | 0 | 8 | 926585 | 1807.59 | 2051 | 1998 | 511.5 |
| B | 5 | 236 | 769919 | 1717.94 | 2083 | 2002 | 447.0 |
| B | 5 | 172 | 394977 | 879.14 | 2083 | 2002 | 447.0 |
| B | 5 | 185 | 300217 | 667.15 | 2083 | 2002 | 447.0 |
| C | 4 | 5 | 1525496 | 2721.55 | 2023 | 1999 | 559.8 |
| C | 13 | 3 | 634316 | 1129.56 | 2023 | 1999 | 559.8 |
| C | 12 | 252 | 526362 | 936.71 | 2023 | 1999 | 559.8 |
| D | 11 | 129 | 3447012 | 6247.81 | 1923 | 1840 | 551.4 |
| D | 15 | 94 | 1707455 | 3093.13 | 1923 | 1840 | 551.4 |
| D | 6 | 239 | 1120350 | 2028.41 | 1923 | 1840 | 551.4 |
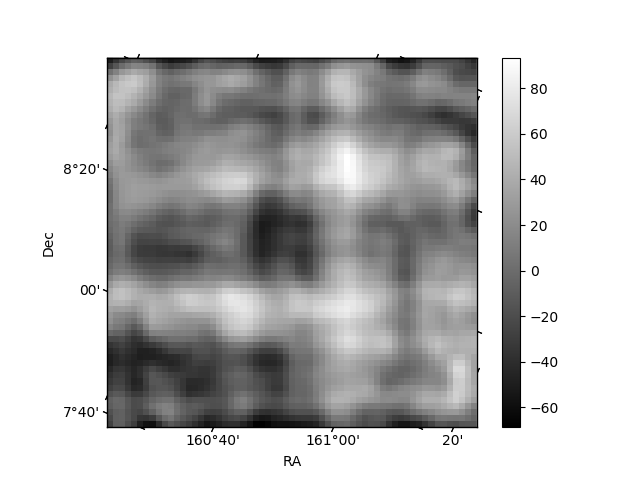
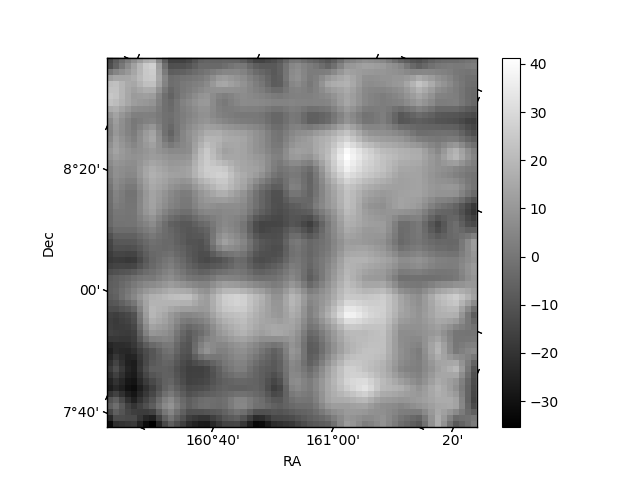
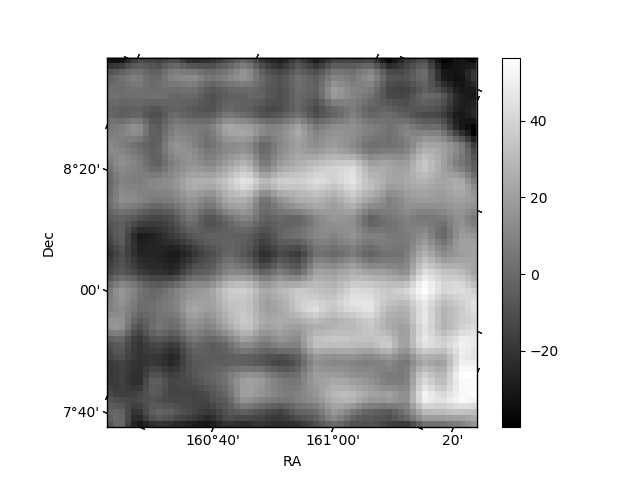
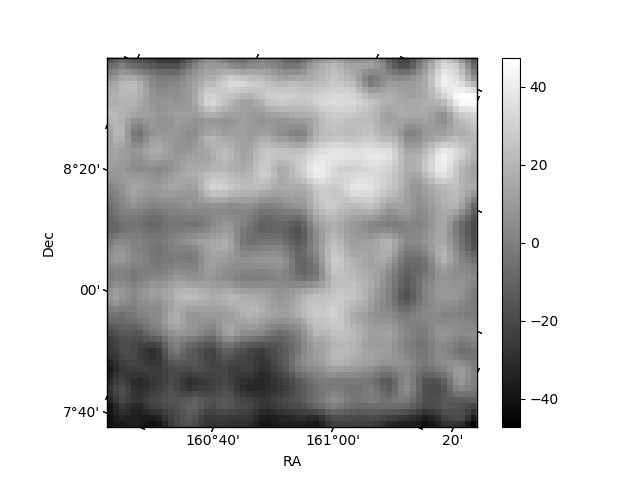
Histogram calculated using DETX and DETY for each event in the final _common_clean file
| Quadrant A | 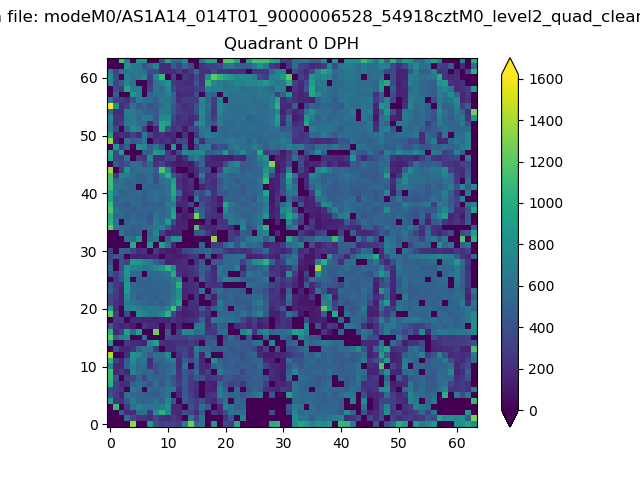 |
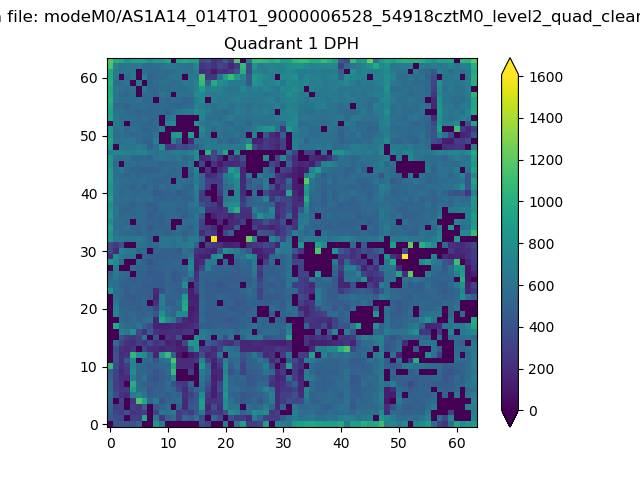 |
Quadrant B |
|---|---|---|---|
| Quadrant D | 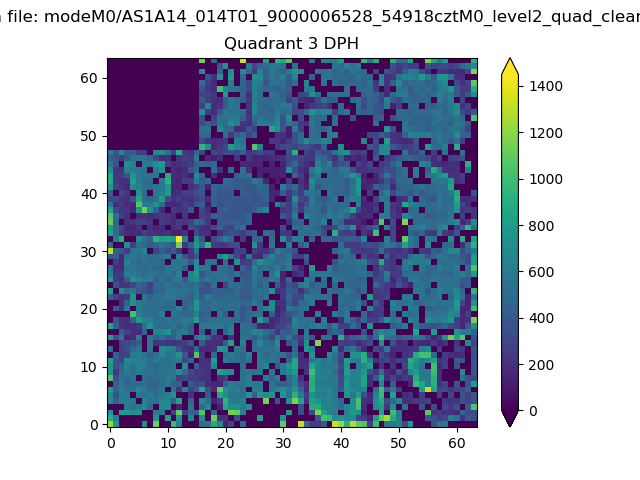 |
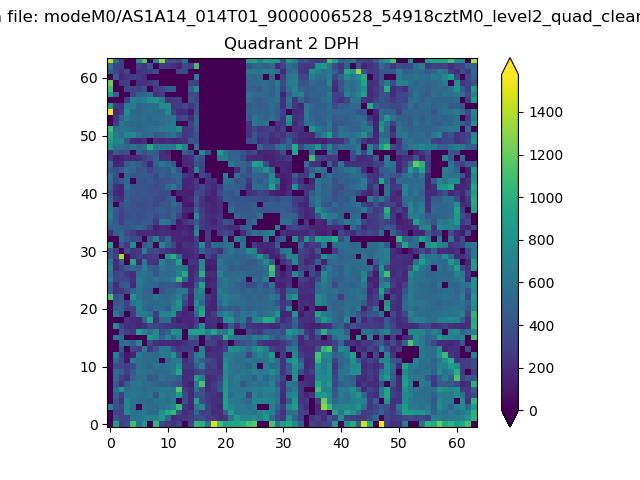 |
Quadrant C |
| Plot type | Count rate plots | Images |
|---|---|---|
| Comparison with Poisson distribution Blue bars denote a histogram of data divided into 1 sec bins. Red curve is a Poisson curve with rate = median count rate of data. |
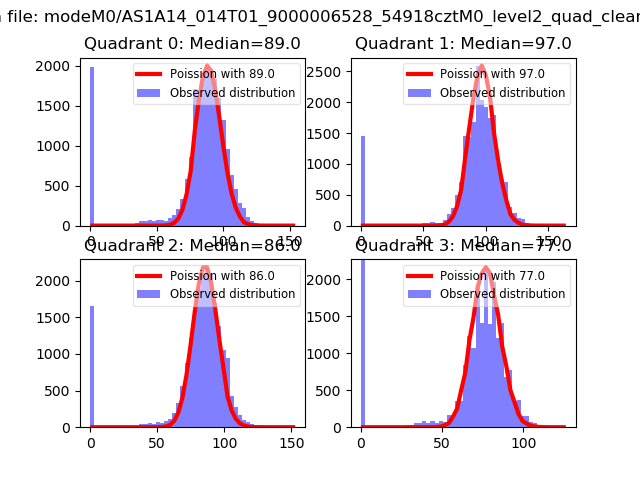 |
 |
| Quadrant-wise count rates Data is divided into 100 sec bins |
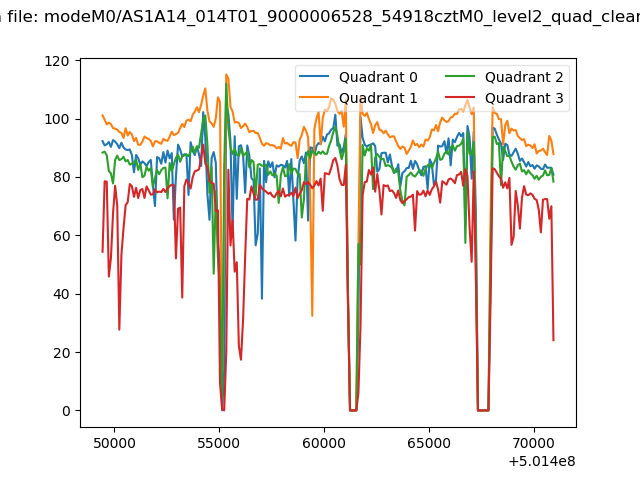 |
|
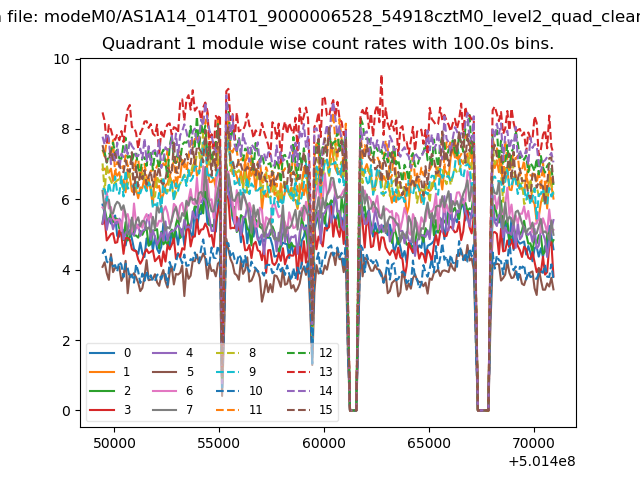
| Module-wise count rates for Quadrant A Data is divided into 100 sec bins |
 |
 |
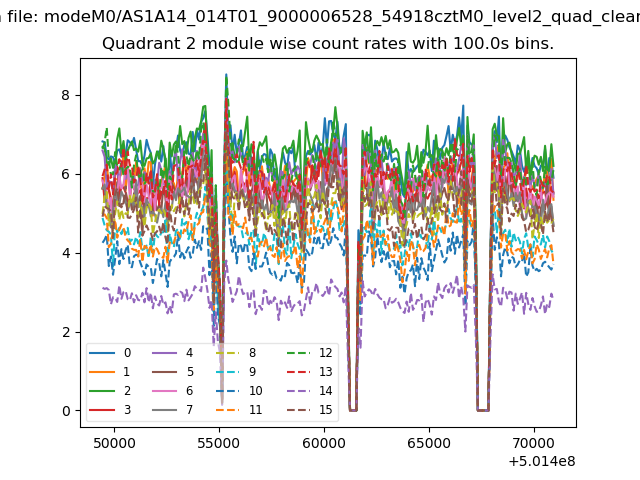
| Module-wise count rates for Quadrant B Data is divided into 100 sec bins |
 |
 |
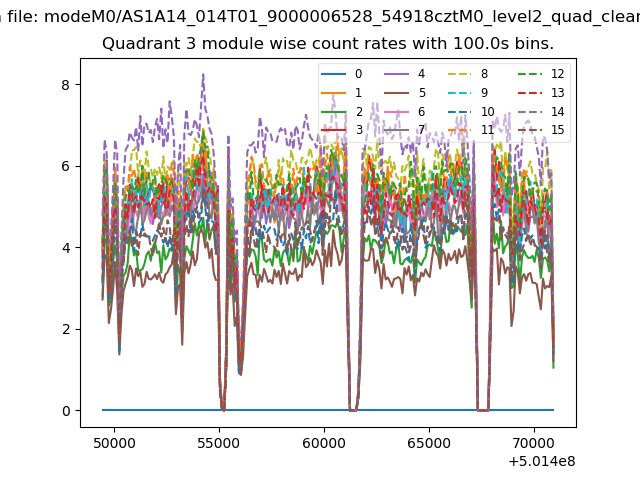
| Module-wise count rates for Quadrant C Data is divided into 100 sec bins |
 |
 |
| Module-wise count rates for Quadrant D Data is divided into 100 sec bins |
 |
 |
| Parameter | Plot |
|---|---|
| CZT HV Monitor |  |
| D_VDD | 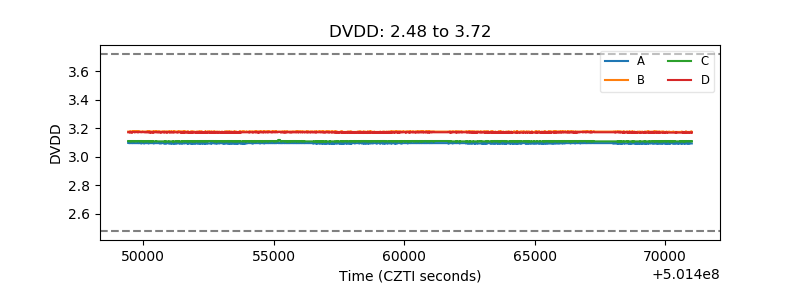 |
| Temperature 1 |  |
| Veto HV Monitor | 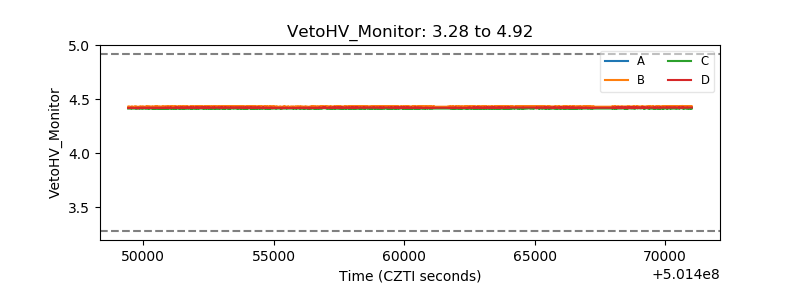 |
| Veto LLD | 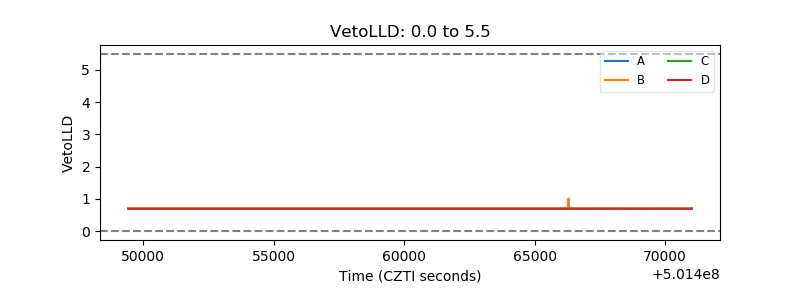 |
| Alpha Counter | 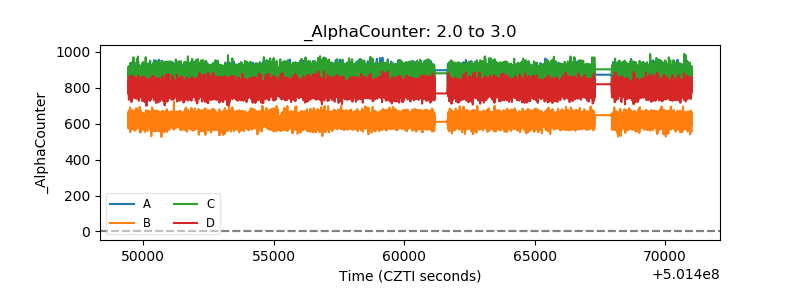 |
| _CPM_Rate | 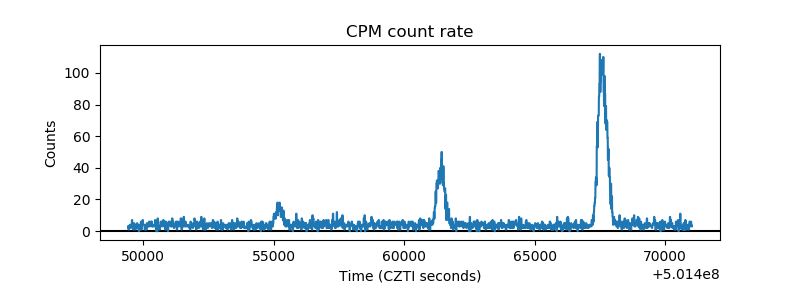 |
| CZT Counter | 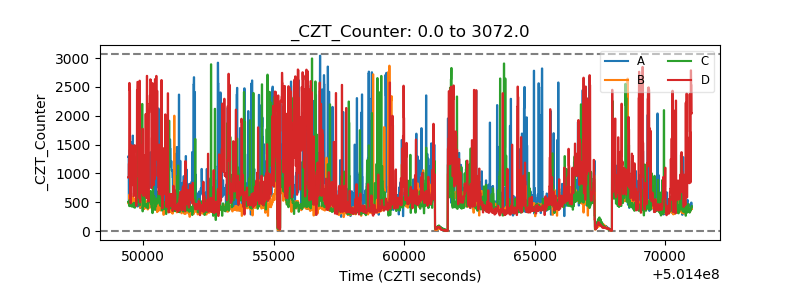 |
| +2.5 Volts monitor |  |
| +5 Volts monitor |  |
| _ROLL_ROT | 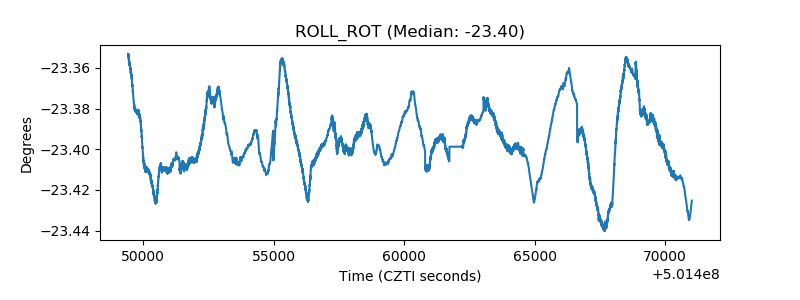 |
| _Roll_DEC | 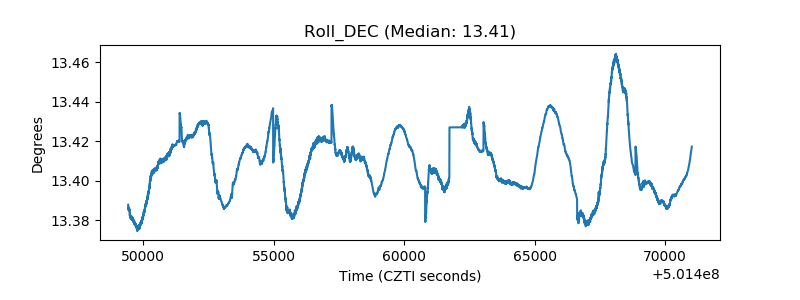 |
| _Roll_RA | 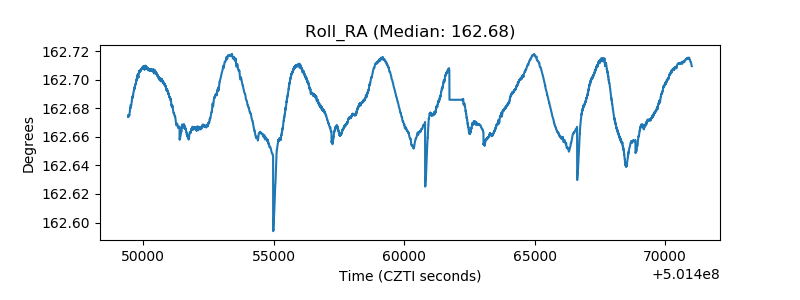 |
| Veto Counter | 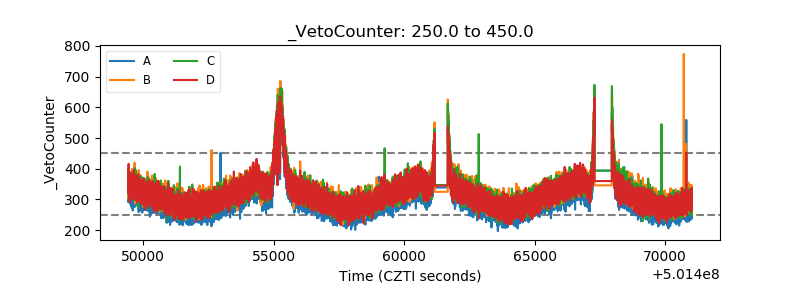 |