| Param | Original file | Final file |
|---|---|---|
| Filename | modeM0/AS1A14_014T01_9000006528_54920cztM0_level2.fits | modeM0/AS1A14_014T01_9000006528_54920cztM0_level2_quad_clean.evt |
| Size (bytes) | 712,978,560 | 129,781,440 |
| Size | 679.9 MB | 123.8 MB |
| Events in quadrant A | 5,564,090 | 869,725 |
| Events in quadrant B | 4,612,411 | 945,232 |
| Events in quadrant C | 7,018,285 | 777,655 |
| Events in quadrant D | 8,468,763 | 684,723 |
| Mode M0 | |||
|---|---|---|---|
| Quadrant | BADHDUFLAG | Total packets | Discarded packets |
| A | 0 | 22969 | 2 |
| B | 0 | 20382 | 2 |
| C | 0 | 27532 | 4 |
| D | 0 | 32096 | 14 |
| Mode SS | |||
|---|---|---|---|
| Quadrant | BADHDUFLAG | Total packets | Discarded packets |
| A | 0 | 194 | 0 |
| B | 0 | 194 | 0 |
| C | 0 | 194 | 0 |
| D | 0 | 194 | 0 |
| Mode M9 | |||
|---|---|---|---|
| Quadrant | BADHDUFLAG | Total packets | Discarded packets |
| A | 0 | 17 | 0 |
| B | 0 | 17 | 0 |
| C | 0 | 17 | 0 |
| D | 0 | 17 | 0 |
| Quadrant | Total seconds | Saturated seconds | Saturation percentage |
|---|---|---|---|
| A | 9396 | 234 | 2.490421% |
| B | 9396 | 104 | 1.106854% |
| C | 9396 | 762 | 8.109834% |
| D | 9394 | 1321 | 14.062167% |
Noise dominated data is calculated using 1-second bins in cleaned event files. If a bin has >2000 counts, and if more than 50% of those come from <1% of pixels, then it is considered to be noise-dominated and hence unusable.
| Quadrant | # 1 sec bins | Bins with >0 counts | Bins with >2000 counts | High rate bins dominated by noise | Noise dominated (total time) | Noise dominated (detector-on time) | Marked lightcurve |
|---|---|---|---|---|---|---|---|
| A | 11171 | 9398 | 126 | 126 | 1.13% | 1.34% | 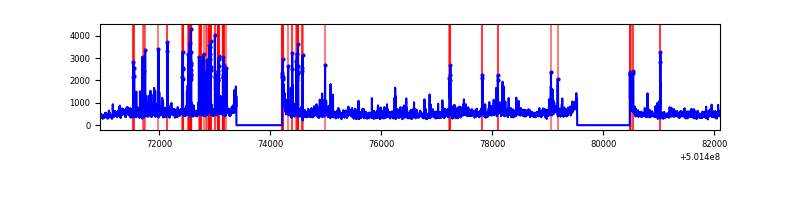 |
| B | 11171 | 9398 | 17 | 17 | 0.15% | 0.18% | 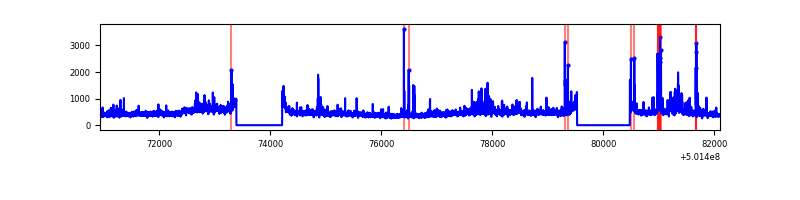 |
| C | 11171 | 9397 | 540 | 540 | 4.83% | 5.75% | 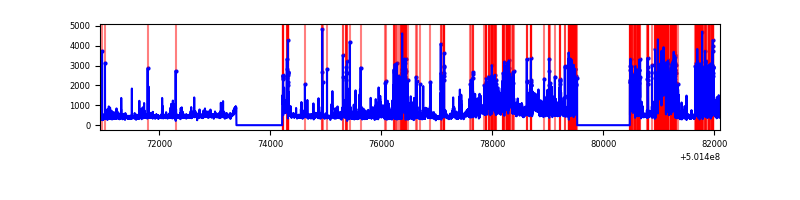 |
| D | 11171 | 9397 | 1059 | 1059 | 9.48% | 11.27% | 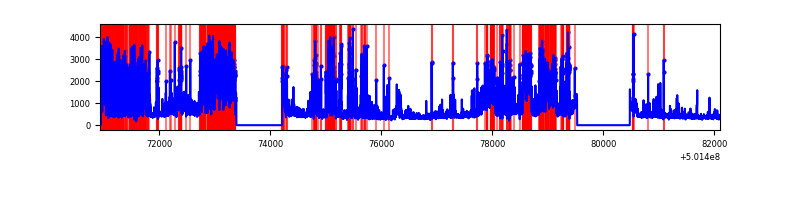 |
Top three noisy pixels from each quadrant. If the there are fewer than three noisy pixels in the level2.evt file, extra rows are filled as -1
| Pixel properties | Quadrant properties | ||||||
|---|---|---|---|---|---|---|---|
| Quadrant | DetID | PixID | Counts | Sigma | Mean | Median | Sigma |
| A | 3 | 14 | 906214 | 3694.43 | 992 | 967 | 245.0 |
| A | 3 | 45 | 295496 | 1202.01 | 992 | 967 | 245.0 |
| A | 0 | 8 | 221858 | 901.49 | 992 | 967 | 245.0 |
| B | 5 | 236 | 303991 | 1414.13 | 989 | 952 | 214.3 |
| B | 5 | 185 | 213433 | 991.54 | 989 | 952 | 214.3 |
| B | 5 | 172 | 136686 | 633.4 | 989 | 952 | 214.3 |
| C | 4 | 5 | 1764002 | 6903.27 | 927 | 919 | 255.4 |
| C | 6 | 223 | 576420 | 2253.35 | 927 | 919 | 255.4 |
| C | 12 | 252 | 509653 | 1991.93 | 927 | 919 | 255.4 |
| D | 11 | 129 | 1639703 | 6250.97 | 914 | 870 | 262.2 |
| D | 6 | 46 | 1426209 | 5436.64 | 914 | 870 | 262.2 |
| D | 14 | 52 | 645999 | 2460.7 | 914 | 870 | 262.2 |
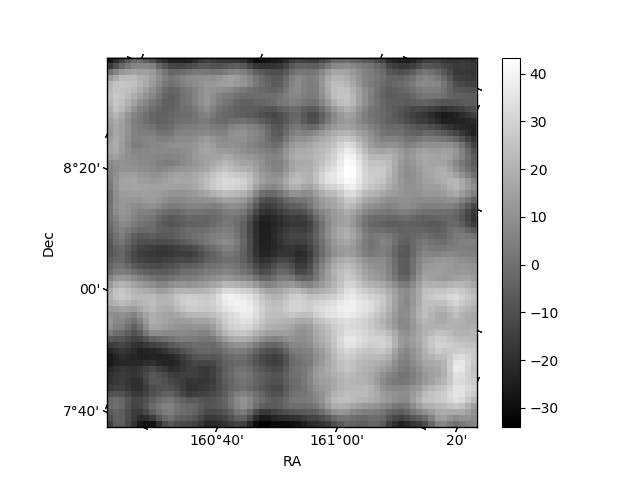
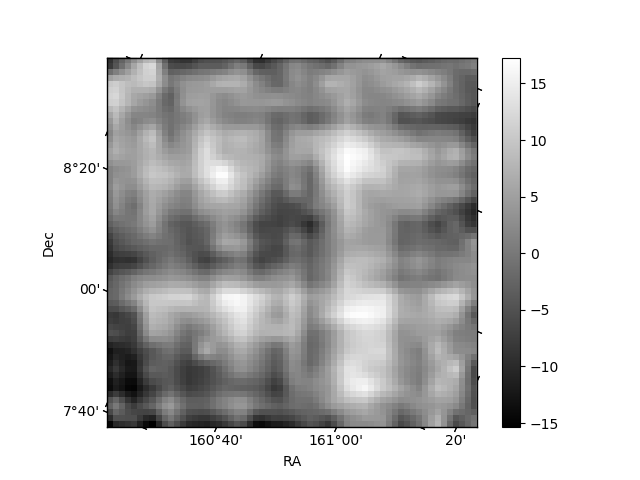
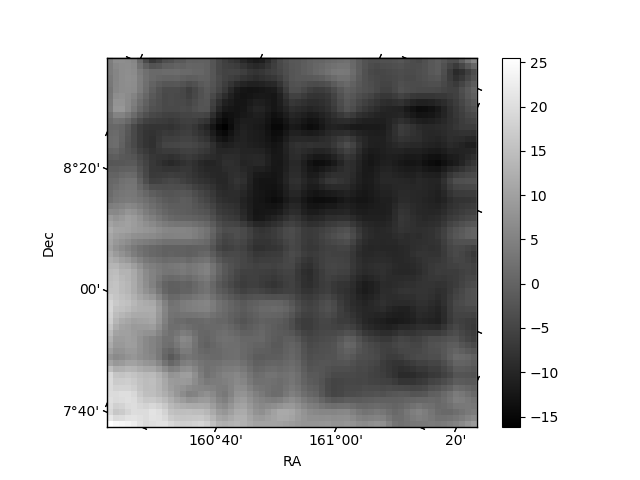
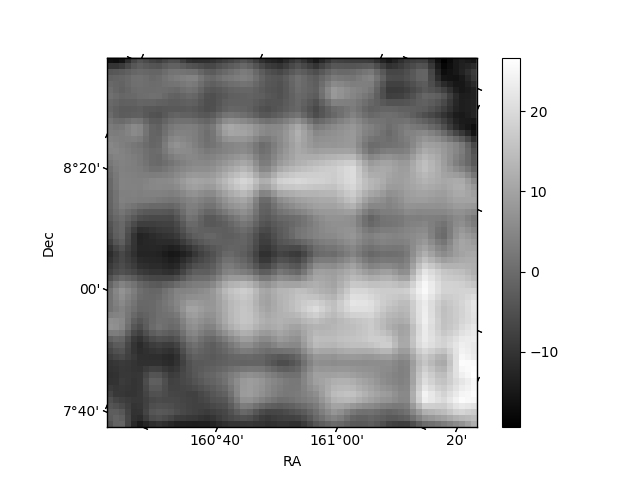
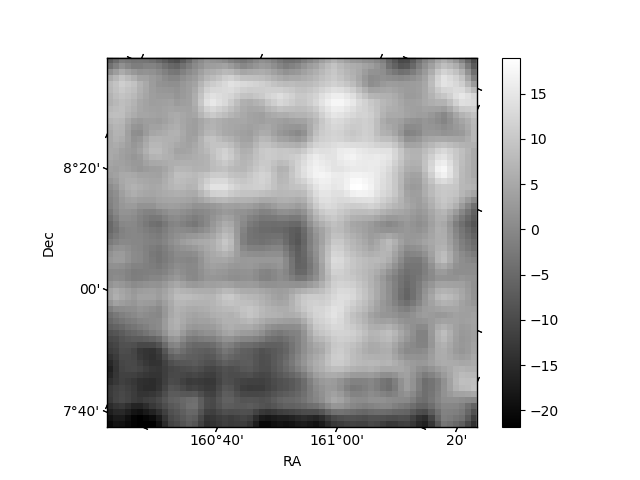
Histogram calculated using DETX and DETY for each event in the final _common_clean file
| Quadrant A | 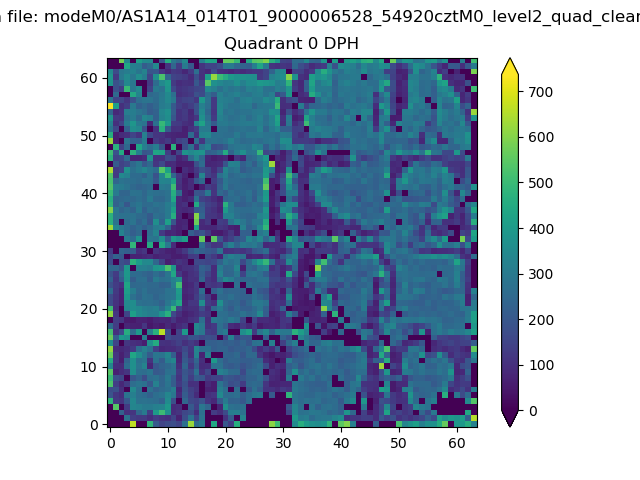 |
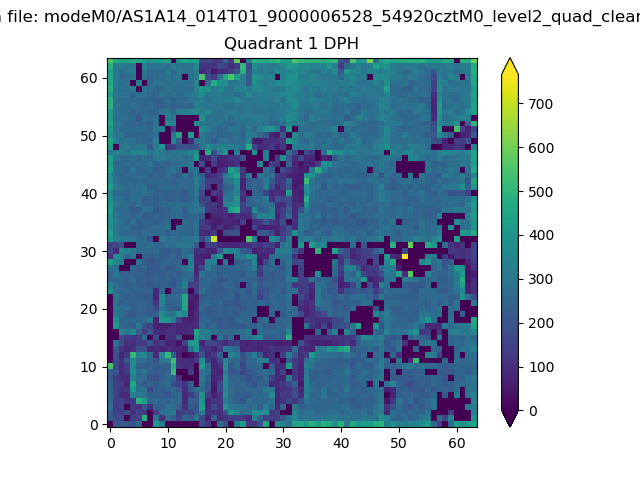 |
Quadrant B |
|---|---|---|---|
| Quadrant D | 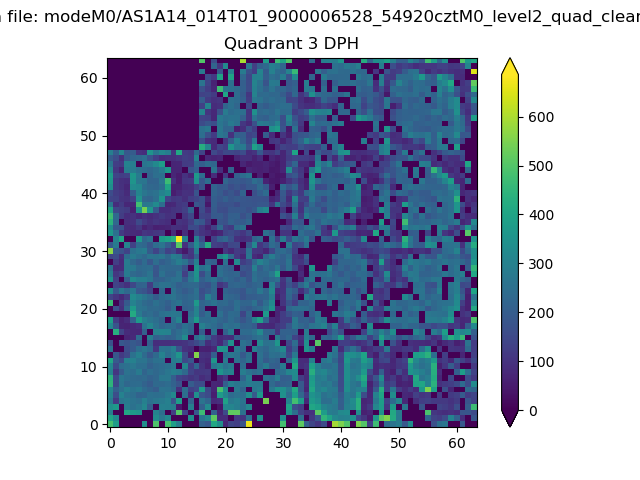 |
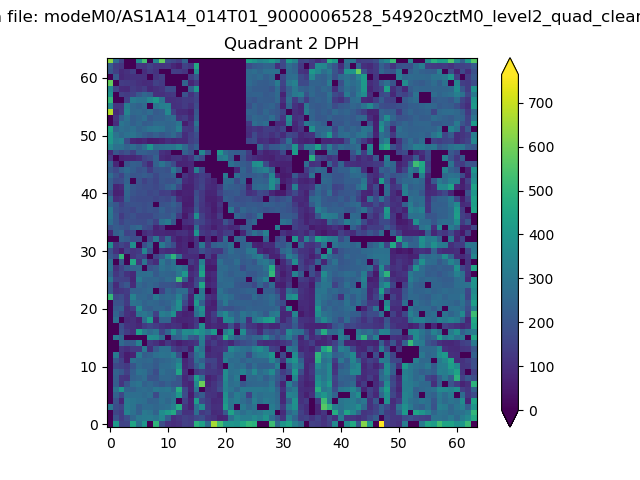 |
Quadrant C |
| Plot type | Count rate plots | Images |
|---|---|---|
| Comparison with Poisson distribution Blue bars denote a histogram of data divided into 1 sec bins. Red curve is a Poisson curve with rate = median count rate of data. |
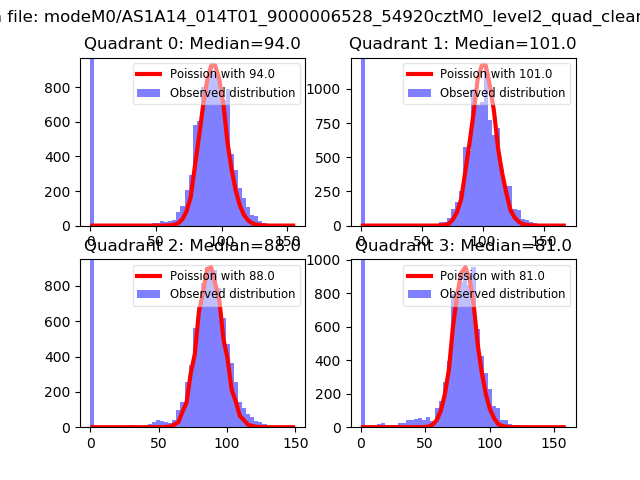 |
 |
| Quadrant-wise count rates Data is divided into 100 sec bins |
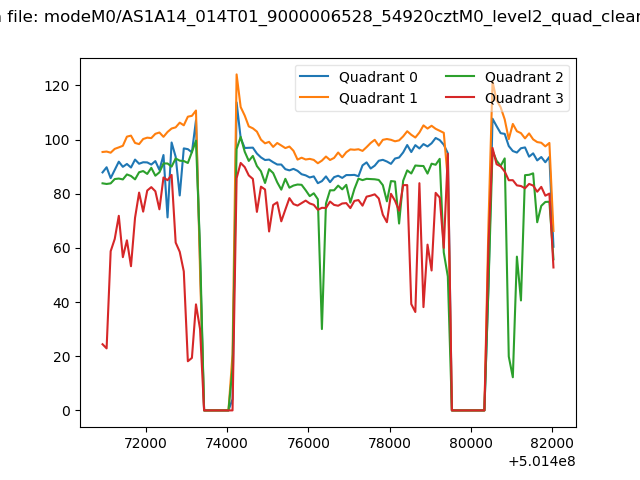 |
|
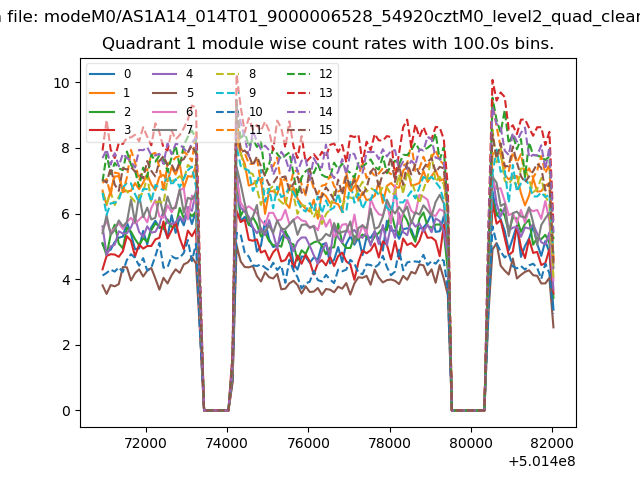
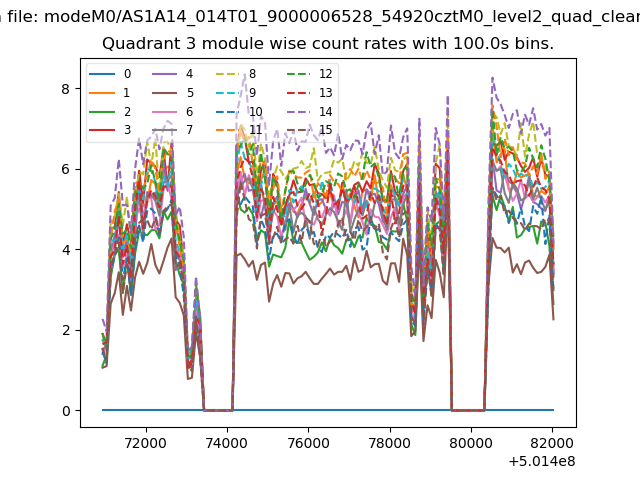
| Module-wise count rates for Quadrant A Data is divided into 100 sec bins |
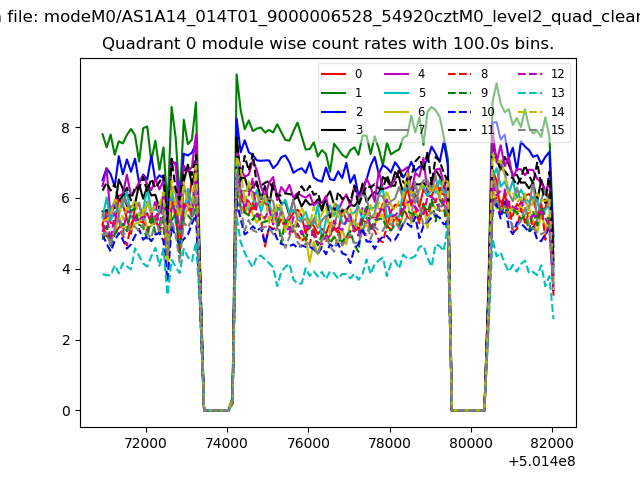 |
 |
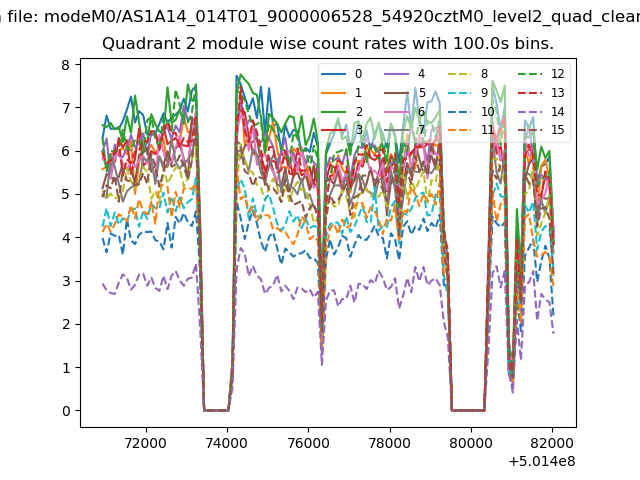
| Module-wise count rates for Quadrant B Data is divided into 100 sec bins |
 |
 |
| Module-wise count rates for Quadrant C Data is divided into 100 sec bins |
 |
 |
| Module-wise count rates for Quadrant D Data is divided into 100 sec bins |
 |
 |
| Parameter | Plot |
|---|---|
| CZT HV Monitor | 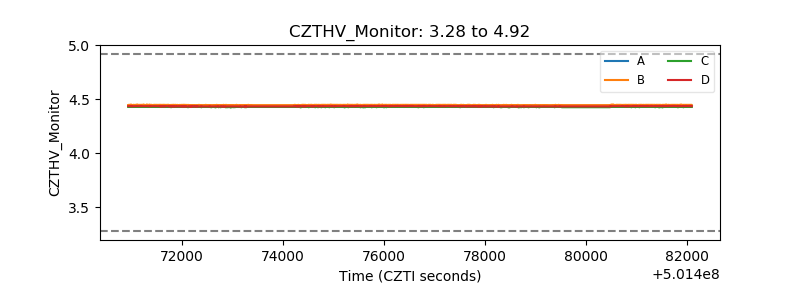 |
| D_VDD | 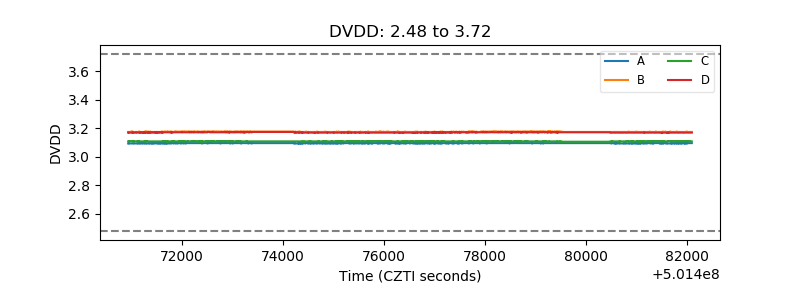 |
| Temperature 1 | 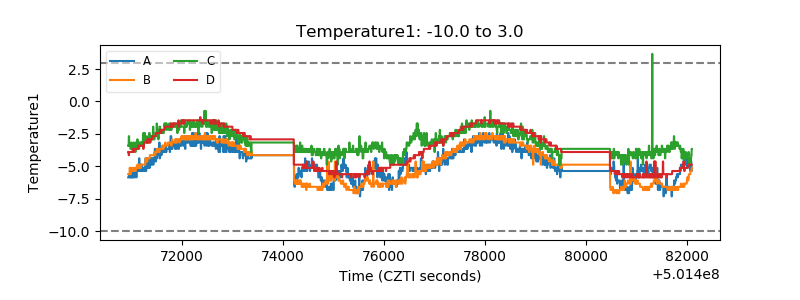 |
| Veto HV Monitor | 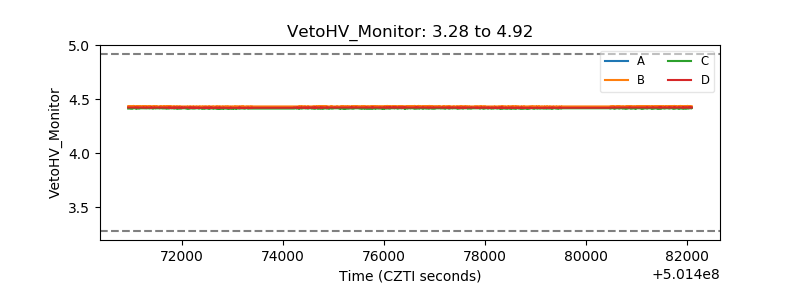 |
| Veto LLD | 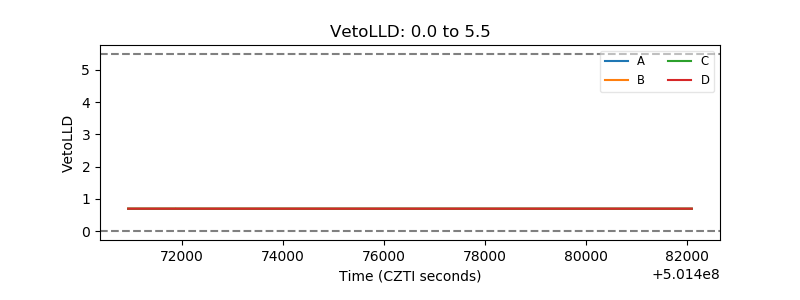 |
| Alpha Counter | 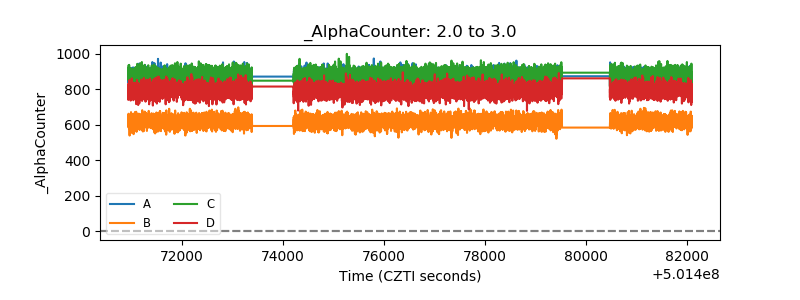 |
| _CPM_Rate | 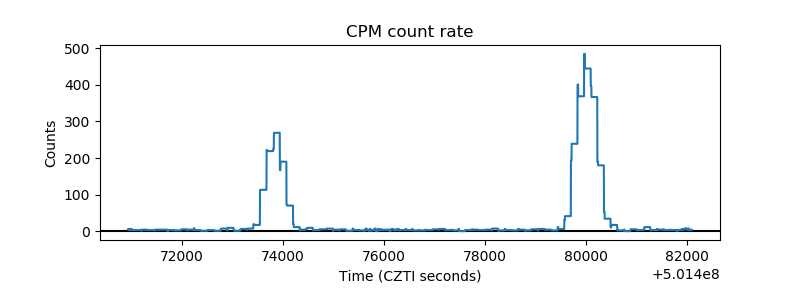 |
| CZT Counter | 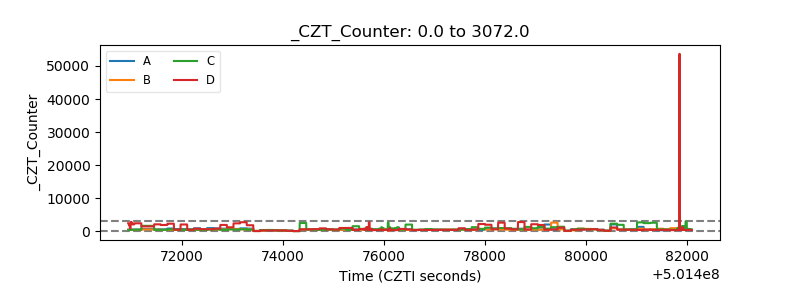 |
| +2.5 Volts monitor |  |
| +5 Volts monitor |  |
| _ROLL_ROT | 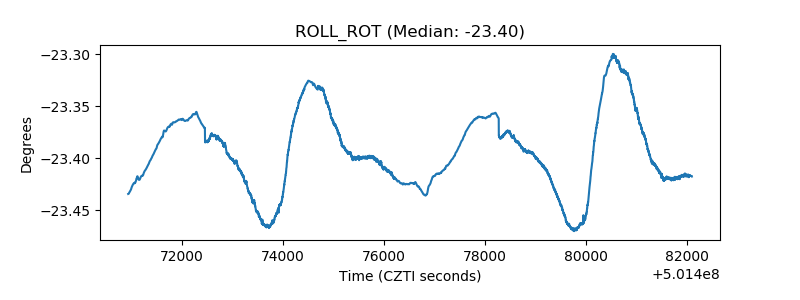 |
| _Roll_DEC | 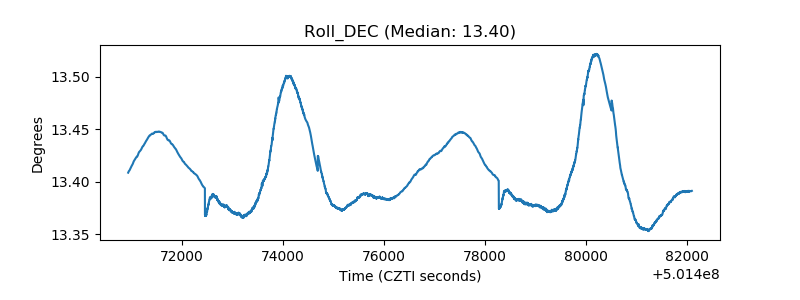 |
| _Roll_RA | 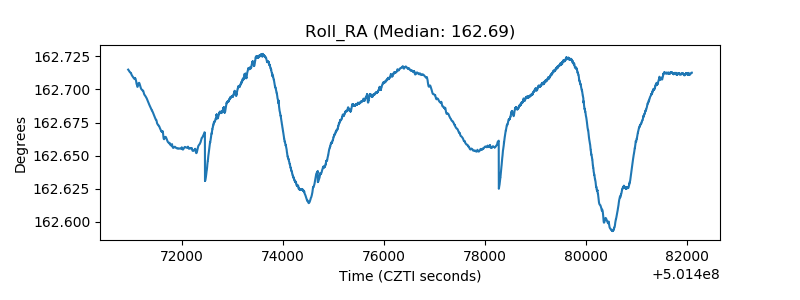 |
| Veto Counter | 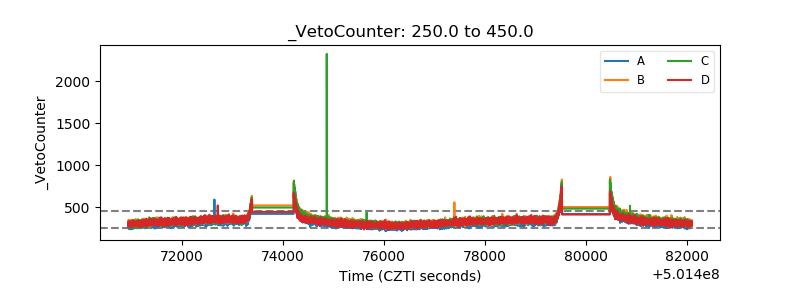 |