| Param | Original file | Final file |
|---|---|---|
| Filename | modeM0/AS1A14_014T01_9000006528_54921cztM0_level2.fits | modeM0/AS1A14_014T01_9000006528_54921cztM0_level2_quad_clean.evt |
| Size (bytes) | 3,158,326,080 | 557,375,040 |
| Size | 2.9 GB | 531.6 MB |
| Events in quadrant A | 30,766,692 | 3,621,581 |
| Events in quadrant B | 19,779,360 | 4,011,578 |
| Events in quadrant C | 28,971,631 | 3,378,908 |
| Events in quadrant D | 34,263,639 | 3,077,581 |
| Mode M0 | |||
|---|---|---|---|
| Quadrant | BADHDUFLAG | Total packets | Discarded packets |
| A | 0 | 119704 | 6 |
| B | 0 | 88485 | 6 |
| C | 0 | 115232 | 6 |
| D | 0 | 131436 | 8 |
| Mode SS | |||
|---|---|---|---|
| Quadrant | BADHDUFLAG | Total packets | Discarded packets |
| A | 0 | 826 | 0 |
| B | 0 | 826 | 0 |
| C | 0 | 826 | 0 |
| D | 0 | 826 | 0 |
| Mode M9 | |||
|---|---|---|---|
| Quadrant | BADHDUFLAG | Total packets | Discarded packets |
| A | 0 | 39 | 0 |
| B | 0 | 39 | 0 |
| C | 0 | 39 | 0 |
| D | 0 | 39 | 0 |
| Quadrant | Total seconds | Saturated seconds | Saturation percentage |
|---|---|---|---|
| A | 40548 | 2148 | 5.297425% |
| B | 40549 | 629 | 1.551210% |
| C | 40548 | 3093 | 7.627996% |
| D | 40547 | 4261 | 10.508792% |
Noise dominated data is calculated using 1-second bins in cleaned event files. If a bin has >2000 counts, and if more than 50% of those come from <1% of pixels, then it is considered to be noise-dominated and hence unusable.
| Quadrant | # 1 sec bins | Bins with >0 counts | Bins with >2000 counts | High rate bins dominated by noise | Noise dominated (total time) | Noise dominated (detector-on time) | Marked lightcurve |
|---|---|---|---|---|---|---|---|
| A | 44633 | 40555 | 1430 | 1430 | 3.20% | 3.53% | 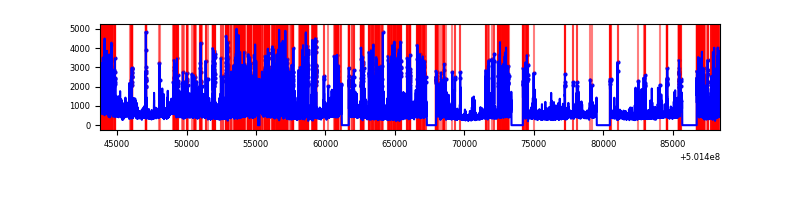 |
| B | 44634 | 40556 | 194 | 194 | 0.43% | 0.48% | 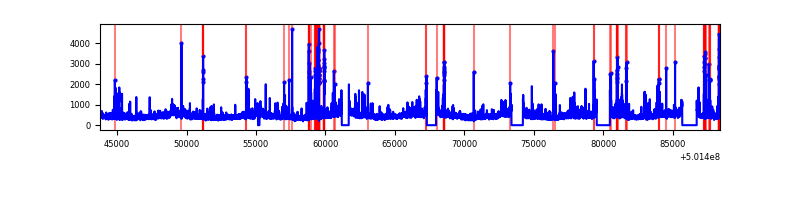 |
| C | 44633 | 40554 | 2111 | 2111 | 4.73% | 5.21% | 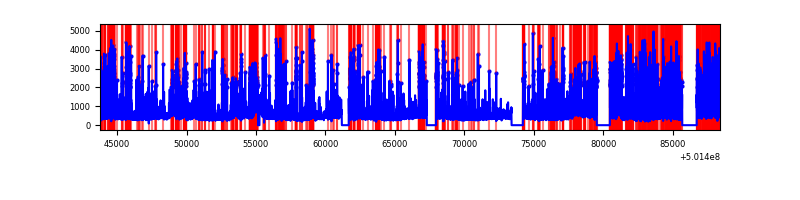 |
| D | 44633 | 40554 | 3504 | 3504 | 7.85% | 8.64% | 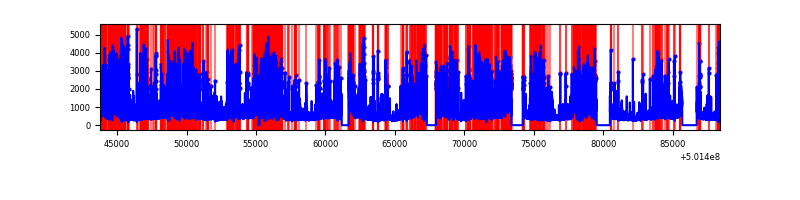 |
Top three noisy pixels from each quadrant. If the there are fewer than three noisy pixels in the level2.evt file, extra rows are filled as -1
| Pixel properties | Quadrant properties | ||||||
|---|---|---|---|---|---|---|---|
| Quadrant | DetID | PixID | Counts | Sigma | Mean | Median | Sigma |
| A | 3 | 14 | 7593517 | 7417.15 | 4177 | 4072 | 1023.2 |
| A | 3 | 45 | 3748918 | 3659.83 | 4177 | 4072 | 1023.2 |
| A | 0 | 8 | 1866197 | 1819.85 | 4177 | 4072 | 1023.2 |
| B | 5 | 236 | 1248782 | 1376.51 | 4213 | 4053 | 904.3 |
| B | 5 | 185 | 830683 | 914.15 | 4213 | 4053 | 904.3 |
| B | 5 | 172 | 649512 | 713.8 | 4213 | 4053 | 904.3 |
| C | 4 | 5 | 6608420 | 6069.16 | 3986 | 3947 | 1088.2 |
| C | 13 | 3 | 1641633 | 1504.95 | 3986 | 3947 | 1088.2 |
| C | 12 | 252 | 1356488 | 1242.91 | 3986 | 3947 | 1088.2 |
| D | 11 | 129 | 5992398 | 5359.15 | 3921 | 3755 | 1117.5 |
| D | 15 | 94 | 3287737 | 2938.79 | 3921 | 3755 | 1117.5 |
| D | 6 | 46 | 1749250 | 1562.02 | 3921 | 3755 | 1117.5 |
Histogram calculated using DETX and DETY for each event in the final _common_clean file
| Quadrant A | 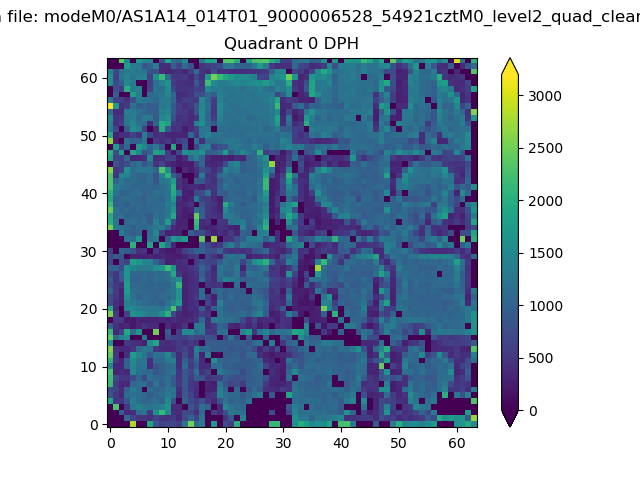 |
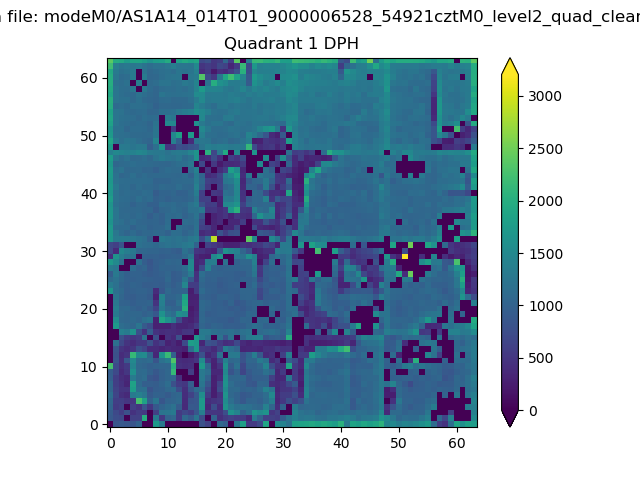 |
Quadrant B |
|---|---|---|---|
| Quadrant D | 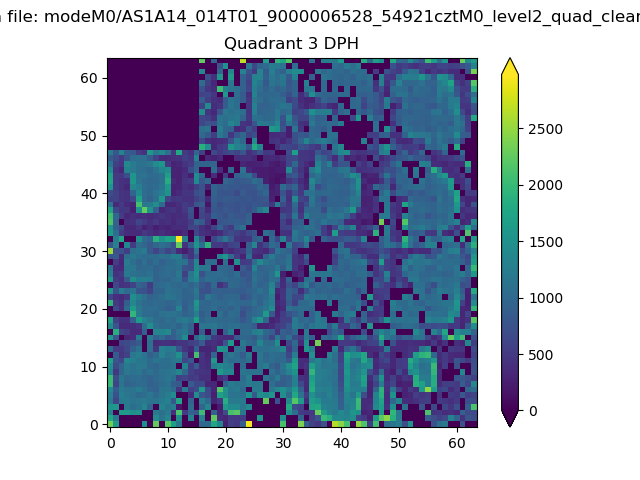 |
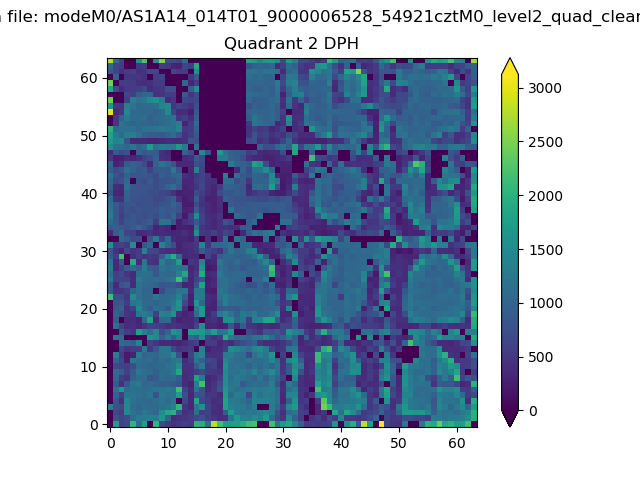 |
Quadrant C |
| Plot type | Count rate plots | Images |
|---|---|---|
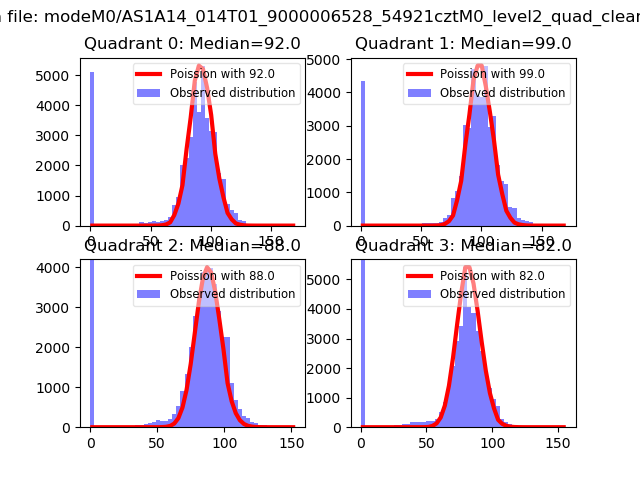
| Comparison with Poisson distribution Blue bars denote a histogram of data divided into 1 sec bins. Red curve is a Poisson curve with rate = median count rate of data. |
 |
 |
| Quadrant-wise count rates Data is divided into 100 sec bins |
 |
|
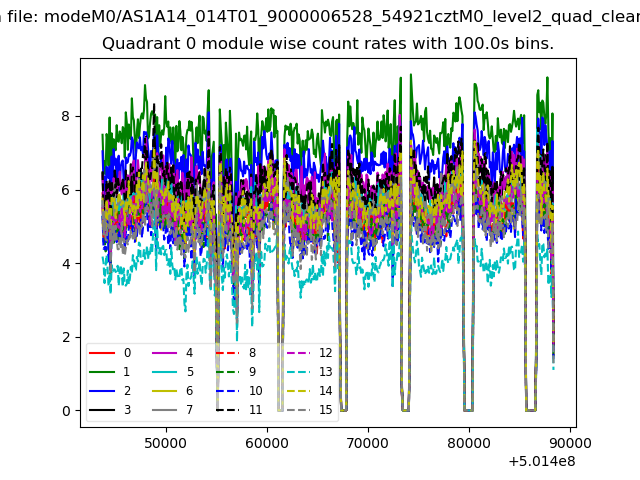
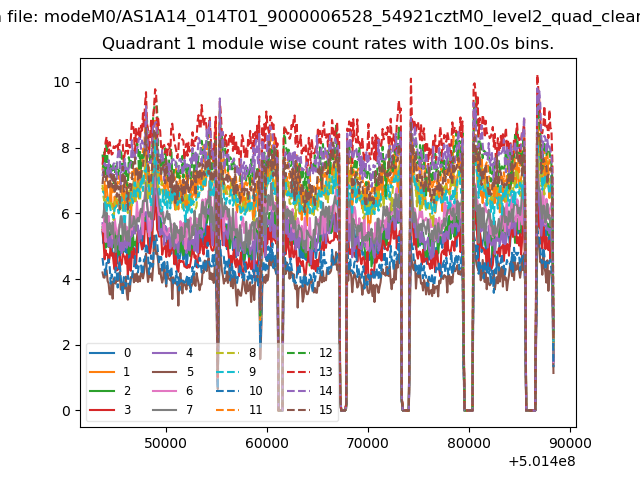
| Module-wise count rates for Quadrant A Data is divided into 100 sec bins |
 |
 |
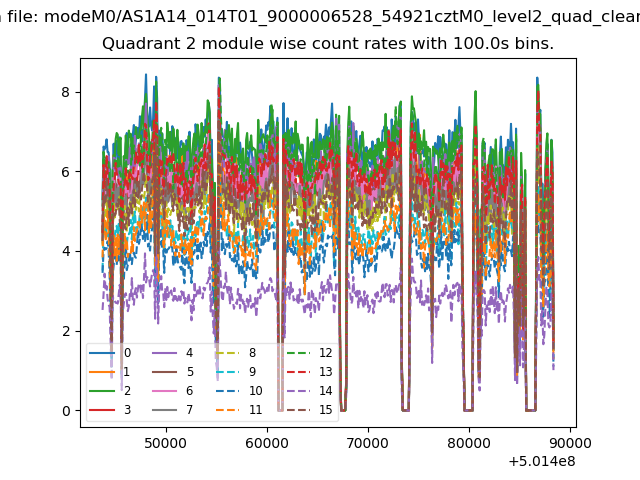
| Module-wise count rates for Quadrant B Data is divided into 100 sec bins |
 |
 |
| Module-wise count rates for Quadrant C Data is divided into 100 sec bins |
 |
 |
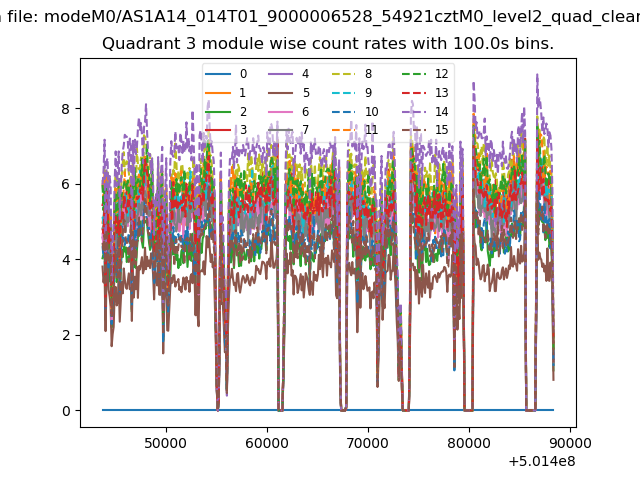
| Module-wise count rates for Quadrant D Data is divided into 100 sec bins |
 |
 |
| Parameter | Plot |
|---|---|
| CZT HV Monitor | 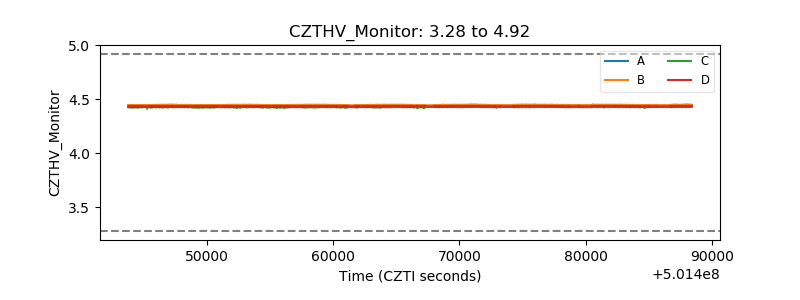 |
| D_VDD | 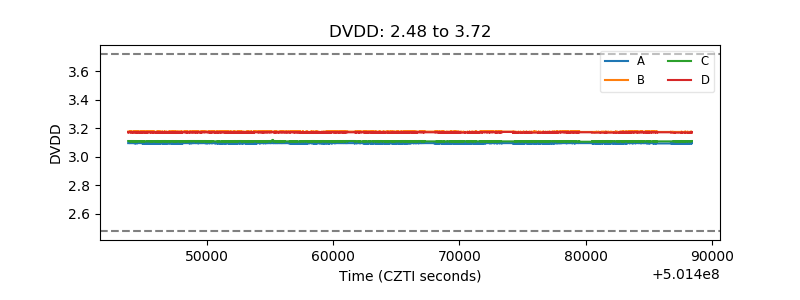 |
| Temperature 1 |  |
| Veto HV Monitor | 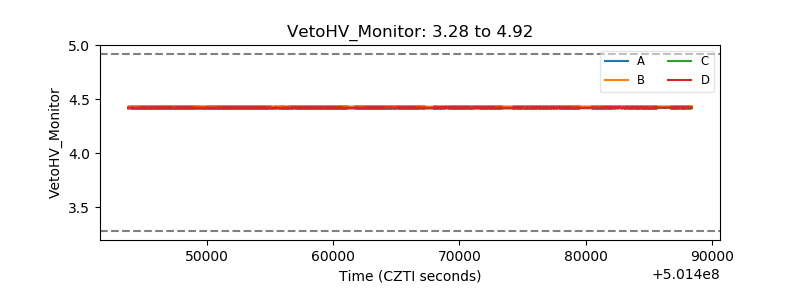 |
| Veto LLD | 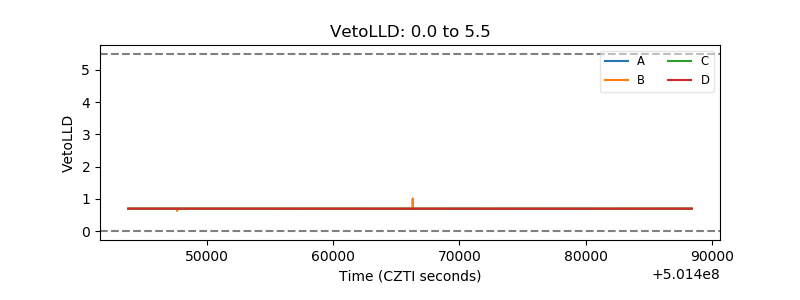 |
| Alpha Counter | 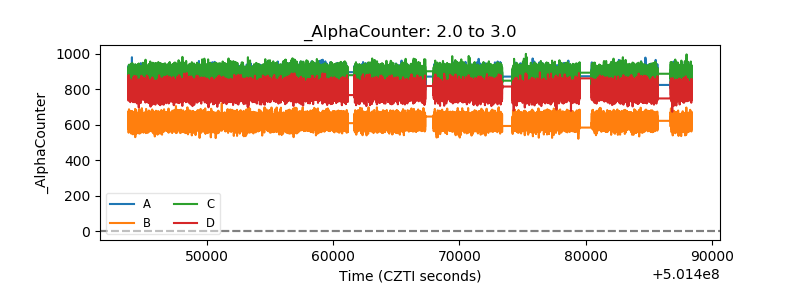 |
| _CPM_Rate | 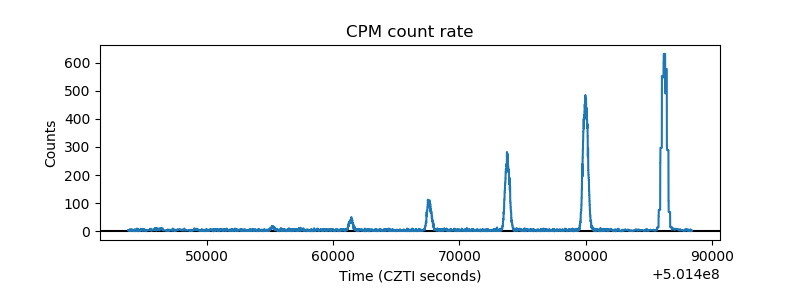 |
| CZT Counter | 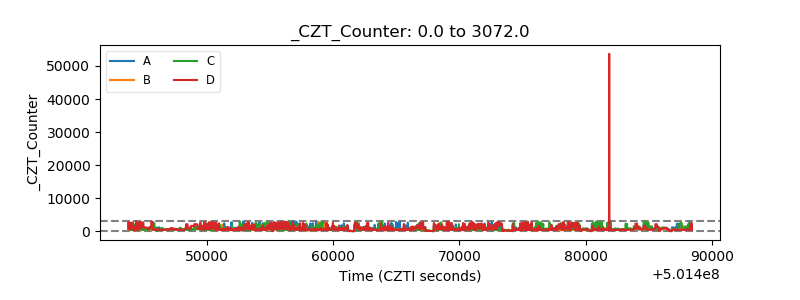 |
| +2.5 Volts monitor |  |
| +5 Volts monitor |  |
| _ROLL_ROT | 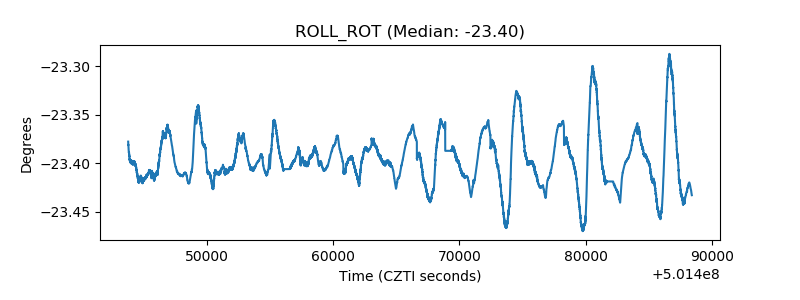 |
| _Roll_DEC | 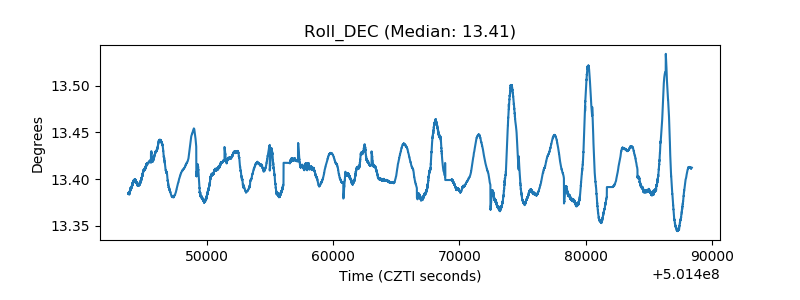 |
| _Roll_RA | 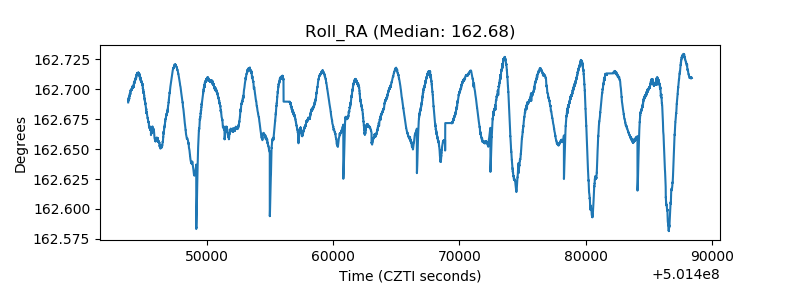 |
| Veto Counter | 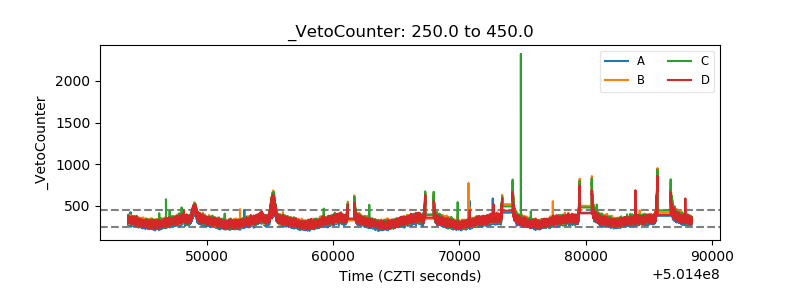 |