| Param | Original file | Final file |
|---|---|---|
| Filename | modeM0/AS1A14_014T01_9000006528_54922cztM0_level2.fits | modeM0/AS1A14_014T01_9000006528_54922cztM0_level2_quad_clean.evt |
| Size (bytes) | 567,472,320 | 88,272,000 |
| Size | 541.2 MB | 84.2 MB |
| Events in quadrant A | 5,103,619 | 591,015 |
| Events in quadrant B | 3,421,338 | 648,470 |
| Events in quadrant C | 7,792,274 | 479,486 |
| Events in quadrant D | 4,206,781 | 519,855 |
| Mode M0 | |||
|---|---|---|---|
| Quadrant | BADHDUFLAG | Total packets | Discarded packets |
| A | 0 | 19653 | 1 |
| B | 0 | 14339 | 1 |
| C | 0 | 27514 | 1 |
| D | 0 | 16910 | 1 |
| Mode SS | |||
|---|---|---|---|
| Quadrant | BADHDUFLAG | Total packets | Discarded packets |
| A | 0 | 126 | 0 |
| B | 0 | 126 | 0 |
| C | 0 | 126 | 0 |
| D | 0 | 126 | 0 |
| Mode M9 | |||
|---|---|---|---|
| Quadrant | BADHDUFLAG | Total packets | Discarded packets |
| A | 0 | 11 | 0 |
| B | 0 | 11 | 0 |
| C | 0 | 11 | 0 |
| D | 0 | 11 | 0 |
| Quadrant | Total seconds | Saturated seconds | Saturation percentage |
|---|---|---|---|
| A | 6216 | 228 | 3.667954% |
| B | 6217 | 111 | 1.785427% |
| C | 6217 | 1398 | 22.486730% |
| D | 6217 | 340 | 5.468876% |
Noise dominated data is calculated using 1-second bins in cleaned event files. If a bin has >2000 counts, and if more than 50% of those come from <1% of pixels, then it is considered to be noise-dominated and hence unusable.
| Quadrant | # 1 sec bins | Bins with >0 counts | Bins with >2000 counts | High rate bins dominated by noise | Noise dominated (total time) | Noise dominated (detector-on time) | Marked lightcurve |
|---|---|---|---|---|---|---|---|
| A | 7336 | 6217 | 185 | 185 | 2.52% | 2.98% |  |
| B | 7337 | 6218 | 53 | 53 | 0.72% | 0.85% | 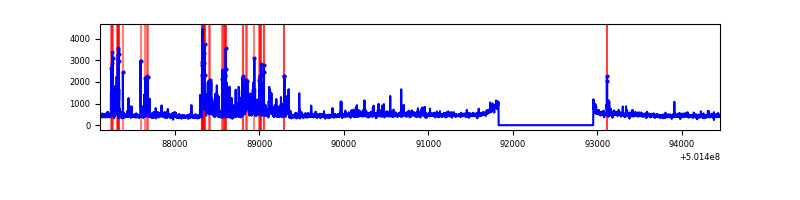 |
| C | 7337 | 6218 | 1079 | 1079 | 14.71% | 17.35% | 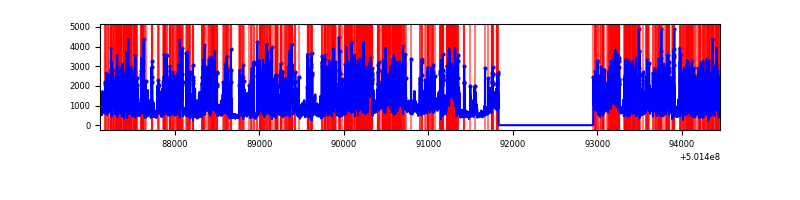 |
| D | 7337 | 6218 | 289 | 289 | 3.94% | 4.65% | 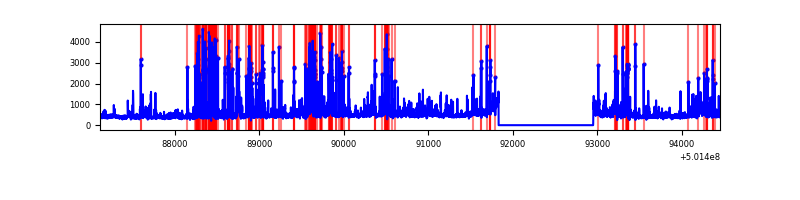 |
Top three noisy pixels from each quadrant. If the there are fewer than three noisy pixels in the level2.evt file, extra rows are filled as -1
| Pixel properties | Quadrant properties | ||||||
|---|---|---|---|---|---|---|---|
| Quadrant | DetID | PixID | Counts | Sigma | Mean | Median | Sigma |
| A | 3 | 14 | 1784655 | 10881.65 | 660 | 642 | 163.9 |
| A | 0 | 8 | 301178 | 1833.13 | 660 | 642 | 163.9 |
| A | 3 | 45 | 284565 | 1731.8 | 660 | 642 | 163.9 |
| B | 5 | 185 | 589433 | 4153.04 | 656 | 633 | 141.8 |
| B | 5 | 236 | 172190 | 1210.06 | 656 | 633 | 141.8 |
| B | 5 | 172 | 31447 | 217.34 | 656 | 633 | 141.8 |
| C | 4 | 5 | 3918324 | 23883.92 | 590 | 584 | 164.0 |
| C | 12 | 252 | 950992 | 5794.02 | 590 | 584 | 164.0 |
| C | 13 | 3 | 292958 | 1782.41 | 590 | 584 | 164.0 |
| D | 15 | 94 | 693762 | 3869.37 | 631 | 603 | 179.1 |
| D | 6 | 239 | 280370 | 1561.72 | 631 | 603 | 179.1 |
| D | 3 | 224 | 212303 | 1181.76 | 631 | 603 | 179.1 |
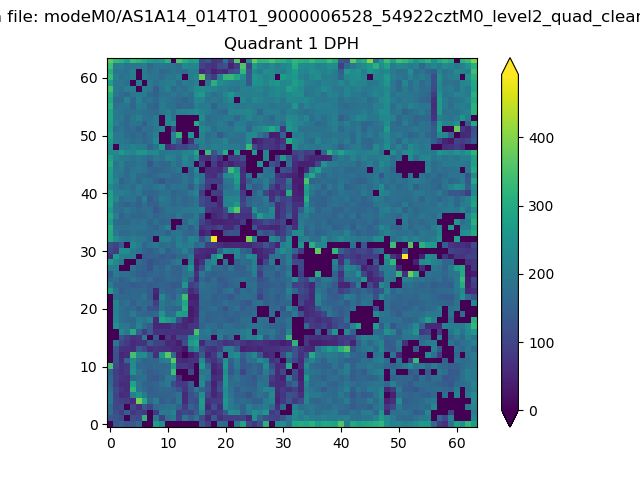
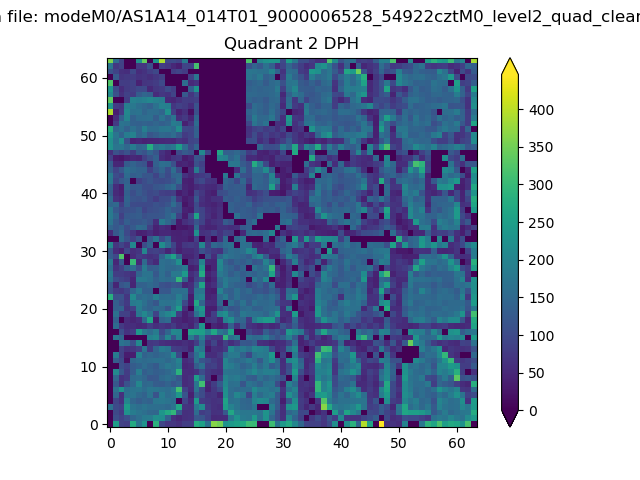
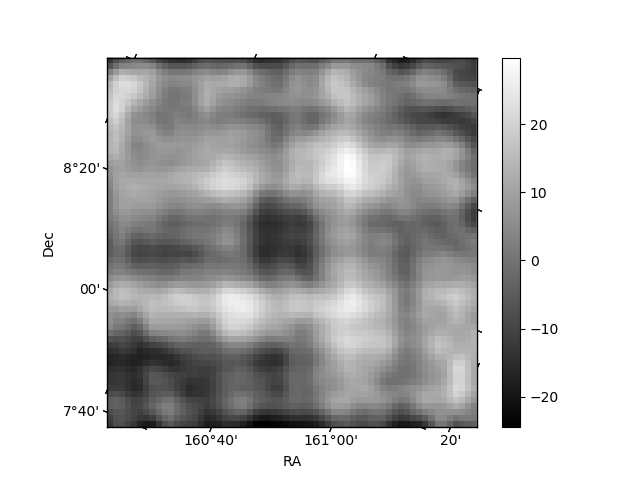
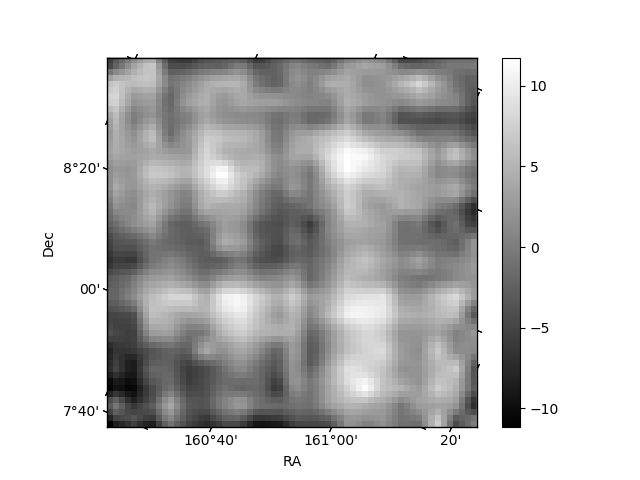
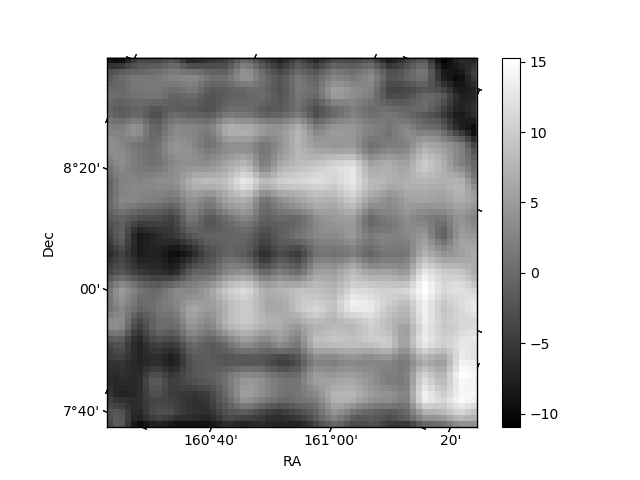
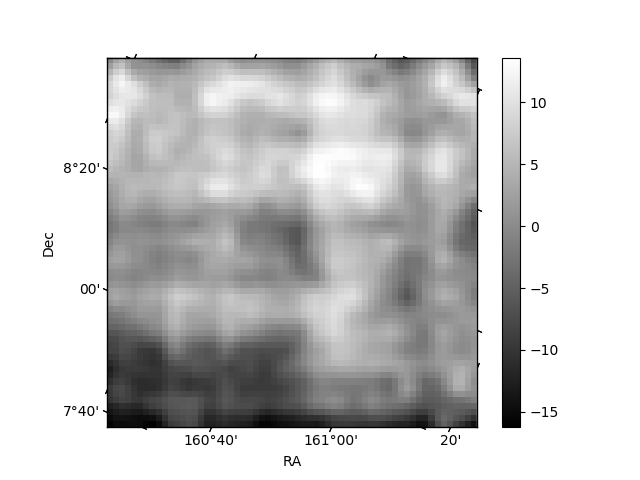
Histogram calculated using DETX and DETY for each event in the final _common_clean file
| Quadrant A | 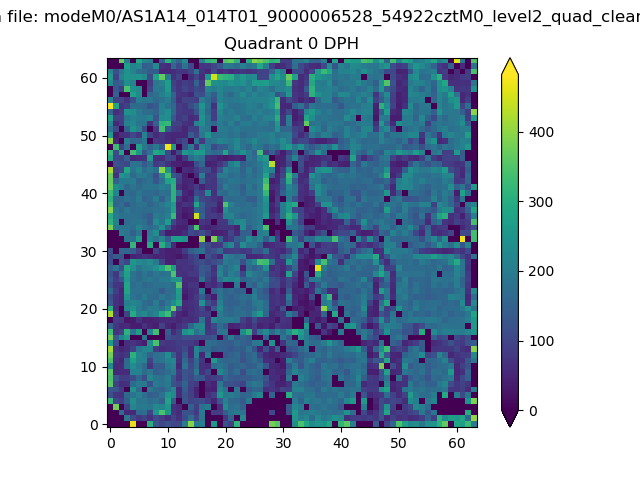 |
 |
Quadrant B |
|---|---|---|---|
| Quadrant D | 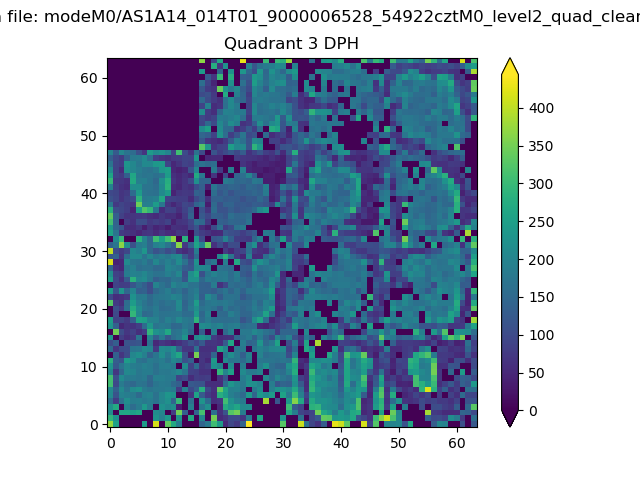 |
 |
Quadrant C |
| Plot type | Count rate plots | Images |
|---|---|---|
| Comparison with Poisson distribution Blue bars denote a histogram of data divided into 1 sec bins. Red curve is a Poisson curve with rate = median count rate of data. |
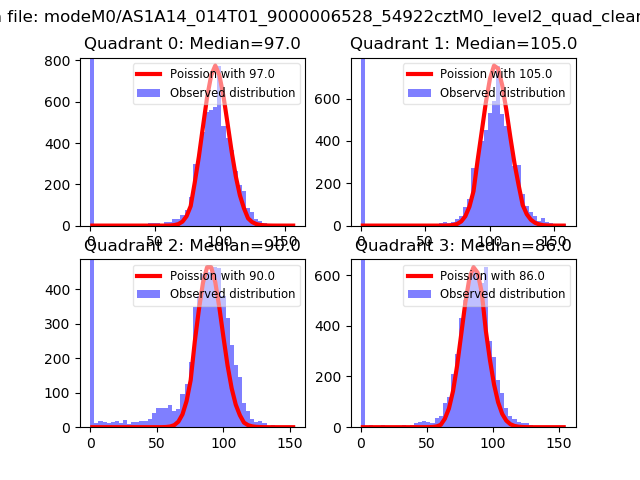 |
 |
| Quadrant-wise count rates Data is divided into 100 sec bins |
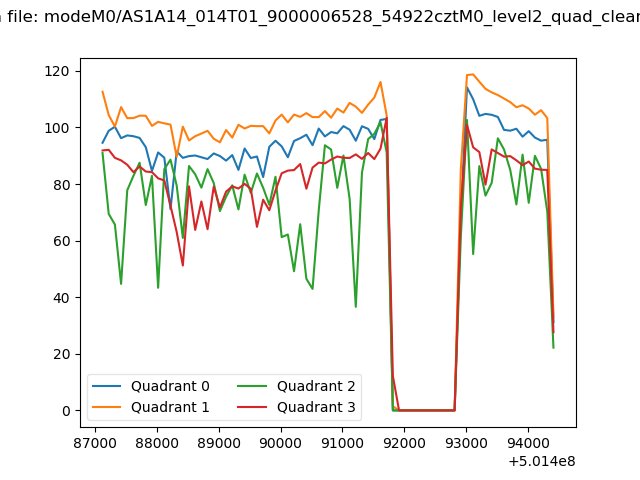 |
|
| Module-wise count rates for Quadrant A Data is divided into 100 sec bins |
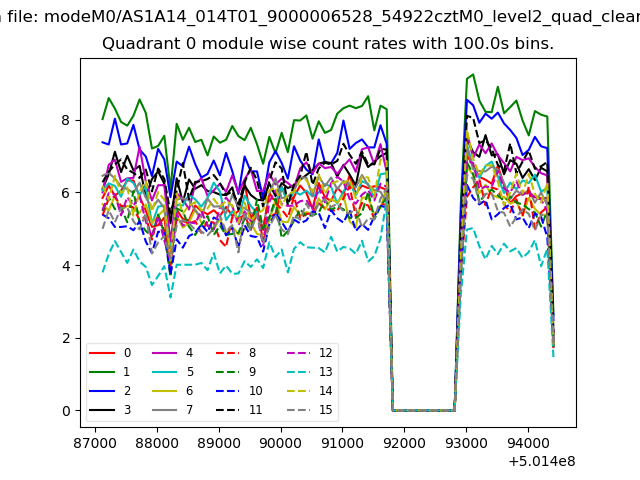 |
 |
| Module-wise count rates for Quadrant B Data is divided into 100 sec bins |
 |
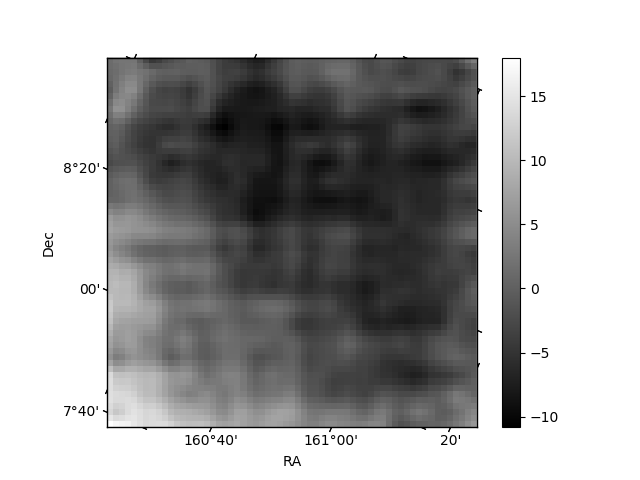 |
| Module-wise count rates for Quadrant C Data is divided into 100 sec bins |
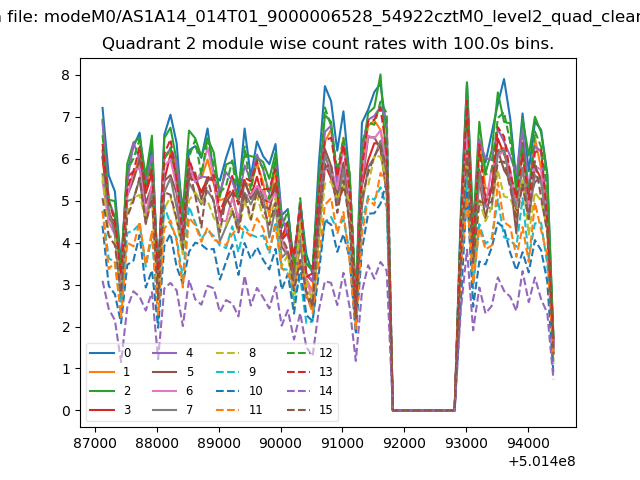 |
 |
| Module-wise count rates for Quadrant D Data is divided into 100 sec bins |
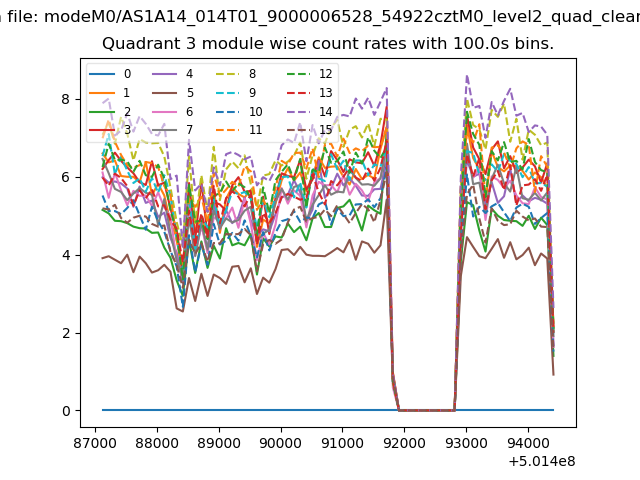 |
 |
| Parameter | Plot |
|---|---|
| CZT HV Monitor | 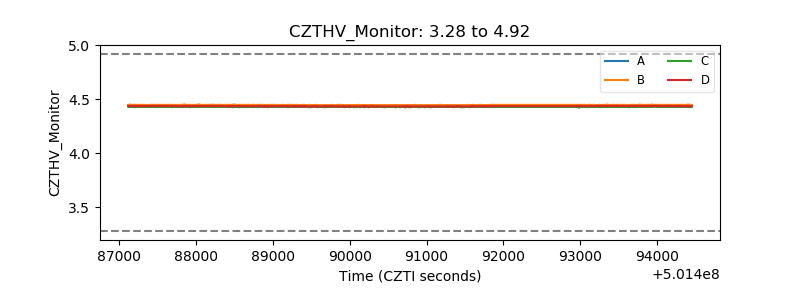 |
| D_VDD |  |
| Temperature 1 | 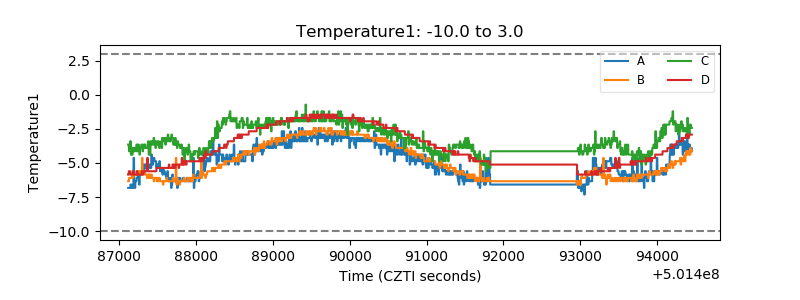 |
| Veto HV Monitor | 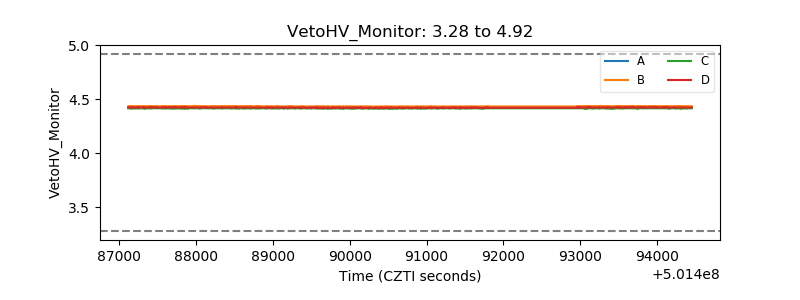 |
| Veto LLD | 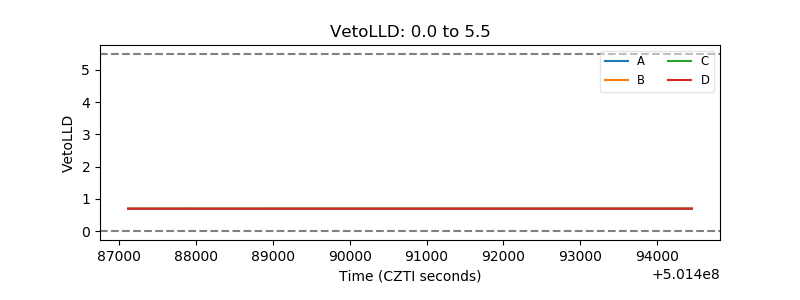 |
| Alpha Counter | 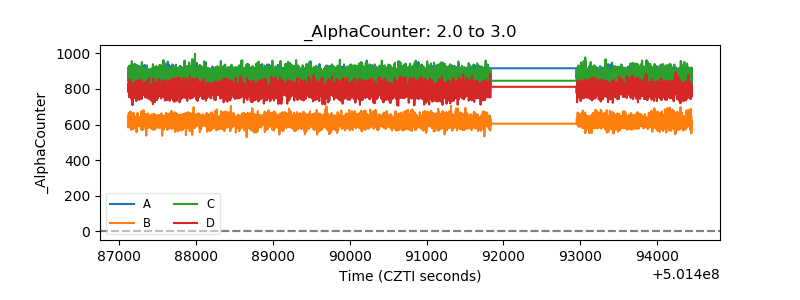 |
| _CPM_Rate | 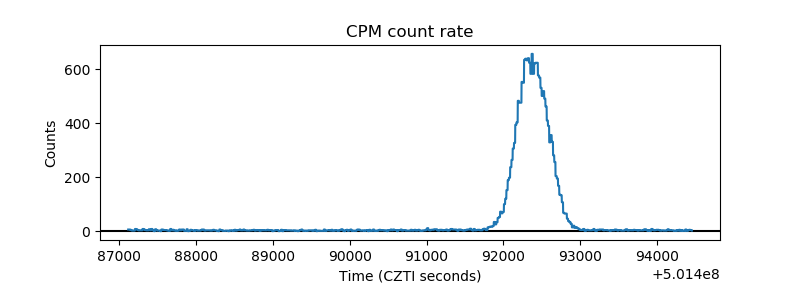 |
| CZT Counter | 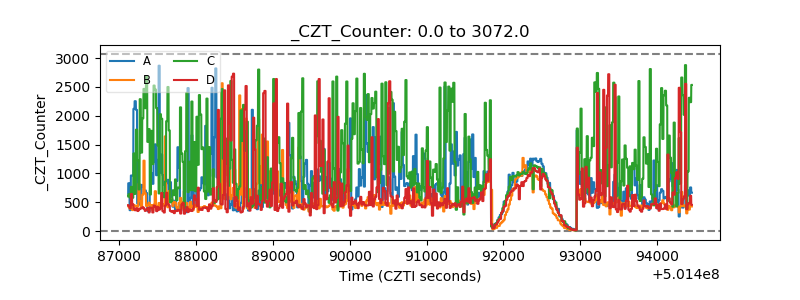 |
| +2.5 Volts monitor |  |
| +5 Volts monitor |  |
| _ROLL_ROT | 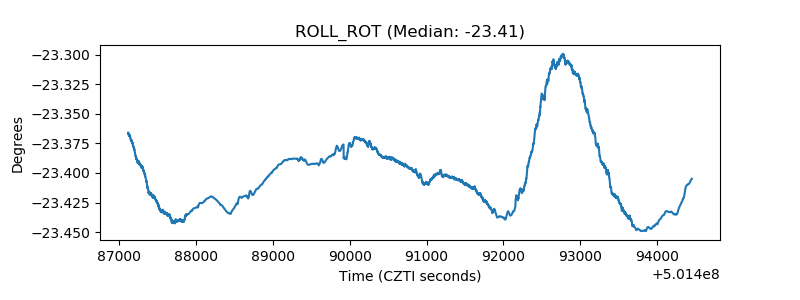 |
| _Roll_DEC | 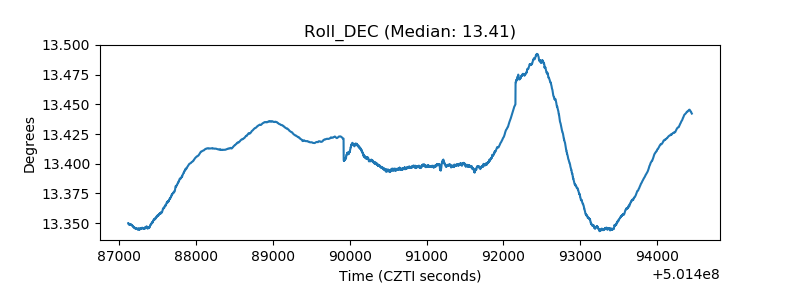 |
| _Roll_RA | 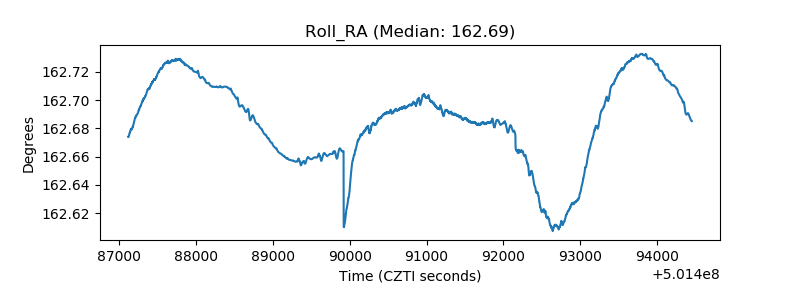 |
| Veto Counter | 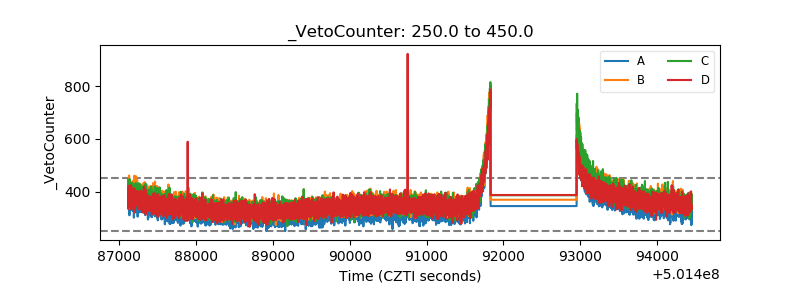 |