| Param | Original file | Final file |
|---|---|---|
| Filename | modeM0/AS1A14_014T01_9000006528_54923cztM0_level2.fits | modeM0/AS1A14_014T01_9000006528_54923cztM0_level2_quad_clean.evt |
| Size (bytes) | 494,864,640 | 95,103,360 |
| Size | 471.9 MB | 90.7 MB |
| Events in quadrant A | 3,638,336 | 636,078 |
| Events in quadrant B | 3,117,546 | 689,532 |
| Events in quadrant C | 6,971,003 | 540,949 |
| Events in quadrant D | 4,088,449 | 561,373 |
| Mode M0 | |||
|---|---|---|---|
| Quadrant | BADHDUFLAG | Total packets | Discarded packets |
| A | 0 | 15307 | 2 |
| B | 0 | 13598 | 11 |
| C | 0 | 25216 | 45 |
| D | 0 | 16527 | 18 |
| Mode SS | |||
|---|---|---|---|
| Quadrant | BADHDUFLAG | Total packets | Discarded packets |
| A | 0 | 132 | 0 |
| B | 0 | 132 | 0 |
| C | 0 | 132 | 0 |
| D | 0 | 132 | 0 |
| Mode M9 | |||
|---|---|---|---|
| Quadrant | BADHDUFLAG | Total packets | Discarded packets |
| A | 0 | 12 | 0 |
| B | 0 | 13 | 0 |
| C | 0 | 13 | 0 |
| D | 0 | 13 | 0 |
| Quadrant | Total seconds | Saturated seconds | Saturation percentage |
|---|---|---|---|
| A | 6481 | 100 | 1.542972% |
| B | 6475 | 68 | 1.050193% |
| C | 6472 | 1047 | 16.177379% |
| D | 6475 | 184 | 2.841699% |
Noise dominated data is calculated using 1-second bins in cleaned event files. If a bin has >2000 counts, and if more than 50% of those come from <1% of pixels, then it is considered to be noise-dominated and hence unusable.
| Quadrant | # 1 sec bins | Bins with >0 counts | Bins with >2000 counts | High rate bins dominated by noise | Noise dominated (total time) | Noise dominated (detector-on time) | Marked lightcurve |
|---|---|---|---|---|---|---|---|
| A | 7606 | 6482 | 37 | 37 | 0.49% | 0.57% | 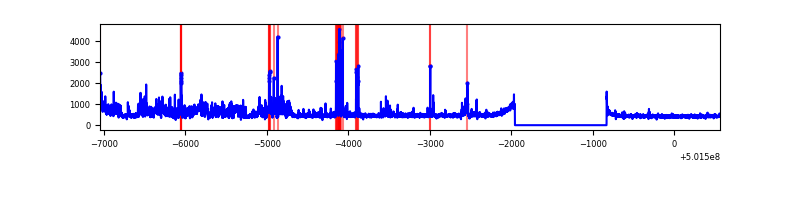 |
| B | 7606 | 6479 | 3 | 3 | 0.04% | 0.05% | 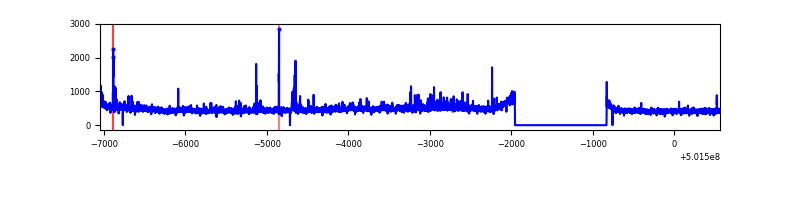 |
| C | 7606 | 6477 | 878 | 878 | 11.54% | 13.56% | 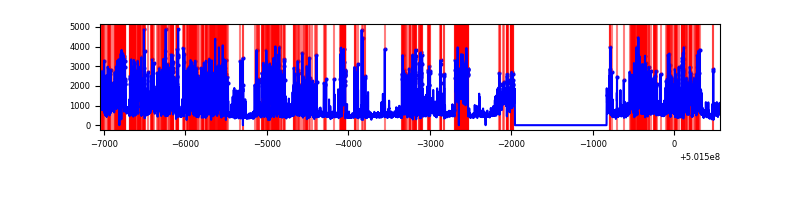 |
| D | 7606 | 6480 | 139 | 139 | 1.83% | 2.15% | 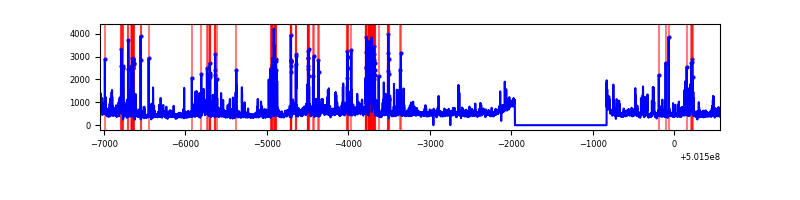 |
Top three noisy pixels from each quadrant. If the there are fewer than three noisy pixels in the level2.evt file, extra rows are filled as -1
| Pixel properties | Quadrant properties | ||||||
|---|---|---|---|---|---|---|---|
| Quadrant | DetID | PixID | Counts | Sigma | Mean | Median | Sigma |
| A | 3 | 14 | 597217 | 3361.12 | 711 | 693 | 177.5 |
| A | 3 | 45 | 187965 | 1055.19 | 711 | 693 | 177.5 |
| A | 0 | 8 | 24223 | 132.58 | 711 | 693 | 177.5 |
| B | 5 | 172 | 207842 | 1398.92 | 700 | 678 | 148.1 |
| B | 5 | 236 | 86855 | 581.93 | 700 | 678 | 148.1 |
| B | 12 | 111 | 18057 | 117.36 | 700 | 678 | 148.1 |
| C | 4 | 5 | 3564100 | 19978.65 | 644 | 638 | 178.4 |
| C | 12 | 252 | 455038 | 2547.61 | 644 | 638 | 178.4 |
| C | 13 | 3 | 168809 | 942.86 | 644 | 638 | 178.4 |
| D | 6 | 239 | 251775 | 1294.5 | 680 | 649 | 194.0 |
| D | 11 | 129 | 218526 | 1123.11 | 680 | 649 | 194.0 |
| D | 15 | 94 | 184019 | 945.23 | 680 | 649 | 194.0 |
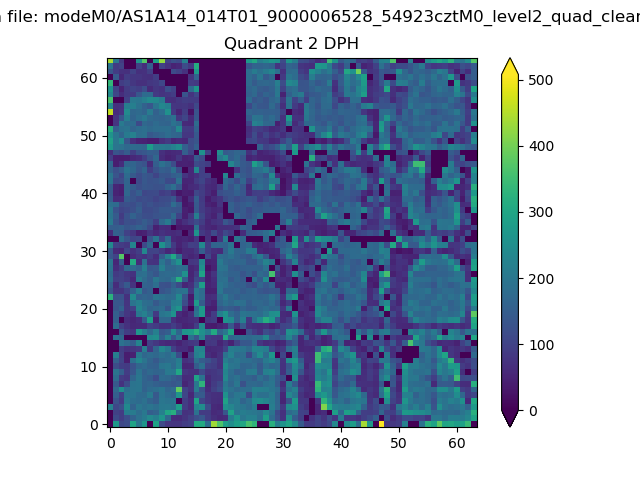
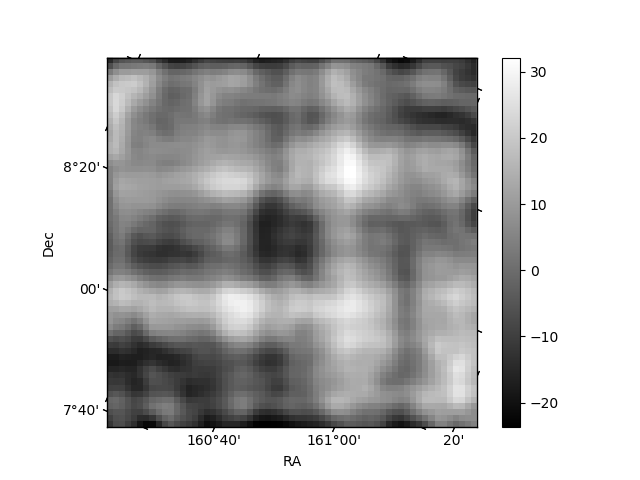
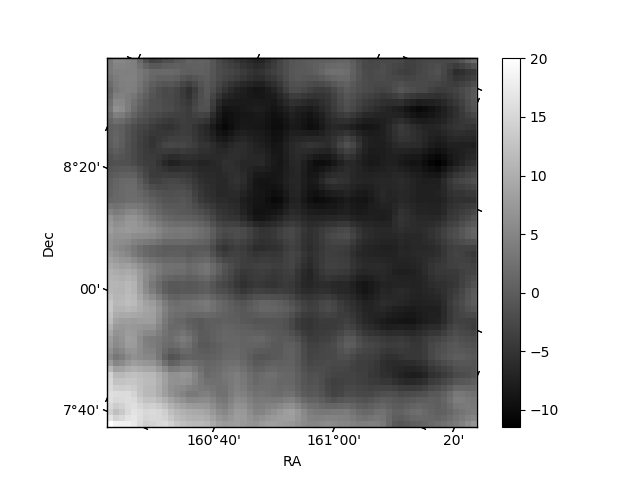
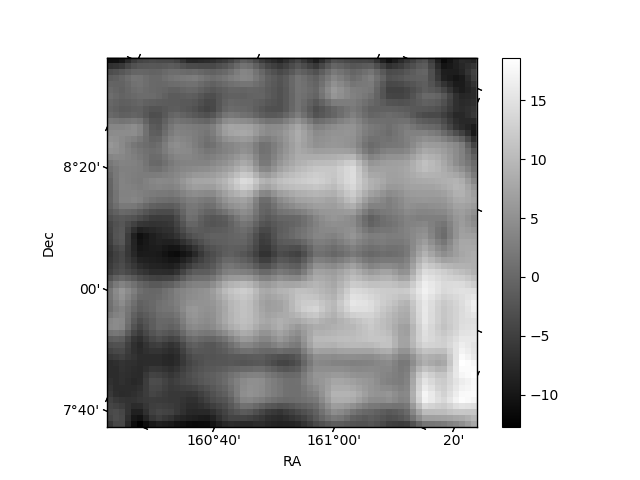
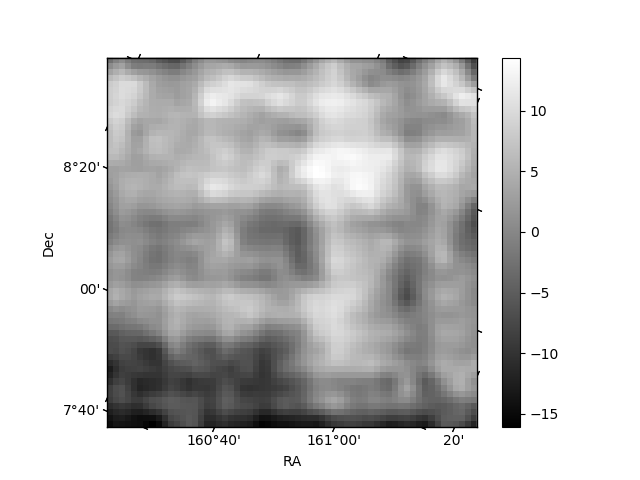
Histogram calculated using DETX and DETY for each event in the final _common_clean file
| Quadrant A | 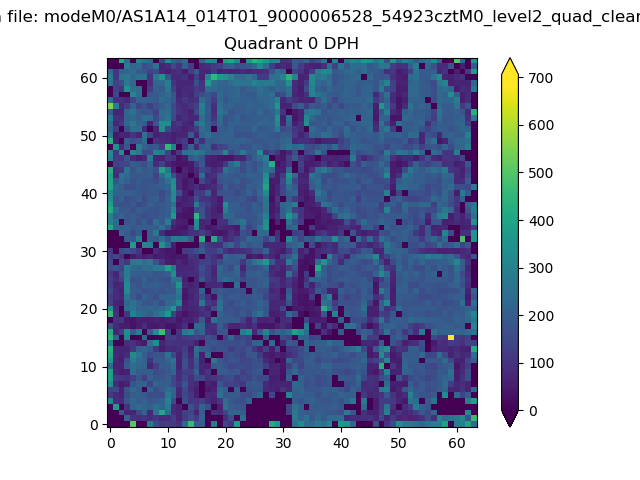 |
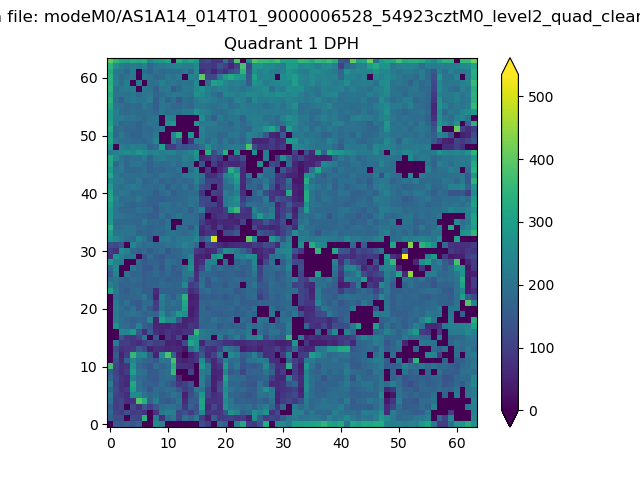 |
Quadrant B |
|---|---|---|---|
| Quadrant D | 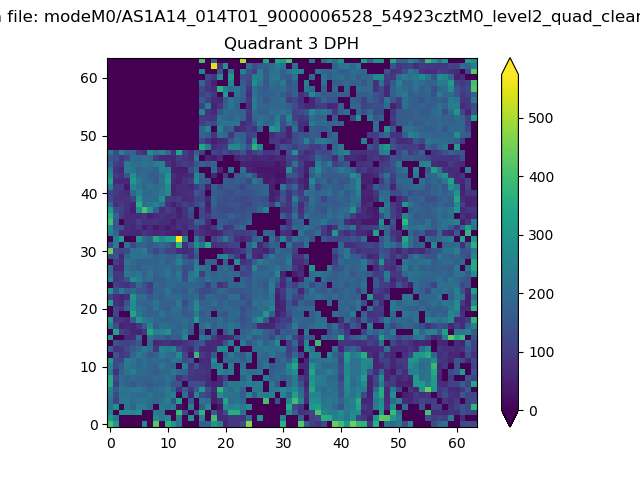 |
 |
Quadrant C |
| Plot type | Count rate plots | Images |
|---|---|---|
| Comparison with Poisson distribution Blue bars denote a histogram of data divided into 1 sec bins. Red curve is a Poisson curve with rate = median count rate of data. |
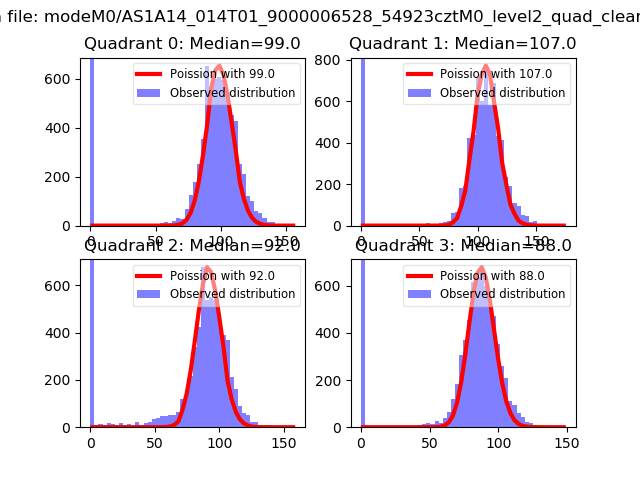 |
 |
| Quadrant-wise count rates Data is divided into 100 sec bins |
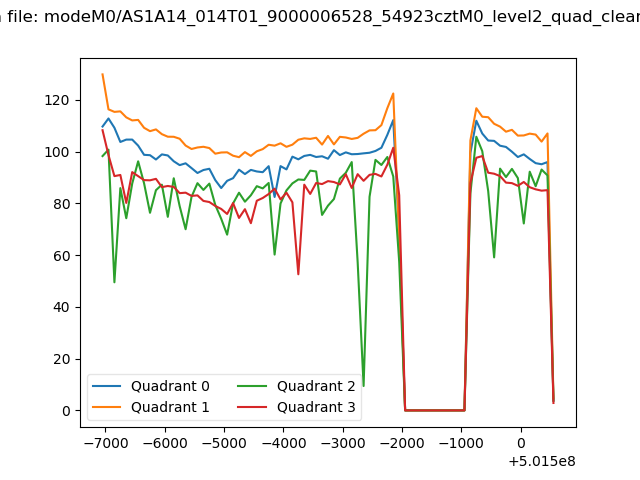 |
|
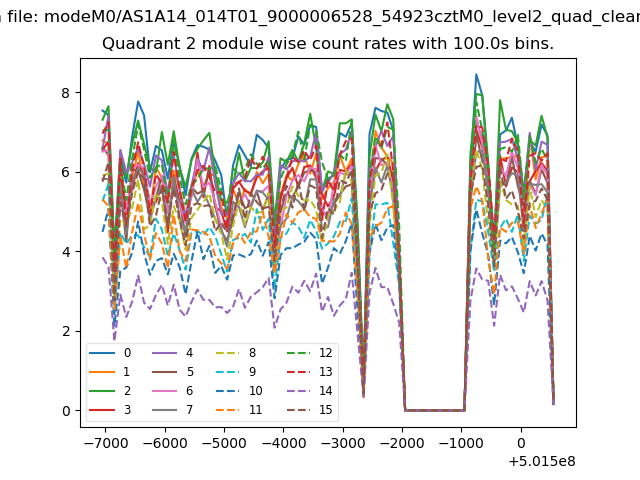
| Module-wise count rates for Quadrant A Data is divided into 100 sec bins |
 |
 |
| Module-wise count rates for Quadrant B Data is divided into 100 sec bins |
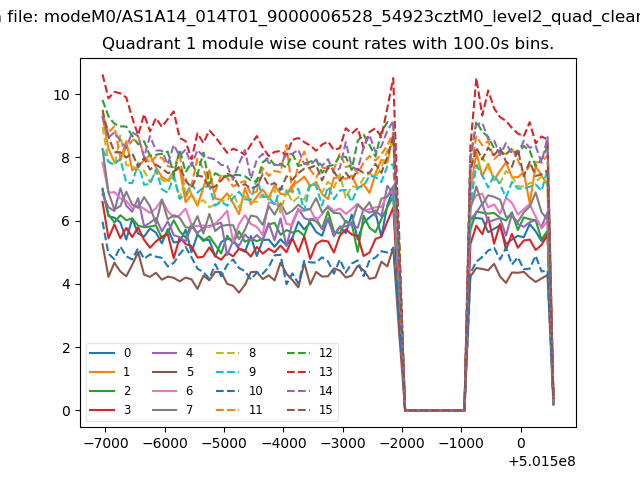 |
 |
| Module-wise count rates for Quadrant C Data is divided into 100 sec bins |
 |
 |
| Module-wise count rates for Quadrant D Data is divided into 100 sec bins |
 |
 |
| Parameter | Plot |
|---|---|
| CZT HV Monitor | 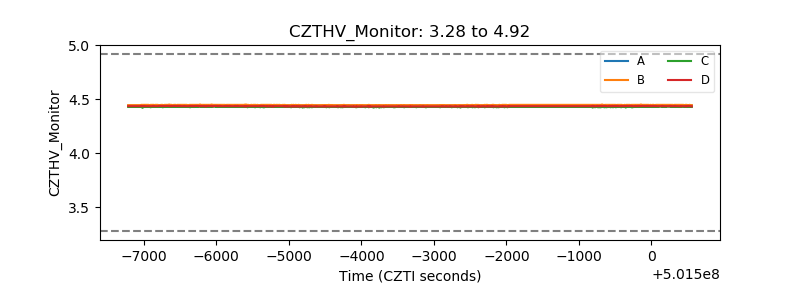 |
| D_VDD | 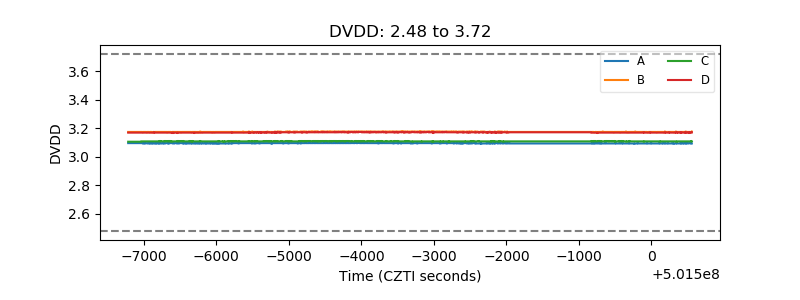 |
| Temperature 1 | 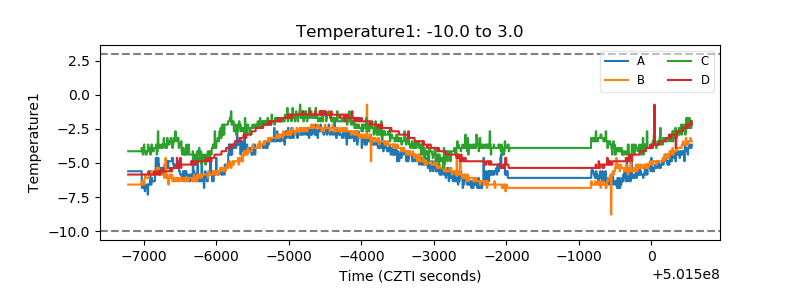 |
| Veto HV Monitor | 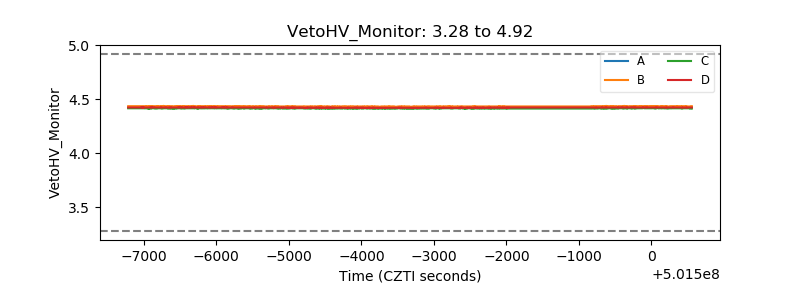 |
| Veto LLD | 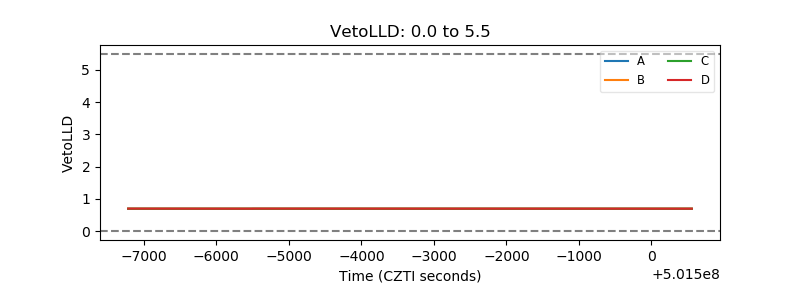 |
| Alpha Counter | 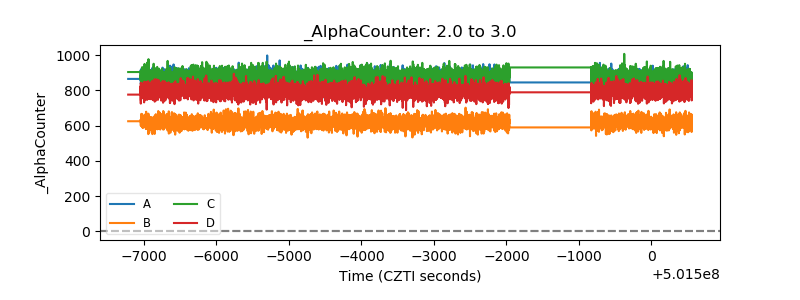 |
| _CPM_Rate | 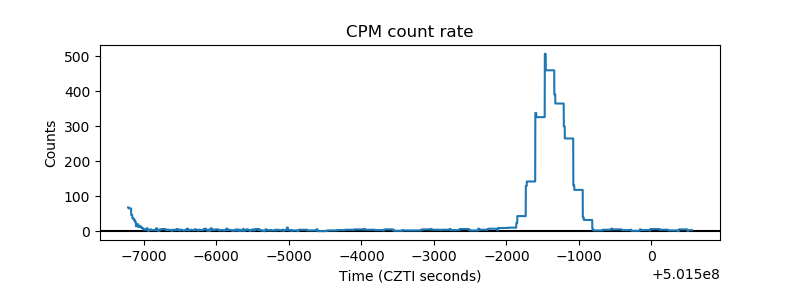 |
| CZT Counter | 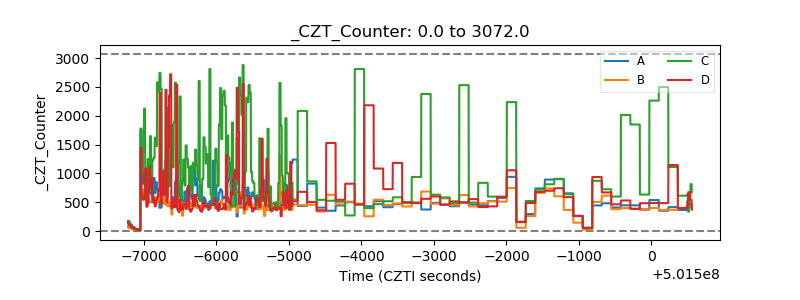 |
| +2.5 Volts monitor |  |
| +5 Volts monitor |  |
| _ROLL_ROT | 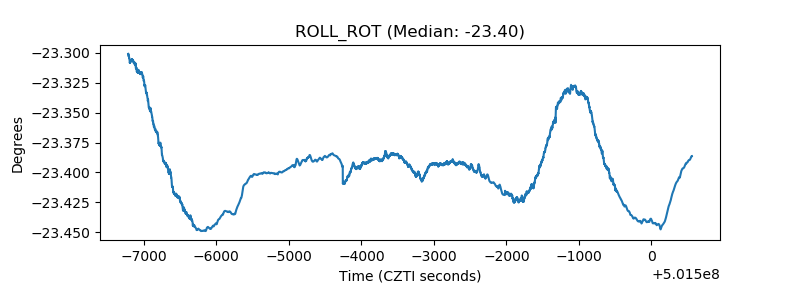 |
| _Roll_DEC | 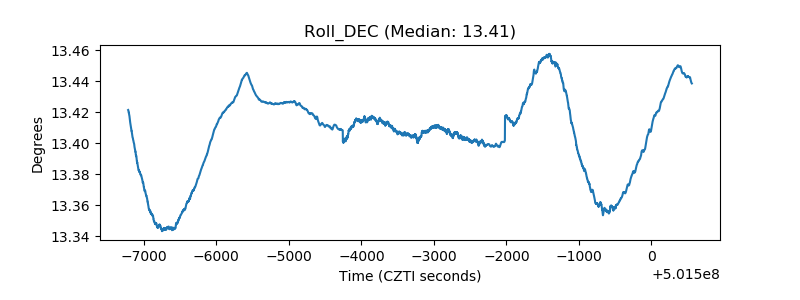 |
| _Roll_RA | 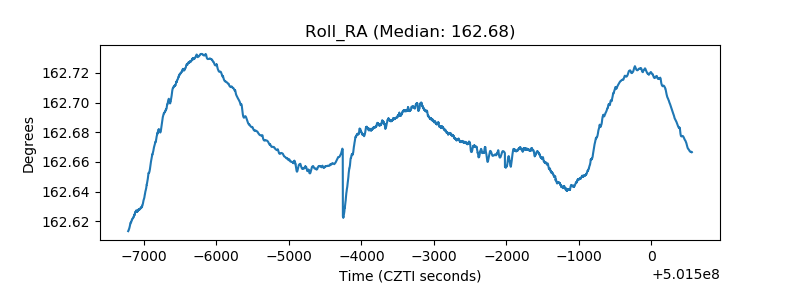 |
| Veto Counter |  |