| Param | Original file | Final file |
|---|---|---|
| Filename | modeM0/AS1A14_014T01_9000006528_54925cztM0_level2.fits | modeM0/AS1A14_014T01_9000006528_54925cztM0_level2_quad_clean.evt |
| Size (bytes) | 561,864,960 | 89,222,400 |
| Size | 535.8 MB | 85.1 MB |
| Events in quadrant A | 3,367,026 | 607,917 |
| Events in quadrant B | 2,884,060 | 662,860 |
| Events in quadrant C | 5,882,489 | 543,902 |
| Events in quadrant D | 8,153,231 | 427,486 |
| Mode M0 | |||
|---|---|---|---|
| Quadrant | BADHDUFLAG | Total packets | Discarded packets |
| A | 0 | 14623 | 1 |
| B | 0 | 13597 | 1 |
| C | 0 | 21908 | 2 |
| D | 0 | 28753 | 7 |
| Mode SS | |||
|---|---|---|---|
| Quadrant | BADHDUFLAG | Total packets | Discarded packets |
| A | 0 | 134 | 0 |
| B | 0 | 134 | 0 |
| C | 0 | 134 | 0 |
| D | 0 | 134 | 0 |
| Mode M9 | |||
|---|---|---|---|
| Quadrant | BADHDUFLAG | Total packets | Discarded packets |
| A | 0 | 8 | 0 |
| B | 0 | 8 | 0 |
| C | 0 | 8 | 0 |
| D | 0 | 8 | 0 |
| Quadrant | Total seconds | Saturated seconds | Saturation percentage |
|---|---|---|---|
| A | 6586 | 209 | 3.173398% |
| B | 6586 | 137 | 2.080170% |
| C | 6586 | 753 | 11.433343% |
| D | 6586 | 1696 | 25.751594% |
Noise dominated data is calculated using 1-second bins in cleaned event files. If a bin has >2000 counts, and if more than 50% of those come from <1% of pixels, then it is considered to be noise-dominated and hence unusable.
| Quadrant | # 1 sec bins | Bins with >0 counts | Bins with >2000 counts | High rate bins dominated by noise | Noise dominated (total time) | Noise dominated (detector-on time) | Marked lightcurve |
|---|---|---|---|---|---|---|---|
| A | 7407 | 6587 | 72 | 72 | 0.97% | 1.09% | 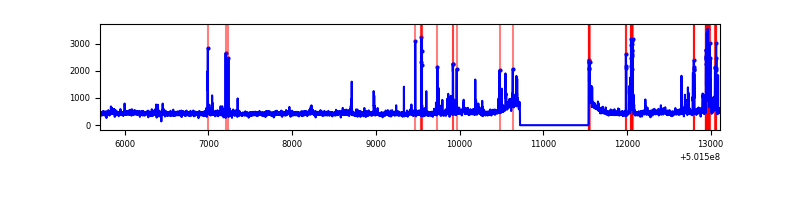 |
| B | 7407 | 6587 | 4 | 4 | 0.05% | 0.06% | 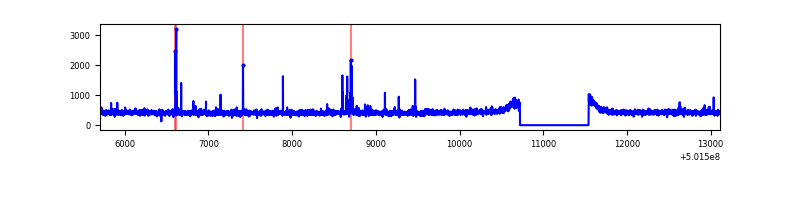 |
| C | 7408 | 6587 | 550 | 550 | 7.42% | 8.35% | 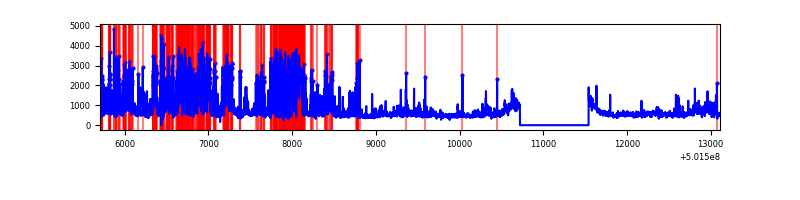 |
| D | 7406 | 6586 | 1489 | 1489 | 20.11% | 22.61% | 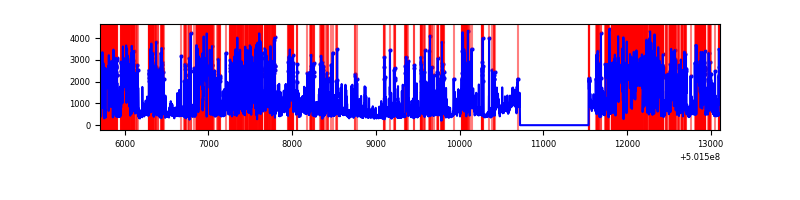 |
Top three noisy pixels from each quadrant. If the there are fewer than three noisy pixels in the level2.evt file, extra rows are filled as -1
| Pixel properties | Quadrant properties | ||||||
|---|---|---|---|---|---|---|---|
| Quadrant | DetID | PixID | Counts | Sigma | Mean | Median | Sigma |
| A | 3 | 45 | 352346 | 1999.26 | 714 | 693 | 175.9 |
| A | 3 | 14 | 126416 | 714.78 | 714 | 693 | 175.9 |
| A | 4 | 78 | 36154 | 201.61 | 714 | 693 | 175.9 |
| B | 7 | 252 | 32667 | 211.65 | 704 | 678 | 151.1 |
| B | 12 | 111 | 18735 | 119.47 | 704 | 678 | 151.1 |
| B | 11 | 111 | 17458 | 111.02 | 704 | 678 | 151.1 |
| C | 4 | 5 | 2102048 | 11551.32 | 668 | 661 | 181.9 |
| C | 12 | 252 | 516042 | 2833.05 | 668 | 661 | 181.9 |
| C | 9 | 38 | 291673 | 1599.69 | 668 | 661 | 181.9 |
| D | 15 | 94 | 2630279 | 15095.93 | 613 | 584 | 174.2 |
| D | 3 | 224 | 768253 | 4406.85 | 613 | 584 | 174.2 |
| D | 6 | 239 | 569087 | 3263.53 | 613 | 584 | 174.2 |
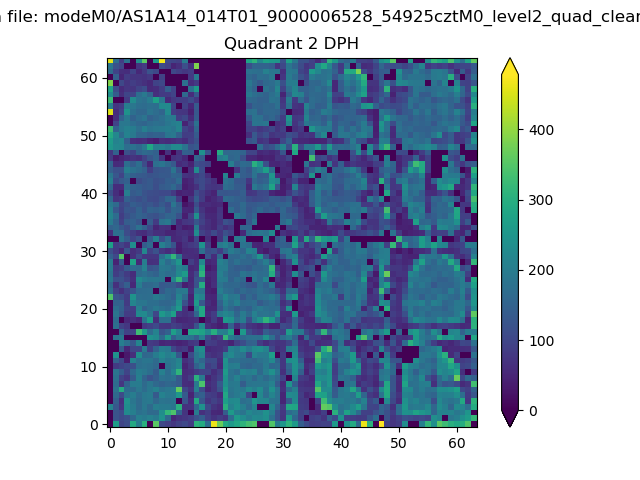
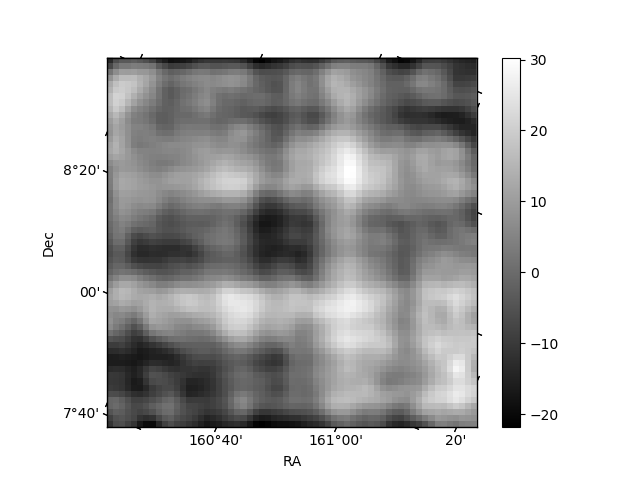
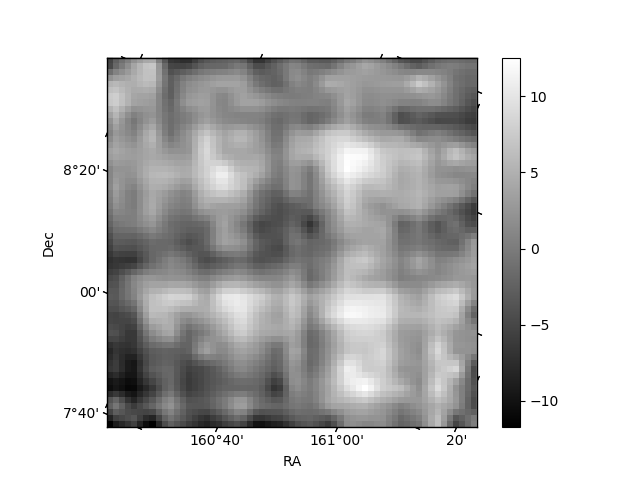
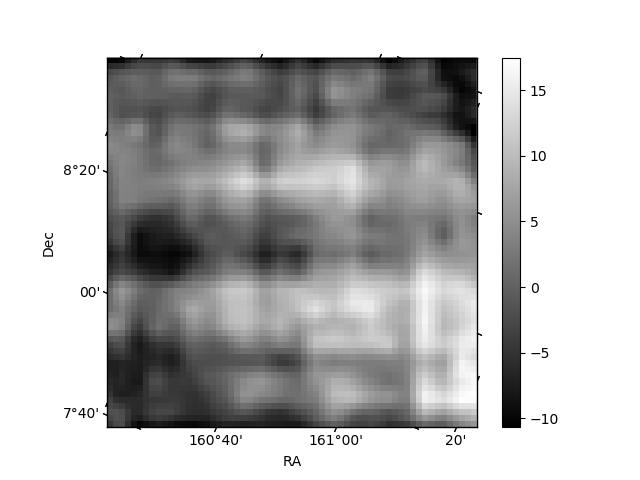
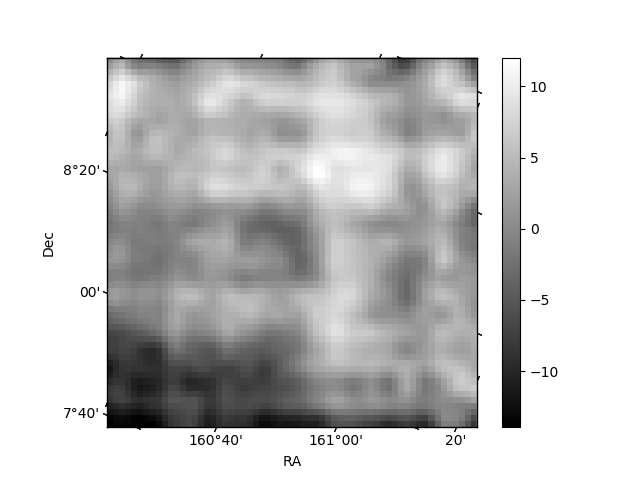
Histogram calculated using DETX and DETY for each event in the final _common_clean file
| Quadrant A | 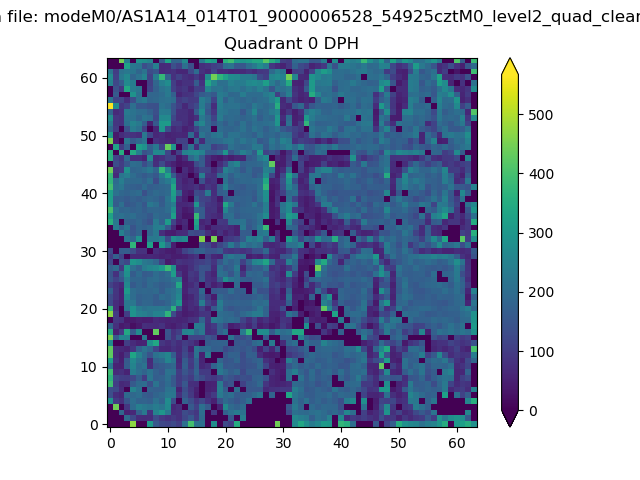 |
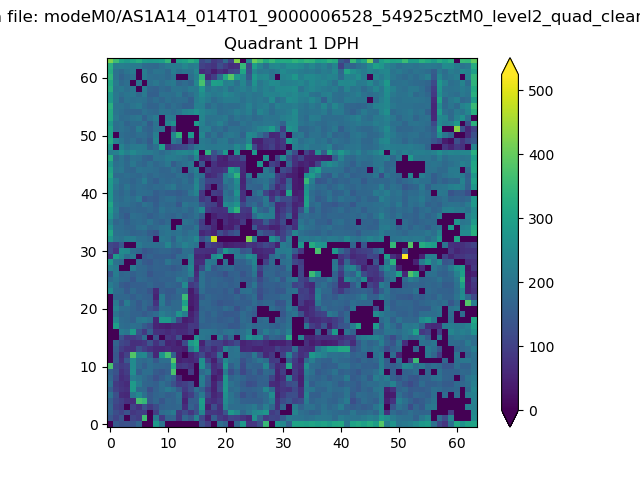 |
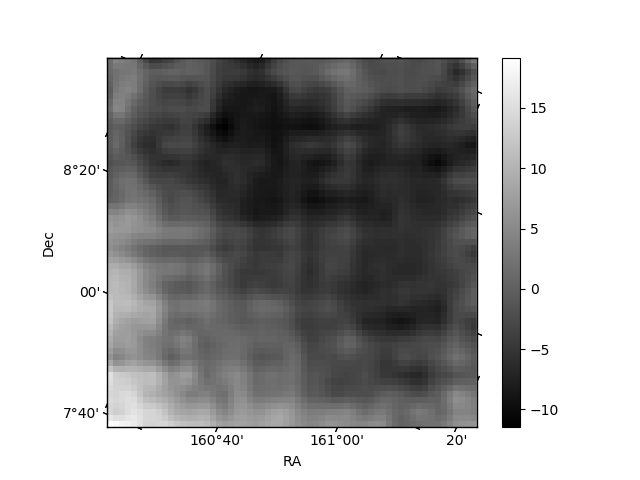
Quadrant B |
|---|---|---|---|
| Quadrant D | 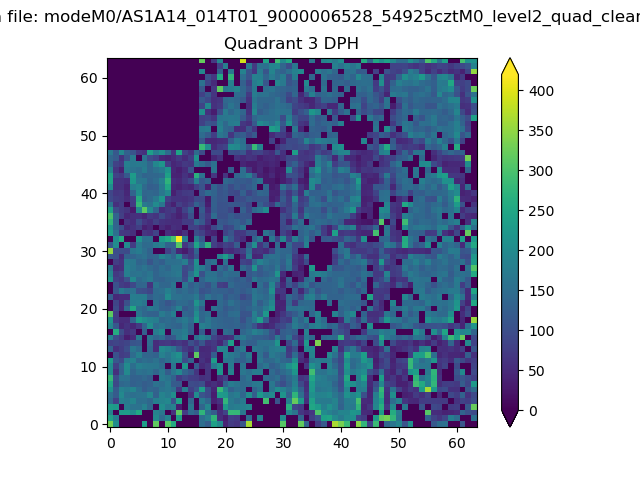 |
 |
Quadrant C |
| Plot type | Count rate plots | Images |
|---|---|---|
| Comparison with Poisson distribution Blue bars denote a histogram of data divided into 1 sec bins. Red curve is a Poisson curve with rate = median count rate of data. |
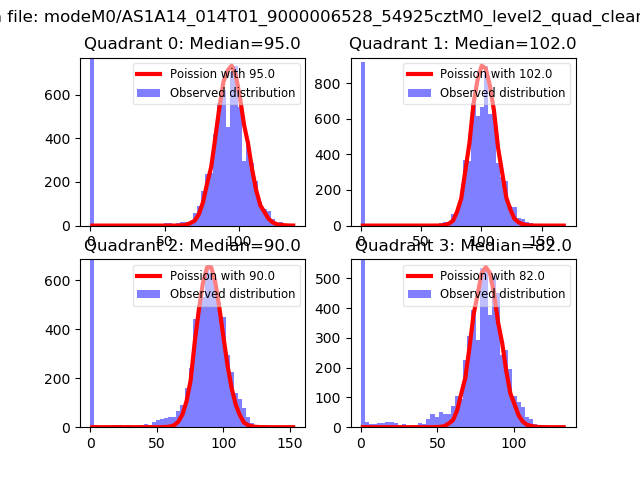 |
 |
| Quadrant-wise count rates Data is divided into 100 sec bins |
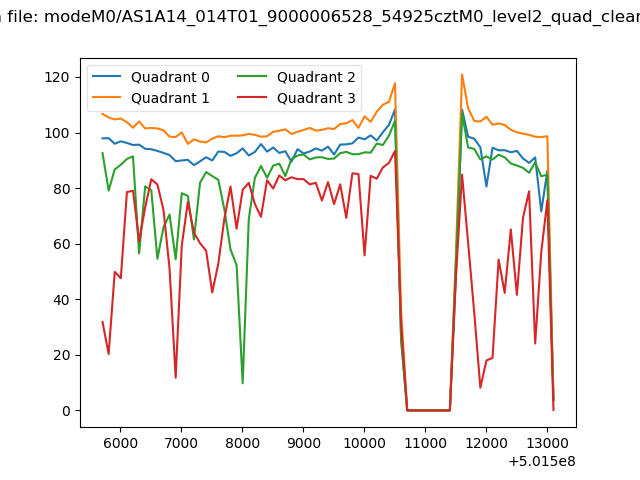 |
|
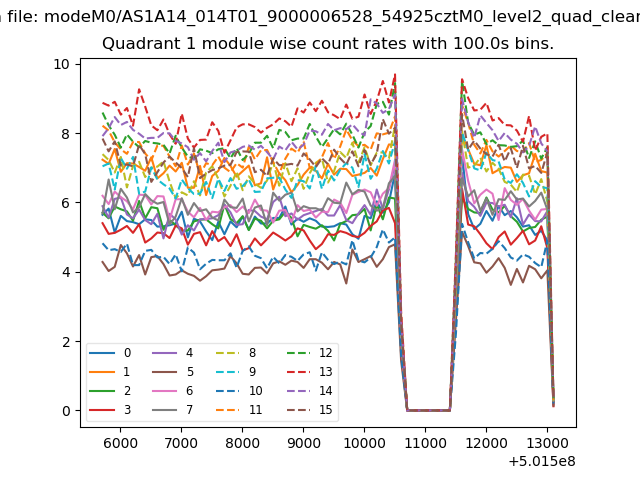
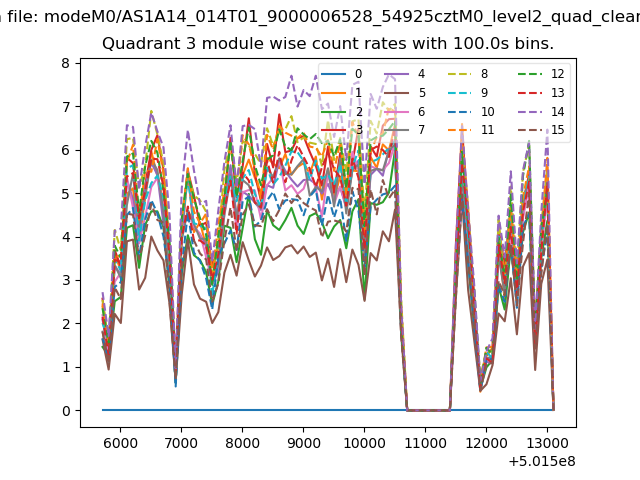
| Module-wise count rates for Quadrant A Data is divided into 100 sec bins |
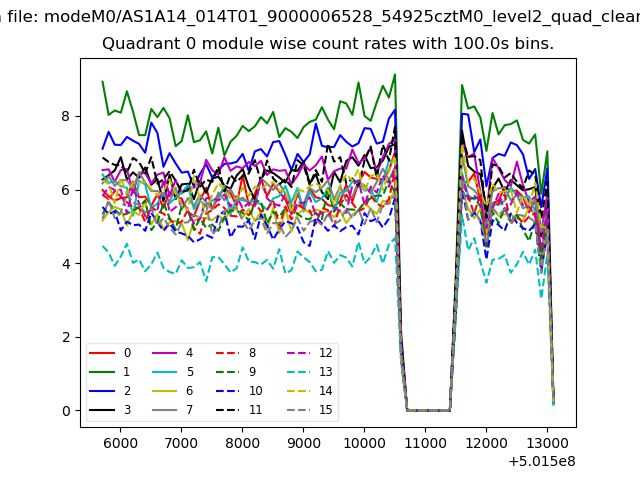 |
 |
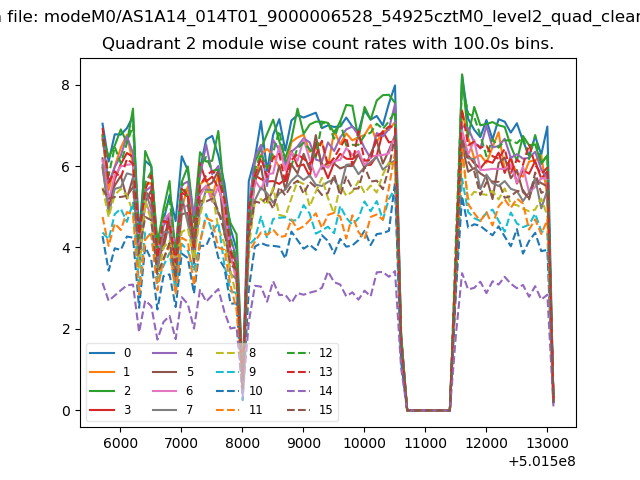
| Module-wise count rates for Quadrant B Data is divided into 100 sec bins |
 |
 |
| Module-wise count rates for Quadrant C Data is divided into 100 sec bins |
 |
 |
| Module-wise count rates for Quadrant D Data is divided into 100 sec bins |
 |
 |
| Parameter | Plot |
|---|---|
| CZT HV Monitor | 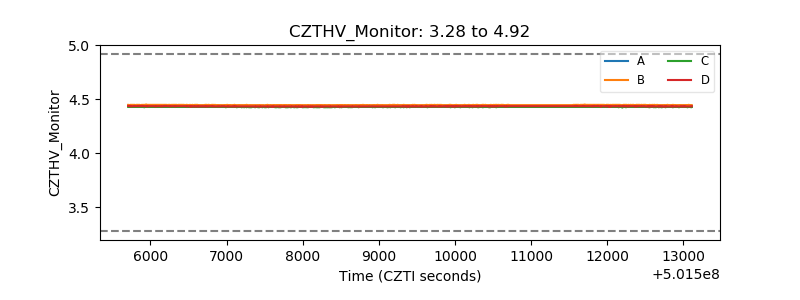 |
| D_VDD | 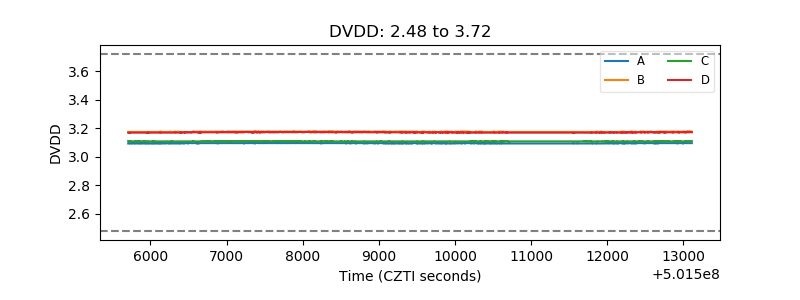 |
| Temperature 1 | 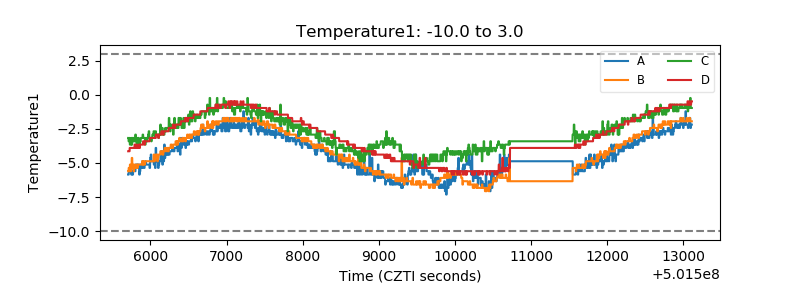 |
| Veto HV Monitor |  |
| Veto LLD | 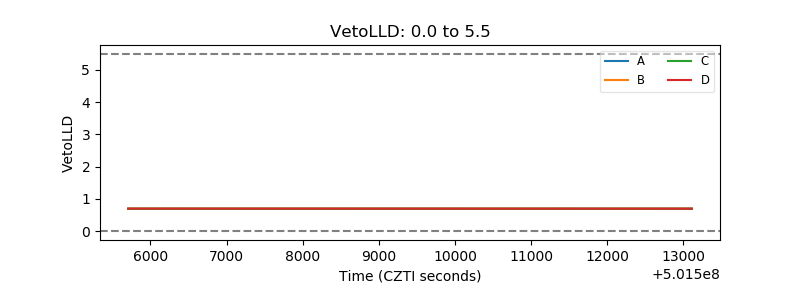 |
| Alpha Counter | 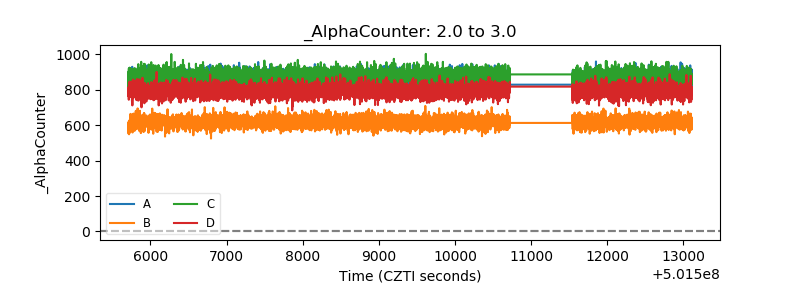 |
| _CPM_Rate | 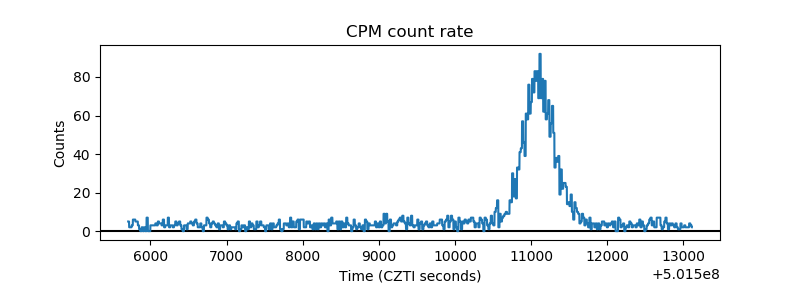 |
| CZT Counter | 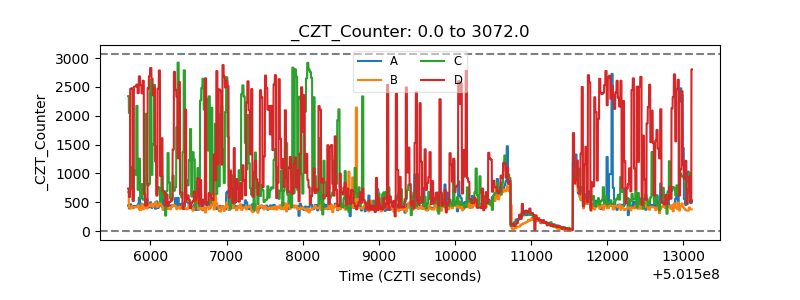 |
| +2.5 Volts monitor |  |
| +5 Volts monitor |  |
| _ROLL_ROT | 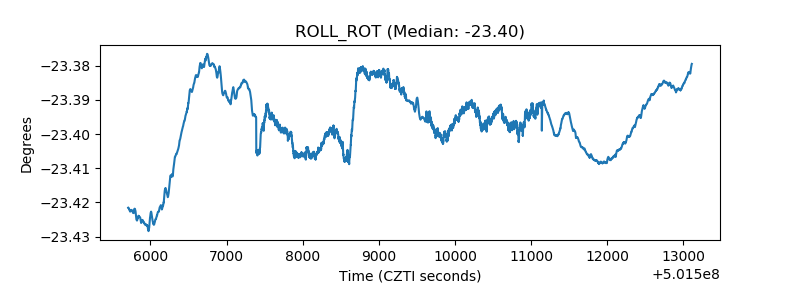 |
| _Roll_DEC |  |
| _Roll_RA | 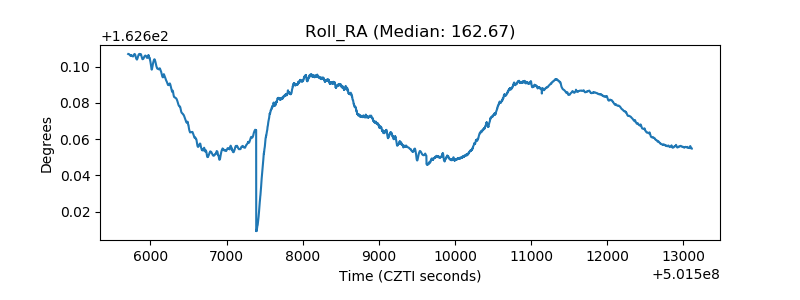 |
| Veto Counter | 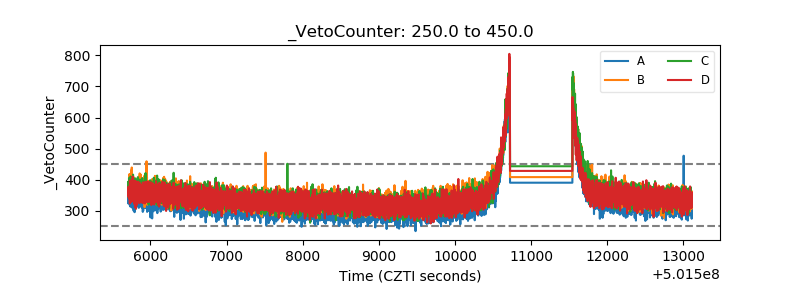 |