| Param | Original file | Final file |
|---|---|---|
| Filename | modeM0/AS1A14_014T01_9000006528_54926cztM0_level2.fits | modeM0/AS1A14_014T01_9000006528_54926cztM0_level2_quad_clean.evt |
| Size (bytes) | 638,809,920 | 95,993,280 |
| Size | 609.2 MB | 91.5 MB |
| Events in quadrant A | 4,324,500 | 646,013 |
| Events in quadrant B | 3,563,456 | 707,113 |
| Events in quadrant C | 5,928,781 | 591,890 |
| Events in quadrant D | 9,268,520 | 457,295 |
| Mode M0 | |||
|---|---|---|---|
| Quadrant | BADHDUFLAG | Total packets | Discarded packets |
| A | 0 | 17779 | 2 |
| B | 0 | 16062 | 2 |
| C | 0 | 22526 | 2 |
| D | 0 | 32513 | 2 |
| Mode SS | |||
|---|---|---|---|
| Quadrant | BADHDUFLAG | Total packets | Discarded packets |
| A | 0 | 148 | 0 |
| B | 0 | 148 | 0 |
| C | 0 | 148 | 0 |
| D | 0 | 148 | 0 |
| Mode M9 | |||
|---|---|---|---|
| Quadrant | BADHDUFLAG | Total packets | Discarded packets |
| A | 0 | 3 | 0 |
| B | 0 | 3 | 0 |
| C | 0 | 3 | 0 |
| D | 0 | 3 | 0 |
| Quadrant | Total seconds | Saturated seconds | Saturation percentage |
|---|---|---|---|
| A | 7233 | 403 | 5.571685% |
| B | 7234 | 275 | 3.801493% |
| C | 7234 | 763 | 10.547415% |
| D | 7234 | 1989 | 27.495162% |
Noise dominated data is calculated using 1-second bins in cleaned event files. If a bin has >2000 counts, and if more than 50% of those come from <1% of pixels, then it is considered to be noise-dominated and hence unusable.
| Quadrant | # 1 sec bins | Bins with >0 counts | Bins with >2000 counts | High rate bins dominated by noise | Noise dominated (total time) | Noise dominated (detector-on time) | Marked lightcurve |
|---|---|---|---|---|---|---|---|
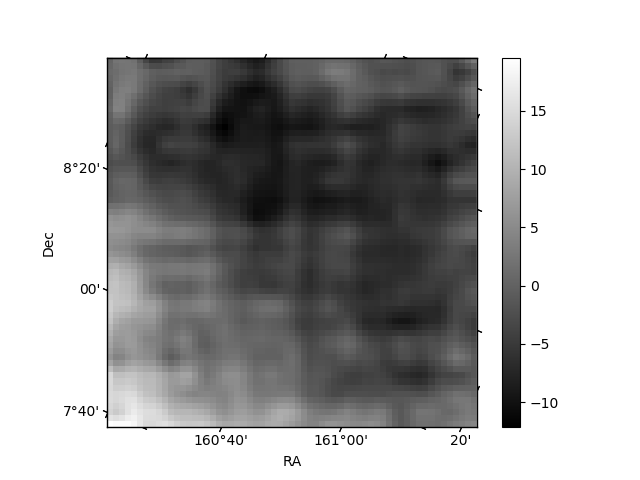
| A | 7603 | 7234 | 145 | 145 | 1.91% | 2.00% | 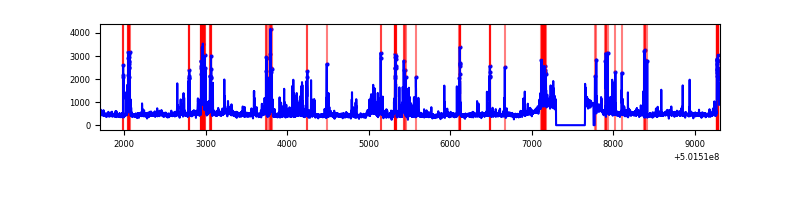 |
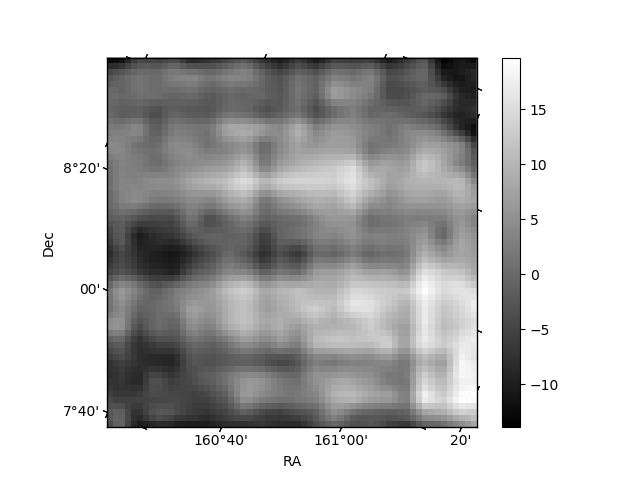
| B | 7604 | 7235 | 32 | 32 | 0.42% | 0.44% | 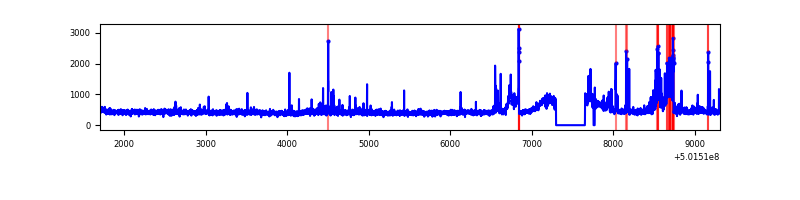 |
| C | 7604 | 7235 | 498 | 498 | 6.55% | 6.88% | 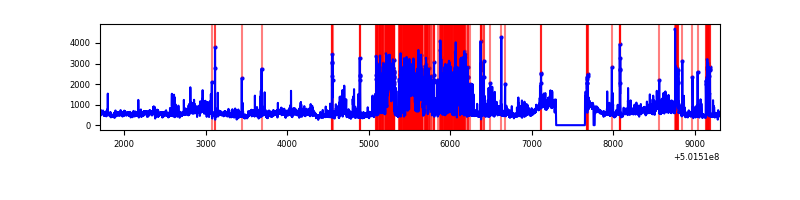 |
| D | 7603 | 7234 | 1659 | 1659 | 21.82% | 22.93% |  |
Top three noisy pixels from each quadrant. If the there are fewer than three noisy pixels in the level2.evt file, extra rows are filled as -1
| Pixel properties | Quadrant properties | ||||||
|---|---|---|---|---|---|---|---|
| Quadrant | DetID | PixID | Counts | Sigma | Mean | Median | Sigma |
| A | 3 | 45 | 651021 | 3326.83 | 792 | 772 | 195.5 |
| A | 0 | 8 | 258173 | 1316.92 | 792 | 772 | 195.5 |
| A | 3 | 14 | 166007 | 845.38 | 792 | 772 | 195.5 |
| B | 10 | 247 | 290844 | 1698.93 | 786 | 756 | 170.7 |
| B | 5 | 32 | 80984 | 469.86 | 786 | 756 | 170.7 |
| B | 7 | 252 | 30746 | 175.64 | 786 | 756 | 170.7 |
| C | 6 | 223 | 1274281 | 6094.93 | 760 | 755 | 208.9 |
| C | 12 | 252 | 949026 | 4538.3 | 760 | 755 | 208.9 |
| C | 4 | 5 | 232017 | 1106.79 | 760 | 755 | 208.9 |
| D | 15 | 94 | 1905126 | 9702.75 | 697 | 667 | 196.3 |
| D | 11 | 129 | 1399292 | 7125.65 | 697 | 667 | 196.3 |
| D | 3 | 224 | 768389 | 3911.36 | 697 | 667 | 196.3 |
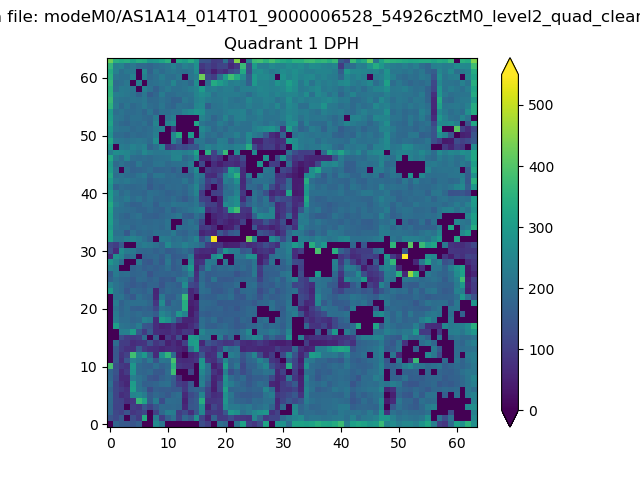
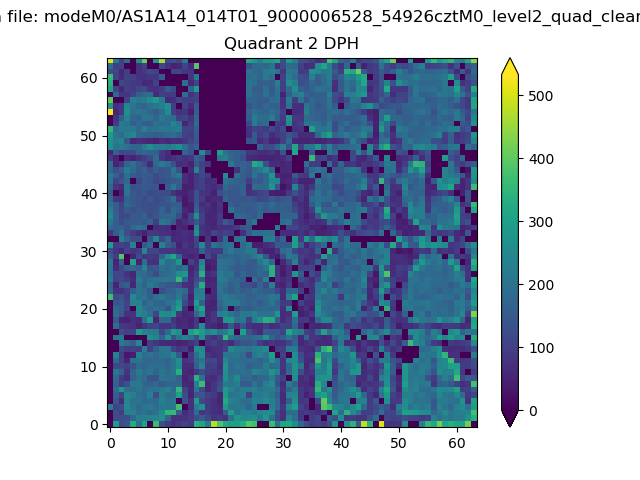
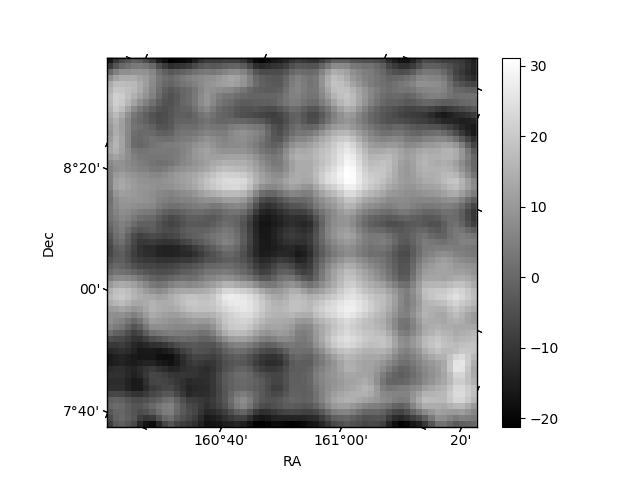
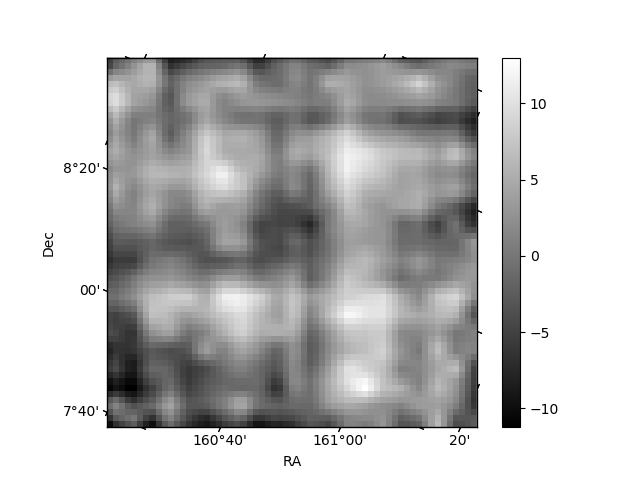
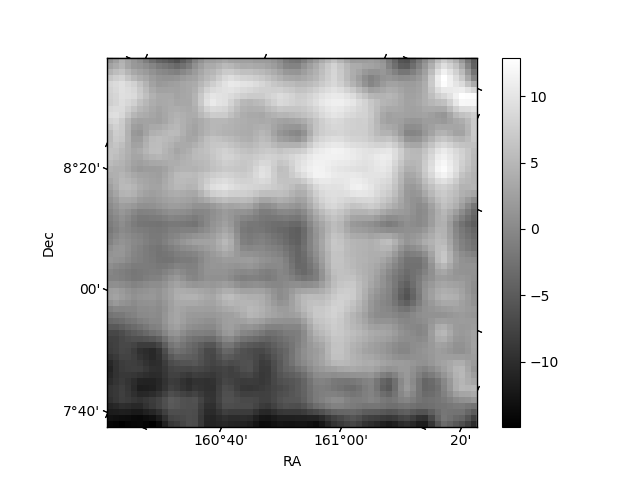
Histogram calculated using DETX and DETY for each event in the final _common_clean file
| Quadrant A | 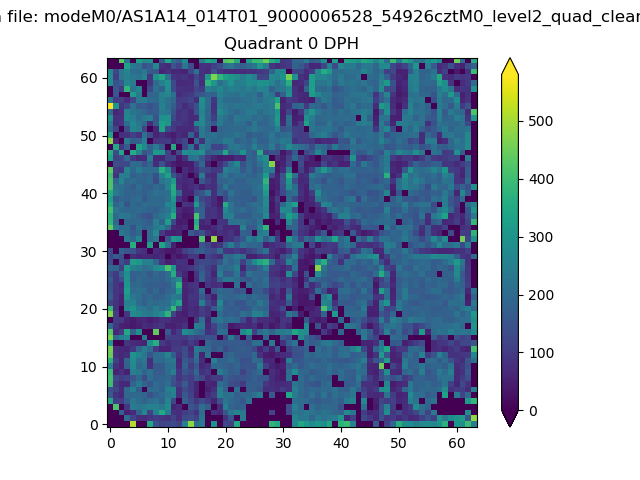 |
 |
Quadrant B |
|---|---|---|---|
| Quadrant D | 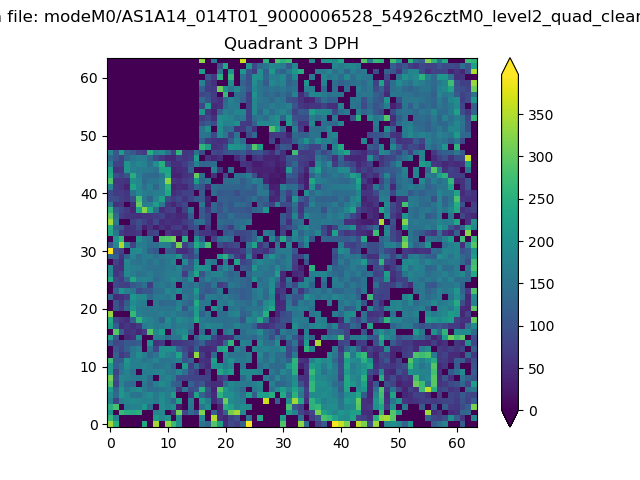 |
 |
Quadrant C |
| Plot type | Count rate plots | Images |
|---|---|---|
| Comparison with Poisson distribution Blue bars denote a histogram of data divided into 1 sec bins. Red curve is a Poisson curve with rate = median count rate of data. |
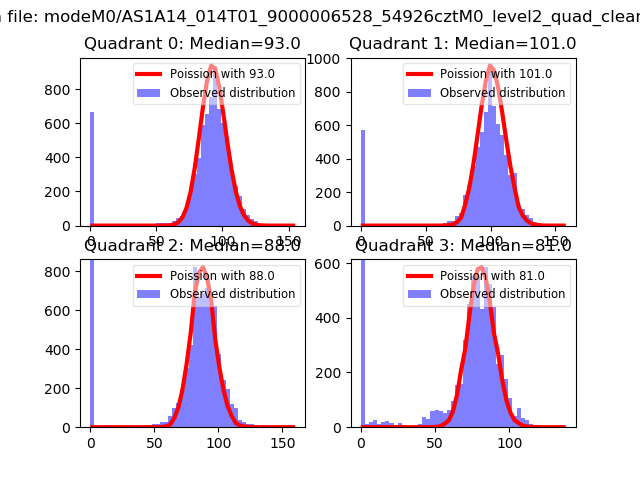 |
 |
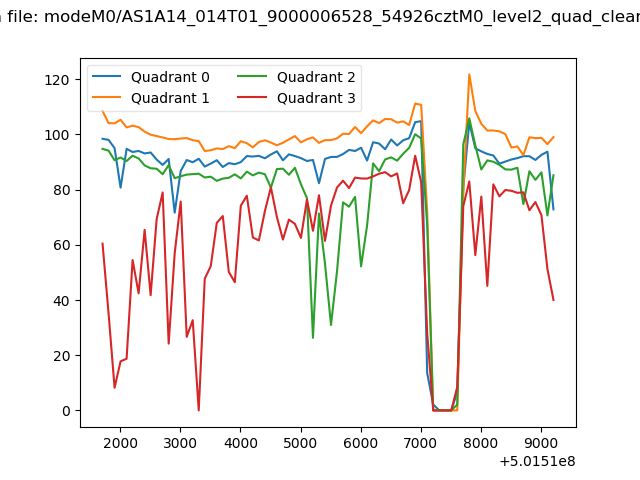
| Quadrant-wise count rates Data is divided into 100 sec bins |
 |
|
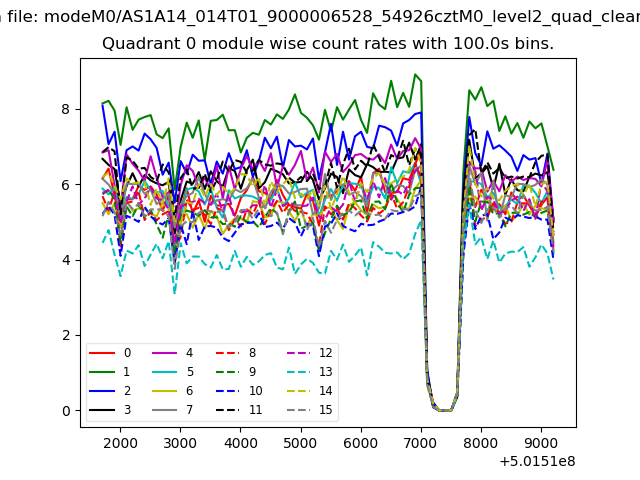
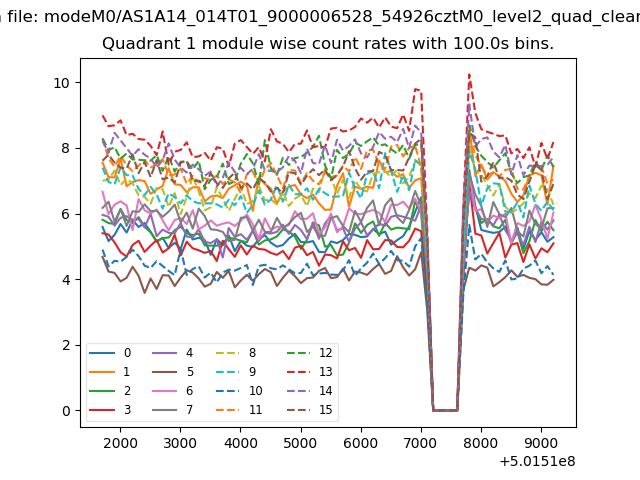
| Module-wise count rates for Quadrant A Data is divided into 100 sec bins |
 |
 |
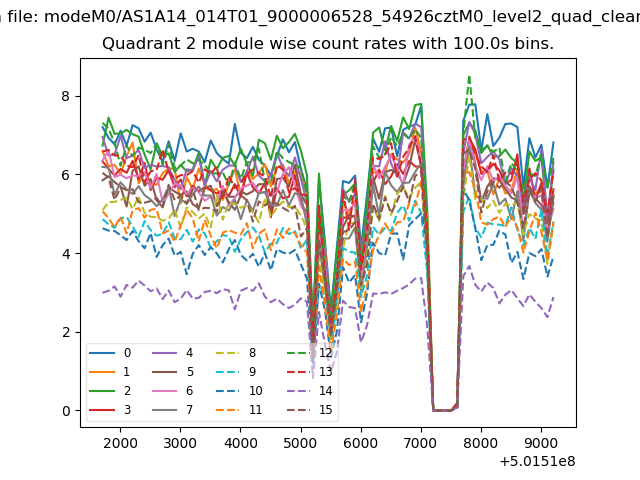
| Module-wise count rates for Quadrant B Data is divided into 100 sec bins |
 |
 |
| Module-wise count rates for Quadrant C Data is divided into 100 sec bins |
 |
 |
| Module-wise count rates for Quadrant D Data is divided into 100 sec bins |
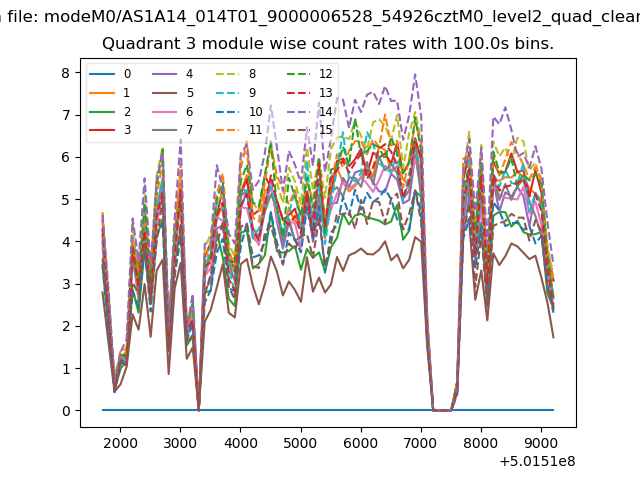 |
 |
| Parameter | Plot |
|---|---|
| CZT HV Monitor |  |
| D_VDD |  |
| Temperature 1 | 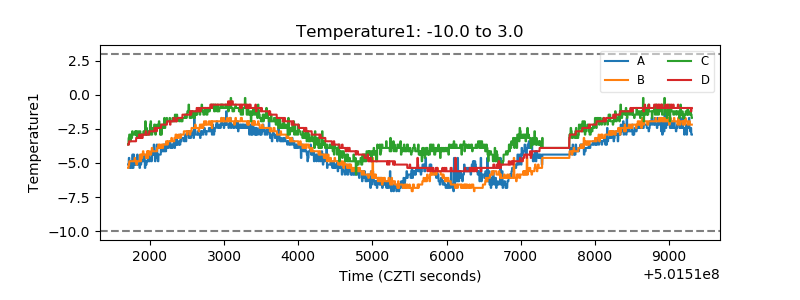 |
| Veto HV Monitor | 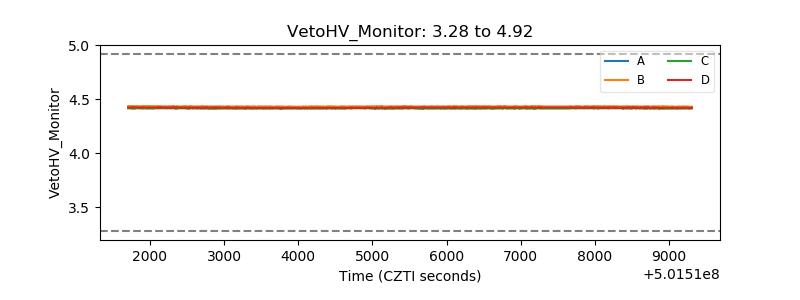 |
| Veto LLD | 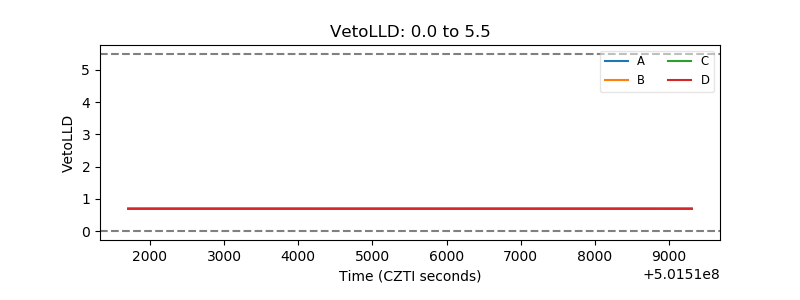 |
| Alpha Counter | 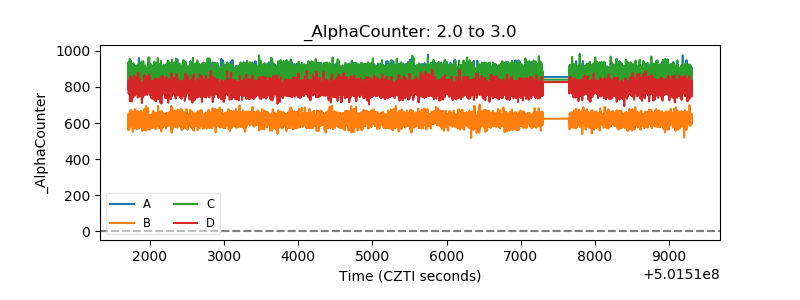 |
| _CPM_Rate | 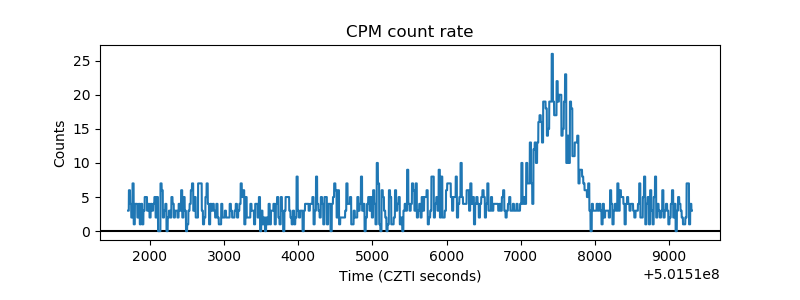 |
| CZT Counter | 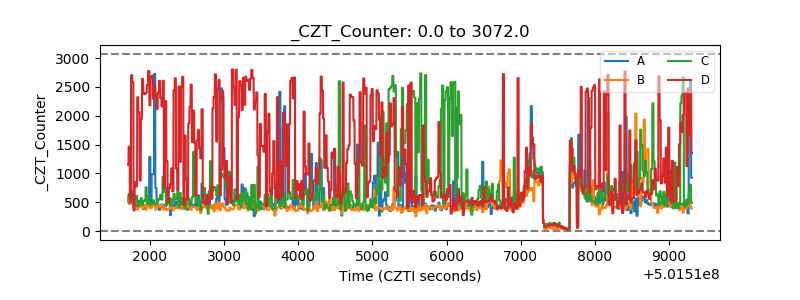 |
| +2.5 Volts monitor |  |
| +5 Volts monitor |  |
| _ROLL_ROT | 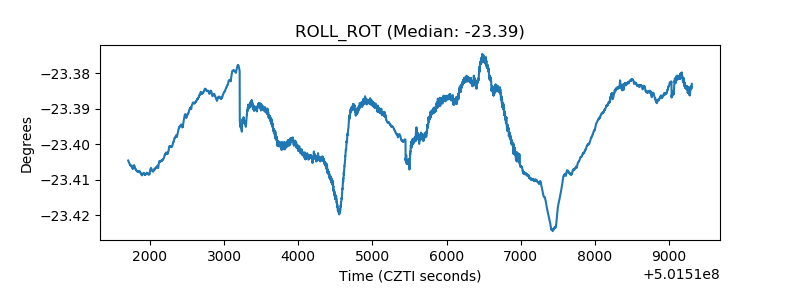 |
| _Roll_DEC | 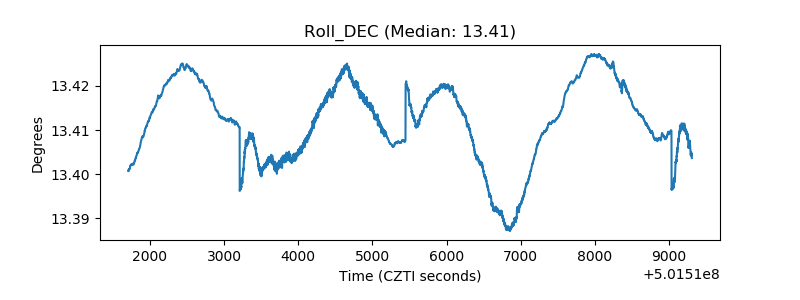 |
| _Roll_RA | 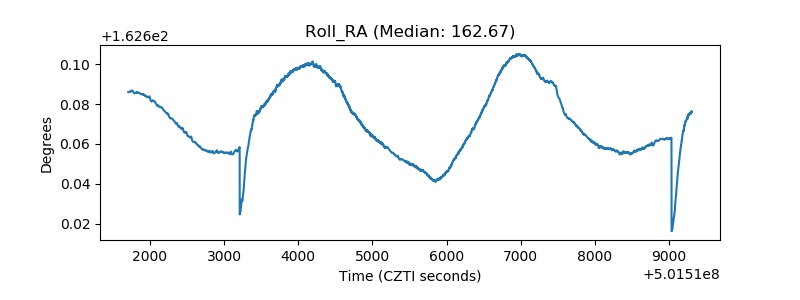 |
| Veto Counter | 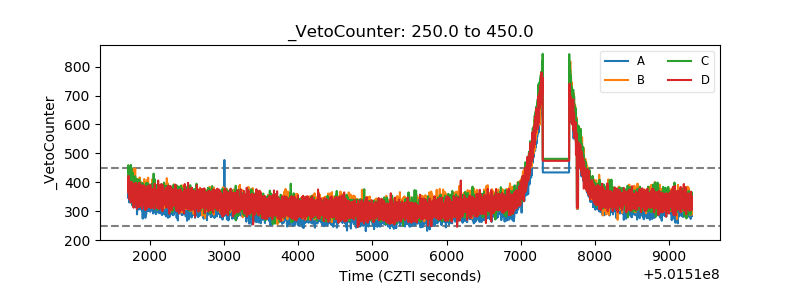 |