| Param | Original file | Final file |
|---|---|---|
| Filename | modeM0/AS1A14_014T01_9000006528_54928cztM0_level2.fits | modeM0/AS1A14_014T01_9000006528_54928cztM0_level2_quad_clean.evt |
| Size (bytes) | 613,402,560 | 108,656,640 |
| Size | 585.0 MB | 103.6 MB |
| Events in quadrant A | 5,153,123 | 702,509 |
| Events in quadrant B | 3,491,361 | 776,207 |
| Events in quadrant C | 6,109,837 | 677,924 |
| Events in quadrant D | 7,349,509 | 592,578 |
| Mode M0 | |||
|---|---|---|---|
| Quadrant | BADHDUFLAG | Total packets | Discarded packets |
| A | 0 | 20741 | 0 |
| B | 0 | 16300 | 0 |
| C | 0 | 23658 | 3 |
| D | 0 | 27294 | 6 |
| Mode SS | |||
|---|---|---|---|
| Quadrant | BADHDUFLAG | Total packets | Discarded packets |
| A | 0 | 156 | 0 |
| B | 0 | 156 | 0 |
| C | 0 | 156 | 0 |
| D | 0 | 155 | 1 |
| Quadrant | Total seconds | Saturated seconds | Saturation percentage |
|---|---|---|---|
| A | 7776 | 325 | 4.179527% |
| B | 7776 | 29 | 0.372942% |
| C | 7775 | 166 | 2.135048% |
| D | 7774 | 788 | 10.136352% |
Noise dominated data is calculated using 1-second bins in cleaned event files. If a bin has >2000 counts, and if more than 50% of those come from <1% of pixels, then it is considered to be noise-dominated and hence unusable.
| Quadrant | # 1 sec bins | Bins with >0 counts | Bins with >2000 counts | High rate bins dominated by noise | Noise dominated (total time) | Noise dominated (detector-on time) | Marked lightcurve |
|---|---|---|---|---|---|---|---|
| A | 7776 | 7776 | 262 | 262 | 3.37% | 3.37% | 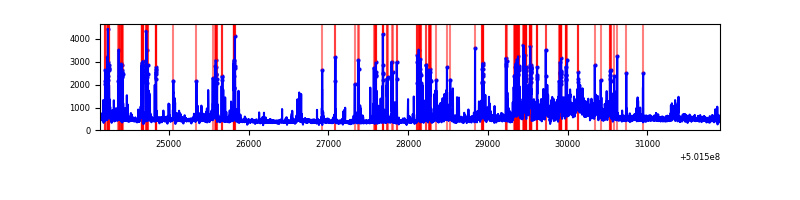 |
| B | 7776 | 7776 | 6 | 6 | 0.08% | 0.08% | 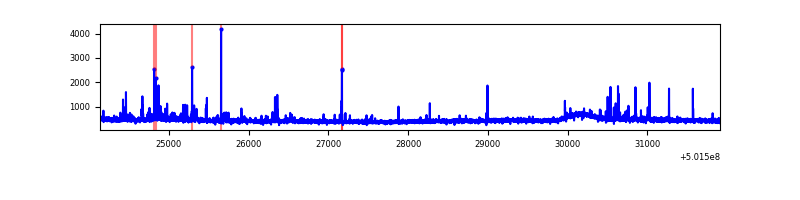 |
| C | 7775 | 7775 | 165 | 165 | 2.12% | 2.12% | 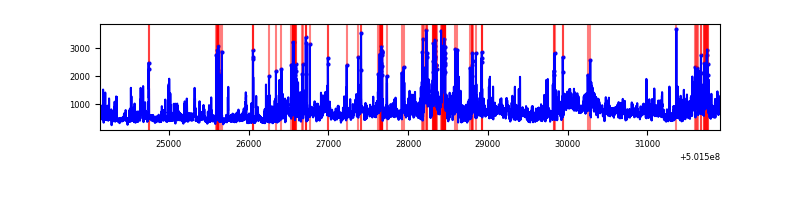 |
| D | 7775 | 7775 | 727 | 727 | 9.35% | 9.35% | 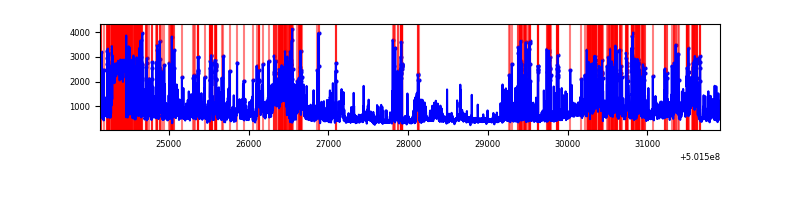 |
Top three noisy pixels from each quadrant. If the there are fewer than three noisy pixels in the level2.evt file, extra rows are filled as -1
| Pixel properties | Quadrant properties | ||||||
|---|---|---|---|---|---|---|---|
| Quadrant | DetID | PixID | Counts | Sigma | Mean | Median | Sigma |
| A | 3 | 45 | 1235439 | 6155.2 | 822 | 803 | 200.6 |
| A | 3 | 14 | 608968 | 3031.97 | 822 | 803 | 200.6 |
| A | 4 | 3 | 41732 | 204.05 | 822 | 803 | 200.6 |
| B | 10 | 247 | 64272 | 357.87 | 825 | 796 | 177.4 |
| B | 0 | 182 | 38160 | 210.65 | 825 | 796 | 177.4 |
| B | 0 | 245 | 26158 | 142.99 | 825 | 796 | 177.4 |
| C | 12 | 252 | 2176364 | 9892.3 | 804 | 797 | 219.9 |
| C | 4 | 5 | 337881 | 1532.72 | 804 | 797 | 219.9 |
| C | 14 | 254 | 114084 | 515.12 | 804 | 797 | 219.9 |
| D | 11 | 129 | 1063427 | 4890.29 | 767 | 736 | 217.3 |
| D | 15 | 94 | 951510 | 4375.27 | 767 | 736 | 217.3 |
| D | 12 | 191 | 339994 | 1561.2 | 767 | 736 | 217.3 |
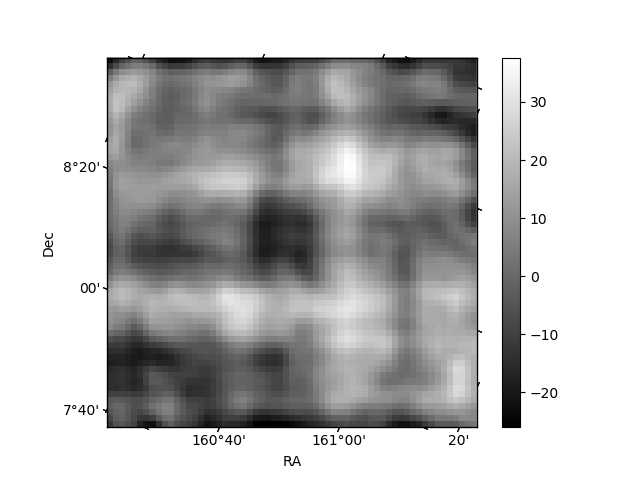
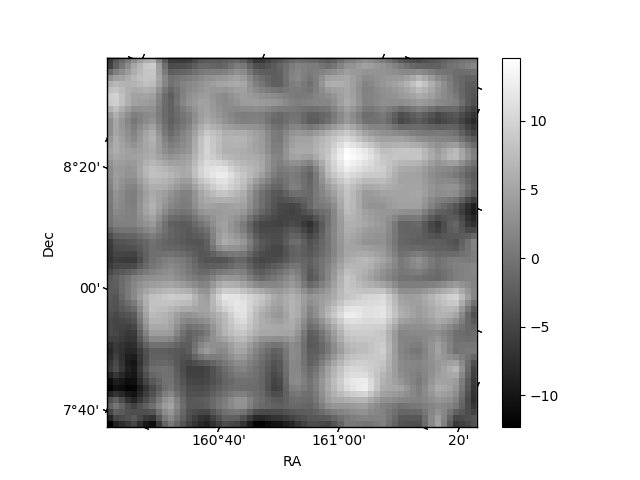
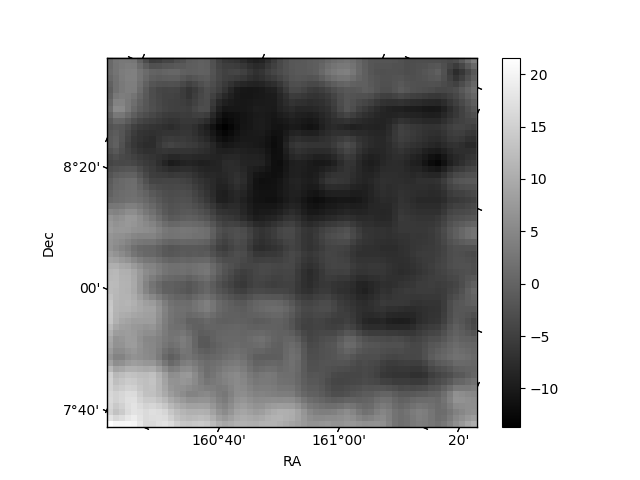
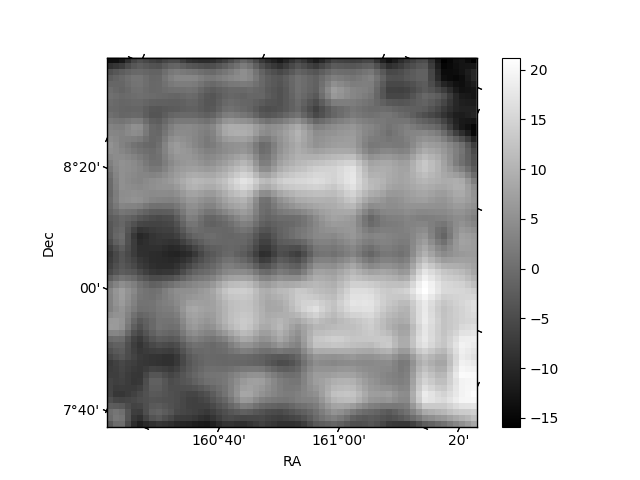
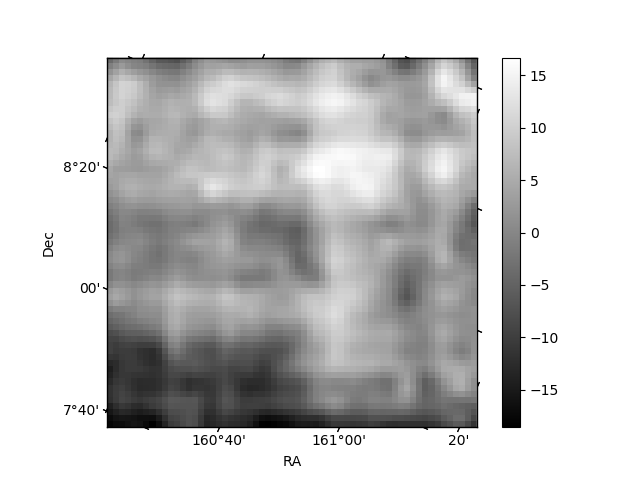
Histogram calculated using DETX and DETY for each event in the final _common_clean file
| Quadrant A | 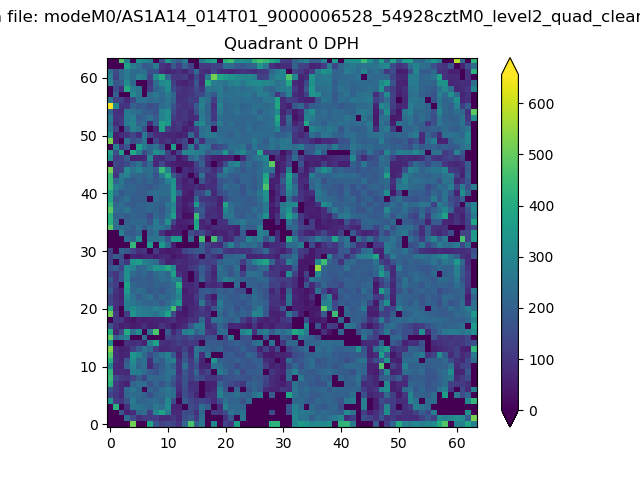 |
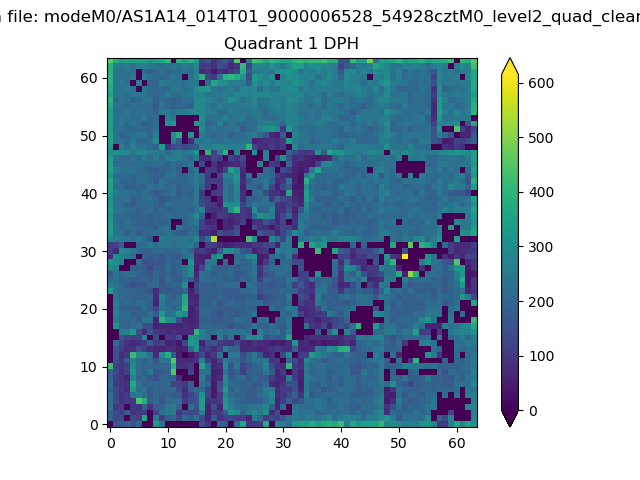 |
Quadrant B |
|---|---|---|---|
| Quadrant D | 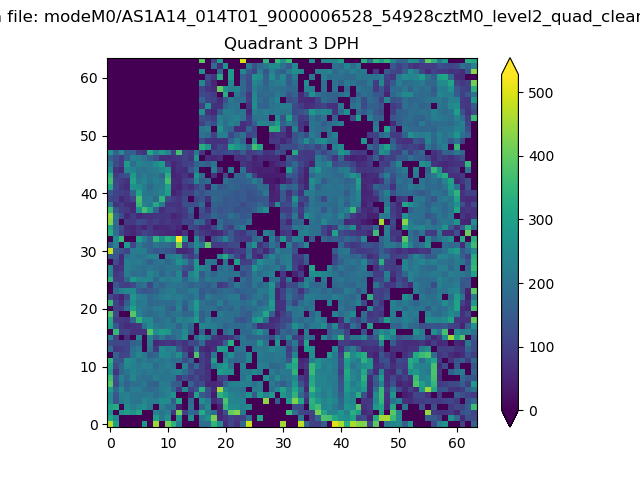 |
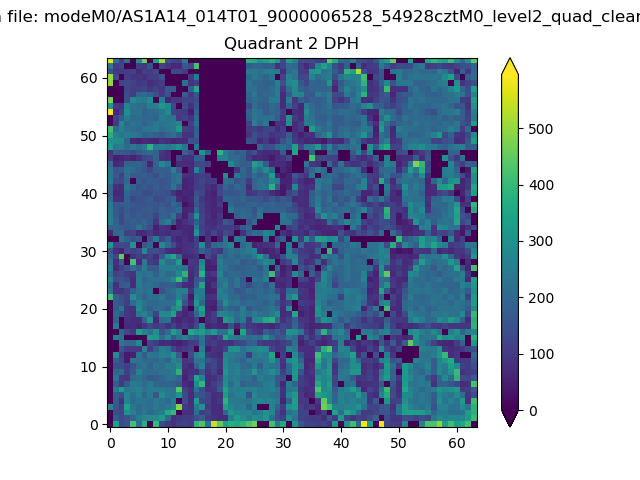 |
Quadrant C |
| Plot type | Count rate plots | Images |
|---|---|---|
| Comparison with Poisson distribution Blue bars denote a histogram of data divided into 1 sec bins. Red curve is a Poisson curve with rate = median count rate of data. |
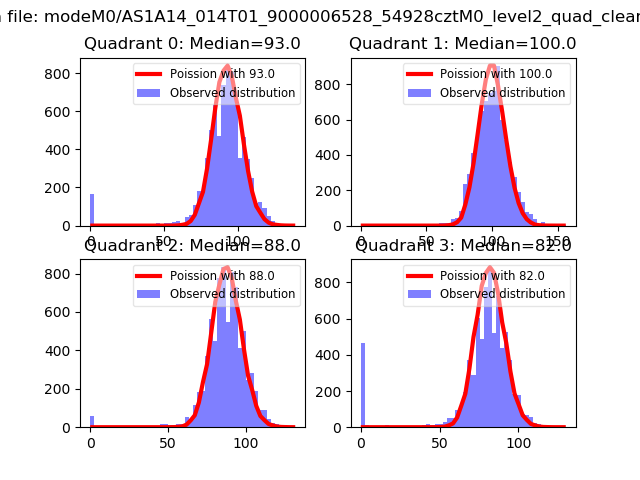 |
 |
| Quadrant-wise count rates Data is divided into 100 sec bins |
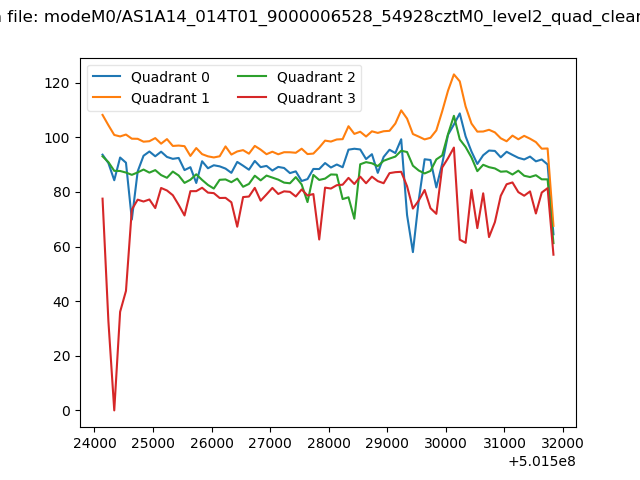 |
|
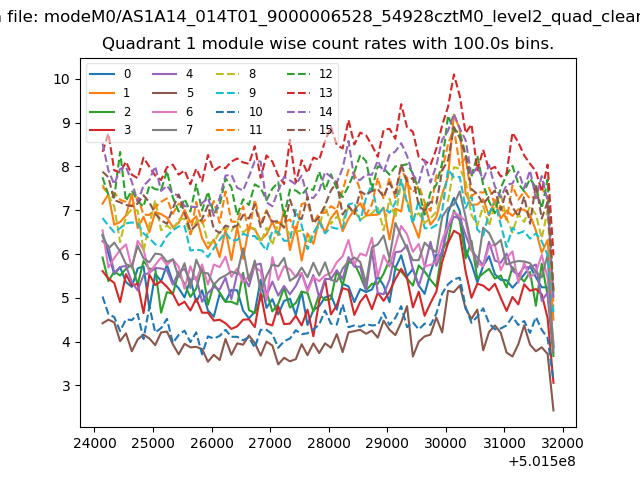
| Module-wise count rates for Quadrant A Data is divided into 100 sec bins |
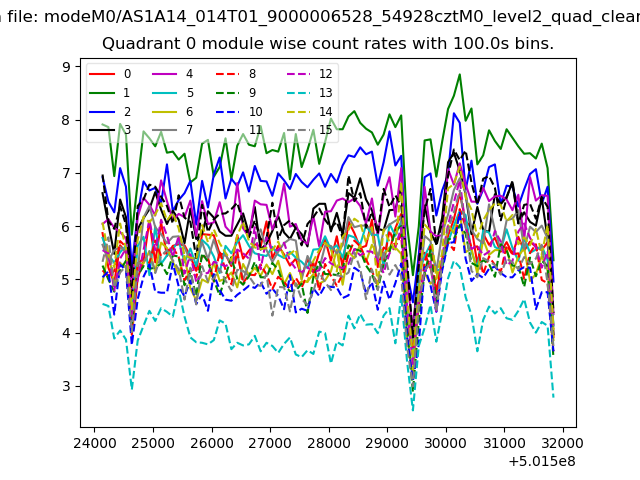 |
 |
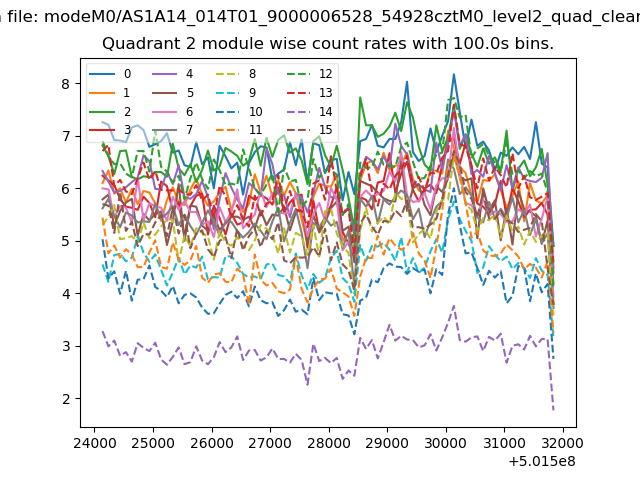
| Module-wise count rates for Quadrant B Data is divided into 100 sec bins |
 |
 |
| Module-wise count rates for Quadrant C Data is divided into 100 sec bins |
 |
 |
| Module-wise count rates for Quadrant D Data is divided into 100 sec bins |
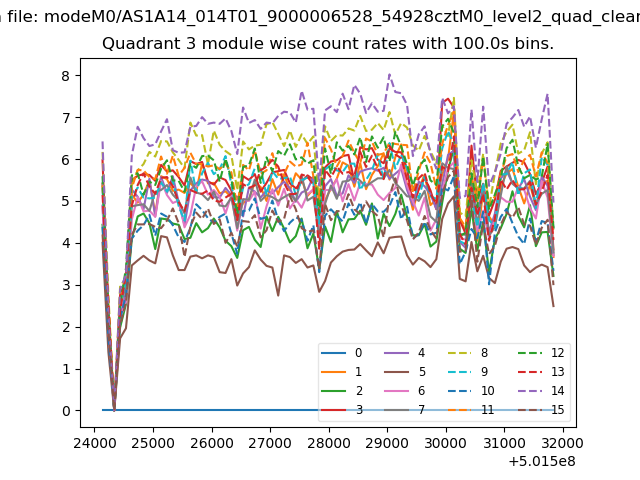 |
 |
| Parameter | Plot |
|---|---|
| CZT HV Monitor | 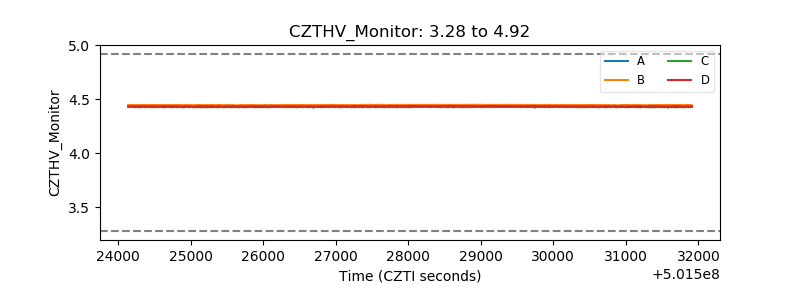 |
| D_VDD | 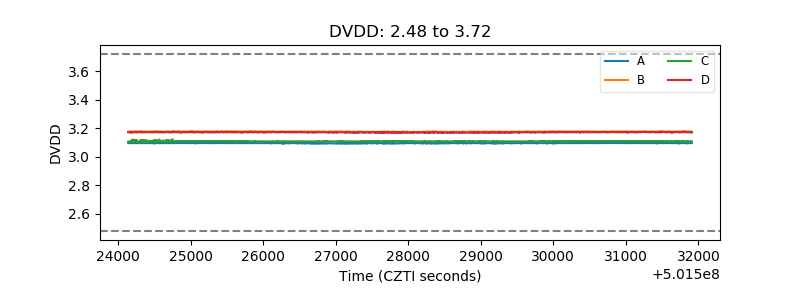 |
| Temperature 1 | 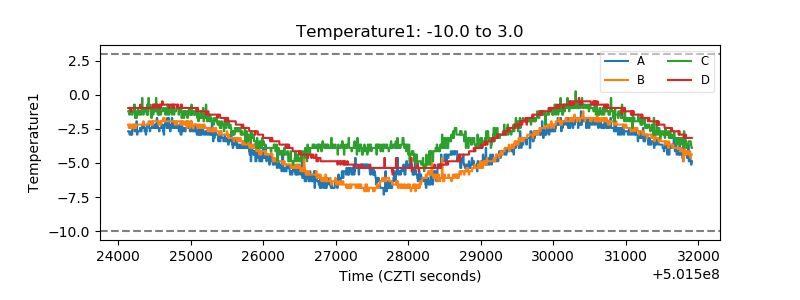 |
| Veto HV Monitor | 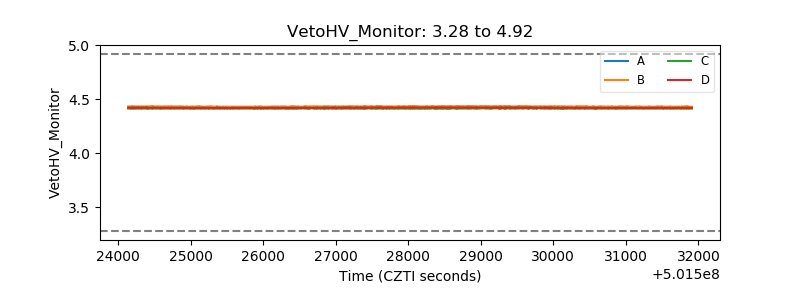 |
| Veto LLD | 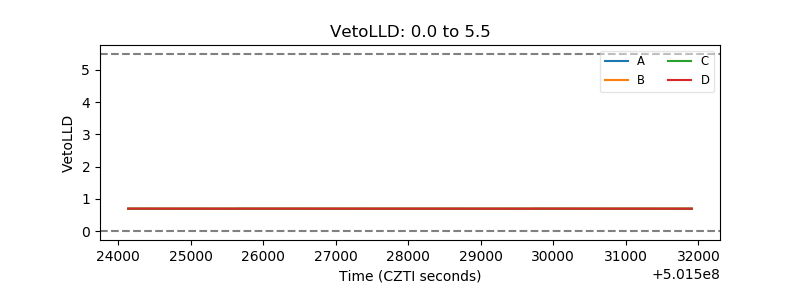 |
| Alpha Counter | 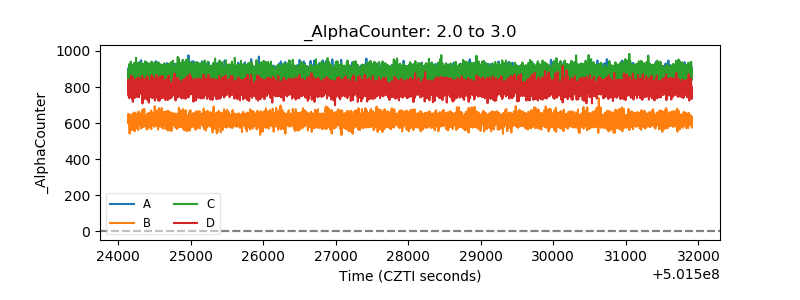 |
| _CPM_Rate | 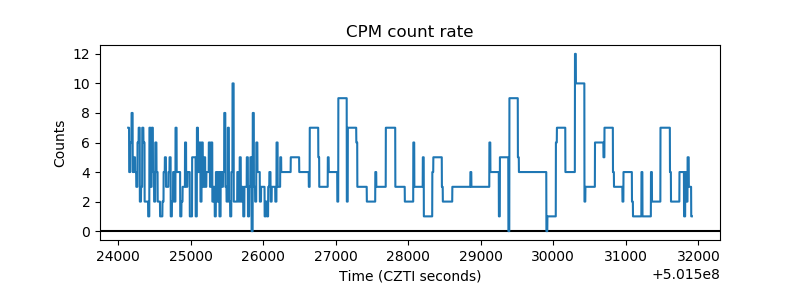 |
| CZT Counter | 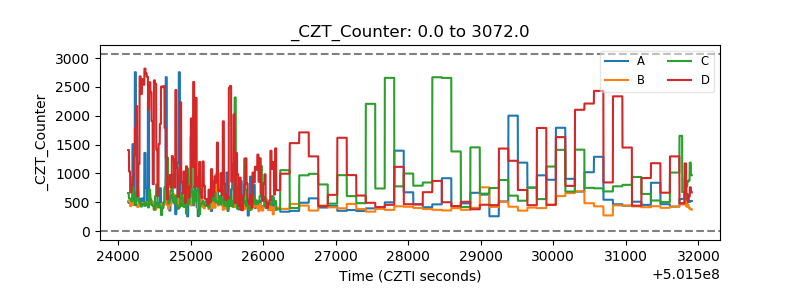 |
| +2.5 Volts monitor |  |
| +5 Volts monitor |  |
| _ROLL_ROT | 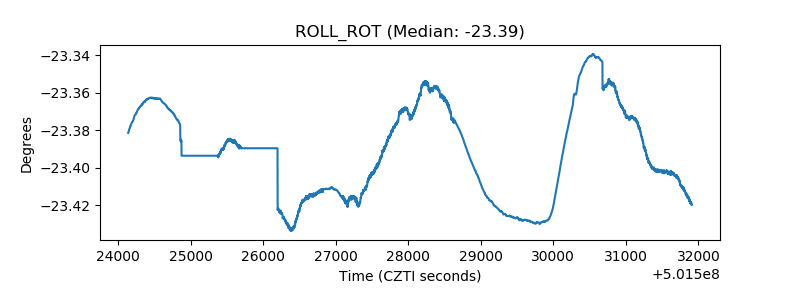 |
| _Roll_DEC | 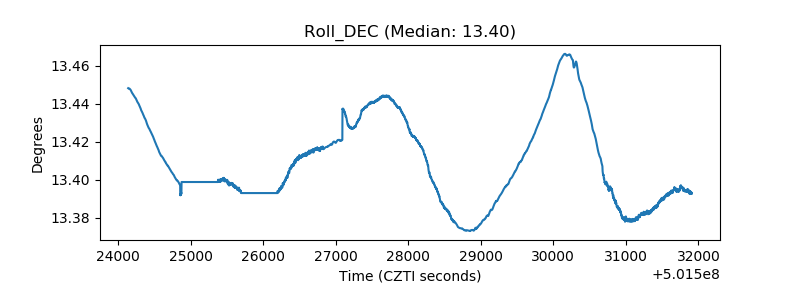 |
| _Roll_RA | 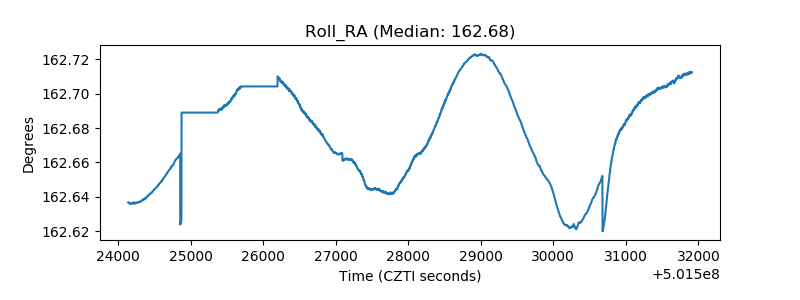 |
| Veto Counter | 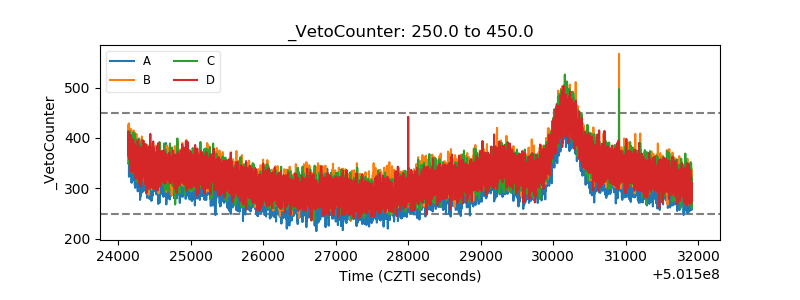 |