| Param | Original file | Final file |
|---|---|---|
| Filename | modeM0/AS1A14_014T01_9000006528_54933cztM0_level2.fits | modeM0/AS1A14_014T01_9000006528_54933cztM0_level2_quad_clean.evt |
| Size (bytes) | 2,441,108,160 | 336,139,200 |
| Size | 2.3 GB | 320.6 MB |
| Events in quadrant A | 31,805,470 | 1,947,196 |
| Events in quadrant B | 12,374,162 | 2,486,464 |
| Events in quadrant C | 20,838,967 | 2,134,144 |
| Events in quadrant D | 23,408,098 | 1,879,799 |
| Mode M0 | |||
|---|---|---|---|
| Quadrant | BADHDUFLAG | Total packets | Discarded packets |
| A | 0 | 112121 | 12 |
| B | 0 | 56175 | 9 |
| C | 0 | 79533 | 8 |
| D | 0 | 87189 | 9 |
| Mode SS | |||
|---|---|---|---|
| Quadrant | BADHDUFLAG | Total packets | Discarded packets |
| A | 0 | 512 | 0 |
| B | 0 | 512 | 0 |
| C | 0 | 512 | 0 |
| D | 0 | 512 | 0 |
| Mode M9 | |||
|---|---|---|---|
| Quadrant | BADHDUFLAG | Total packets | Discarded packets |
| A | 0 | 26 | 0 |
| B | 0 | 26 | 0 |
| C | 0 | 26 | 0 |
| D | 0 | 26 | 0 |
| Quadrant | Total seconds | Saturated seconds | Saturation percentage |
|---|---|---|---|
| A | 25121 | 5311 | 21.141674% |
| B | 25121 | 555 | 2.209307% |
| C | 25122 | 1488 | 5.923095% |
| D | 25122 | 3232 | 12.865218% |
Noise dominated data is calculated using 1-second bins in cleaned event files. If a bin has >2000 counts, and if more than 50% of those come from <1% of pixels, then it is considered to be noise-dominated and hence unusable.
| Quadrant | # 1 sec bins | Bins with >0 counts | Bins with >2000 counts | High rate bins dominated by noise | Noise dominated (total time) | Noise dominated (detector-on time) | Marked lightcurve |
|---|---|---|---|---|---|---|---|
| A | 27712 | 25125 | 4636 | 4636 | 16.73% | 18.45% | 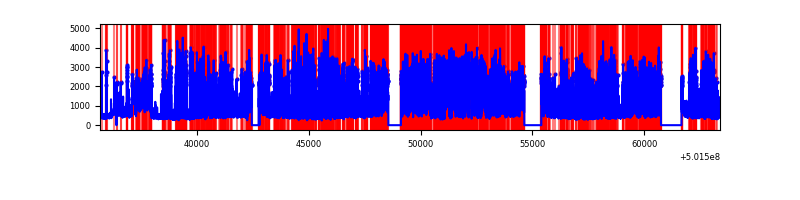 |
| B | 27713 | 25127 | 263 | 263 | 0.95% | 1.05% | 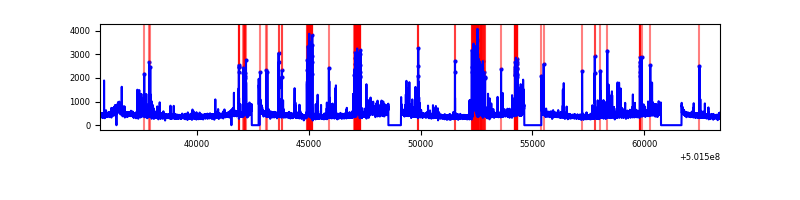 |
| C | 27713 | 25129 | 1261 | 1261 | 4.55% | 5.02% | 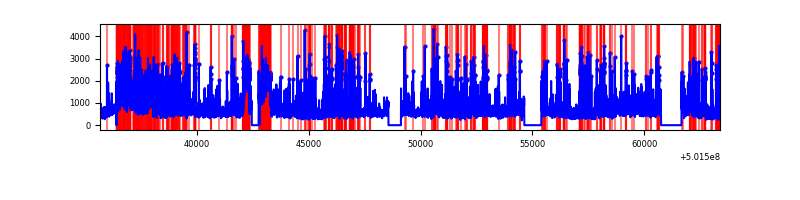 |
| D | 27712 | 25128 | 3010 | 3010 | 10.86% | 11.98% | 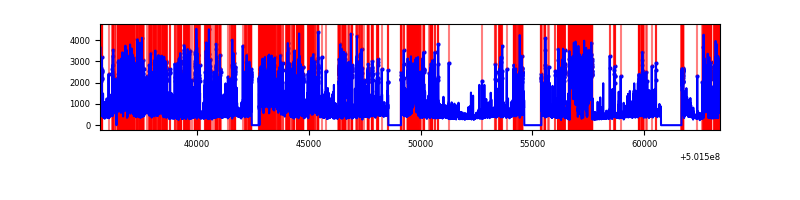 |
Top three noisy pixels from each quadrant. If the there are fewer than three noisy pixels in the level2.evt file, extra rows are filled as -1
| Pixel properties | Quadrant properties | ||||||
|---|---|---|---|---|---|---|---|
| Quadrant | DetID | PixID | Counts | Sigma | Mean | Median | Sigma |
| A | 3 | 14 | 10288968 | 17167.57 | 2421 | 2360 | 599.2 |
| A | 3 | 45 | 10012176 | 16705.62 | 2421 | 2360 | 599.2 |
| A | 13 | 248 | 1041257 | 1733.84 | 2421 | 2360 | 599.2 |
| B | 5 | 185 | 1222019 | 2166.81 | 2619 | 2519 | 562.8 |
| B | 4 | 81 | 210367 | 369.31 | 2619 | 2519 | 562.8 |
| B | 0 | 182 | 165708 | 289.95 | 2619 | 2519 | 562.8 |
| C | 12 | 252 | 4334136 | 6202.8 | 2531 | 2512 | 698.3 |
| C | 1 | 16 | 1649991 | 2359.16 | 2531 | 2512 | 698.3 |
| C | 7 | 2 | 1338713 | 1913.41 | 2531 | 2512 | 698.3 |
| D | 2 | 249 | 5531452 | 8070.16 | 2424 | 2317 | 685.1 |
| D | 11 | 129 | 2311879 | 3370.97 | 2424 | 2317 | 685.1 |
| D | 12 | 191 | 872622 | 1270.27 | 2424 | 2317 | 685.1 |
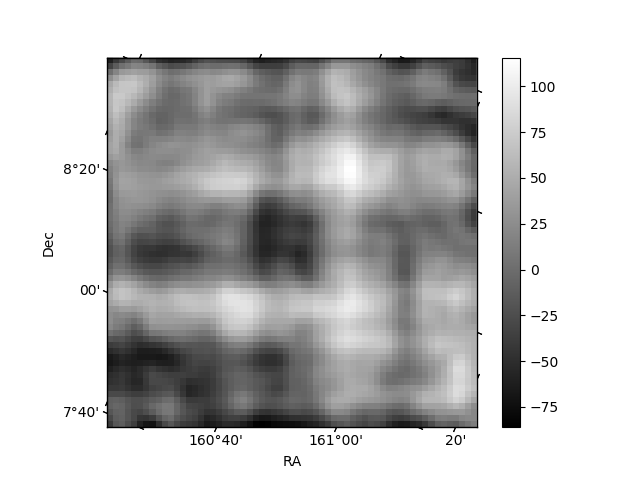
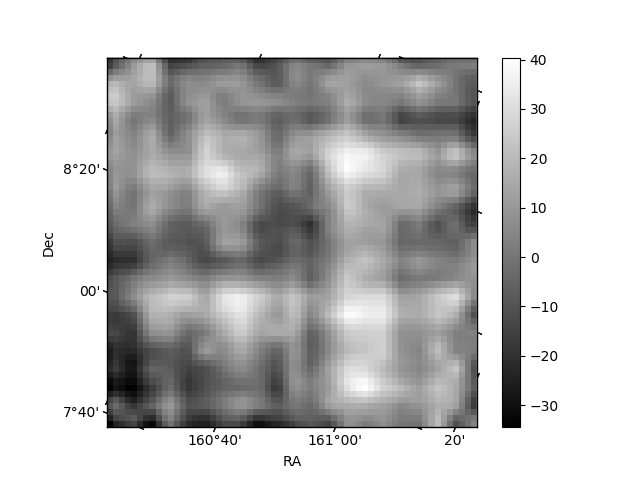
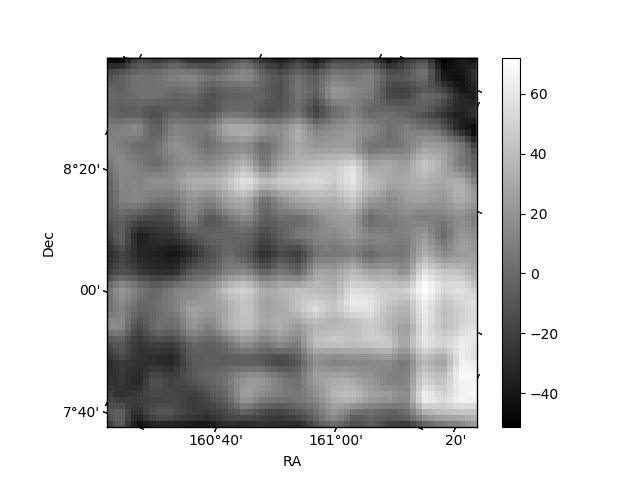
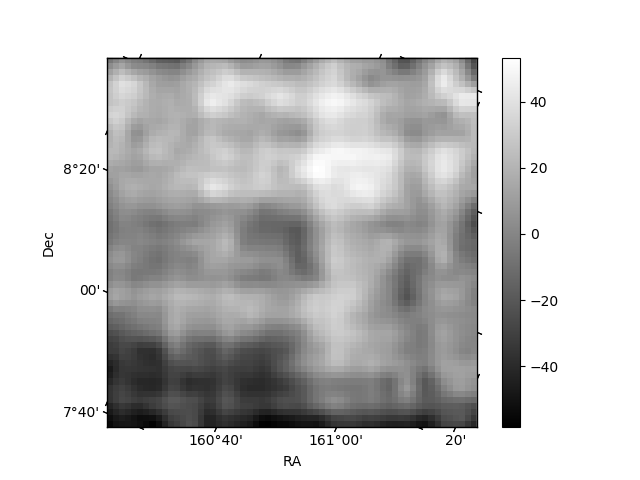
Histogram calculated using DETX and DETY for each event in the final _common_clean file
| Quadrant A | 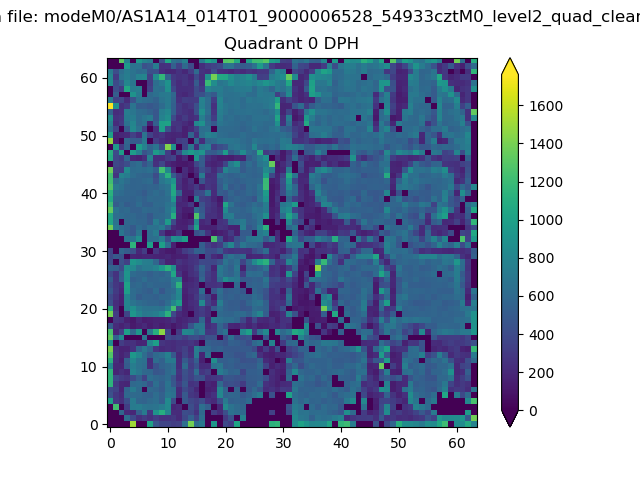 |
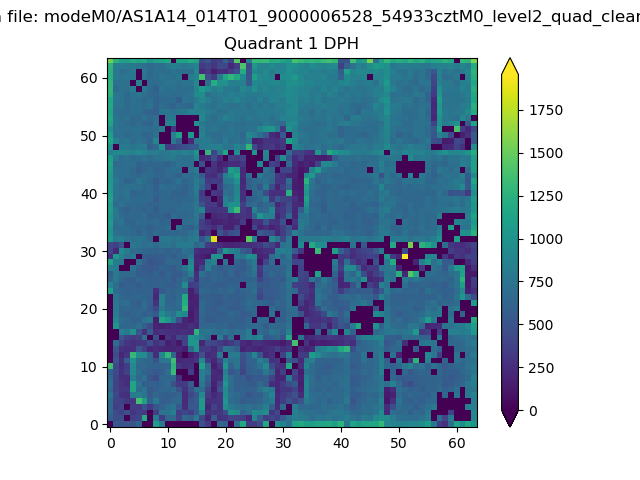 |
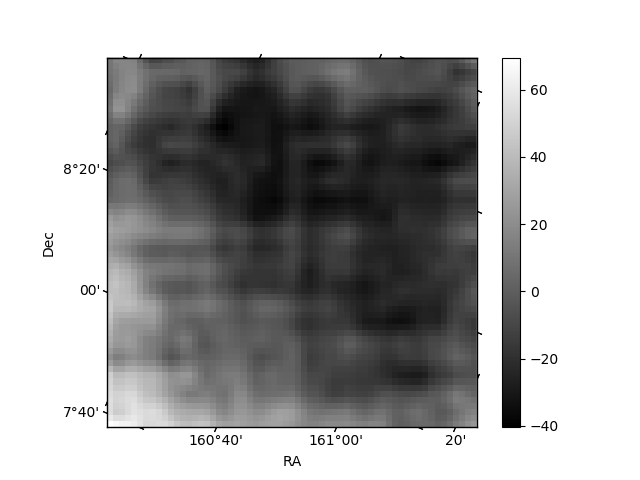
Quadrant B |
|---|---|---|---|
| Quadrant D | 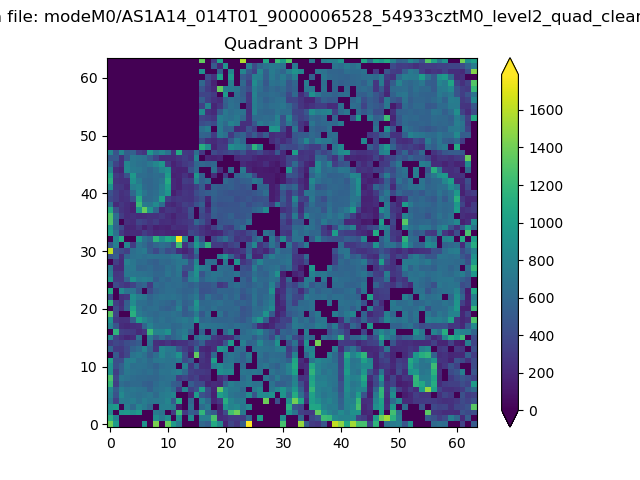 |
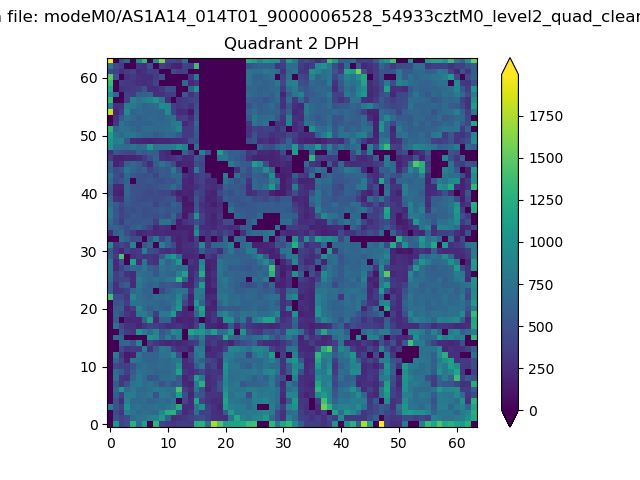 |
Quadrant C |
| Plot type | Count rate plots | Images |
|---|---|---|
| Comparison with Poisson distribution Blue bars denote a histogram of data divided into 1 sec bins. Red curve is a Poisson curve with rate = median count rate of data. |
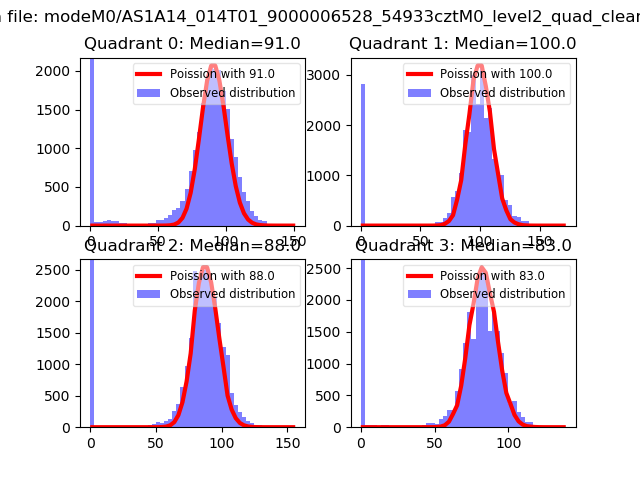 |
 |
| Quadrant-wise count rates Data is divided into 100 sec bins |
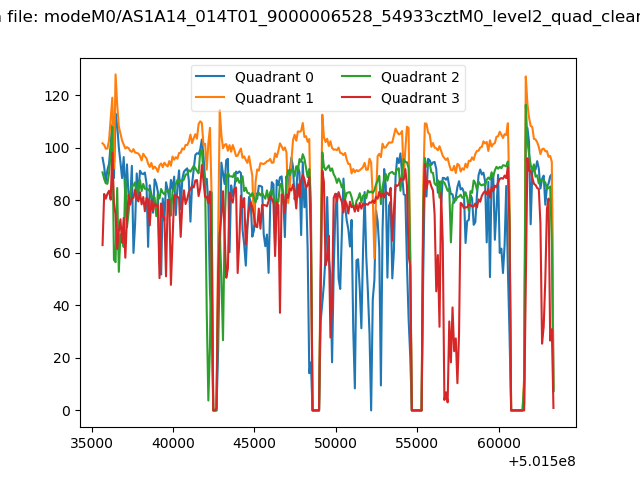 |
|
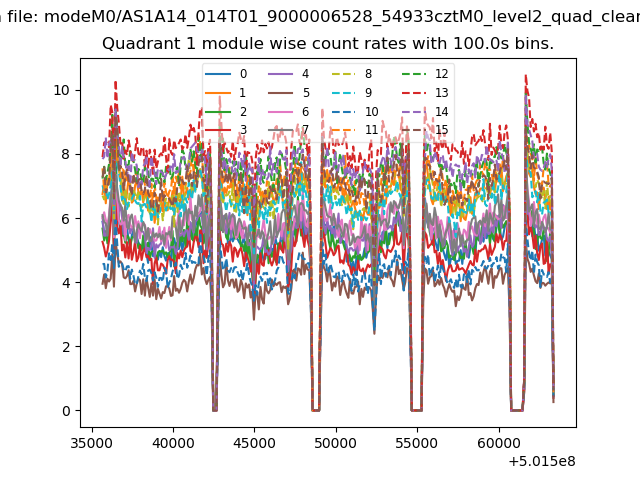
| Module-wise count rates for Quadrant A Data is divided into 100 sec bins |
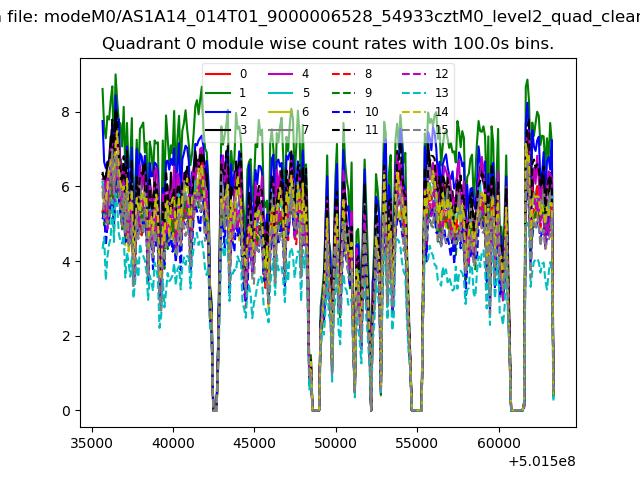 |
 |
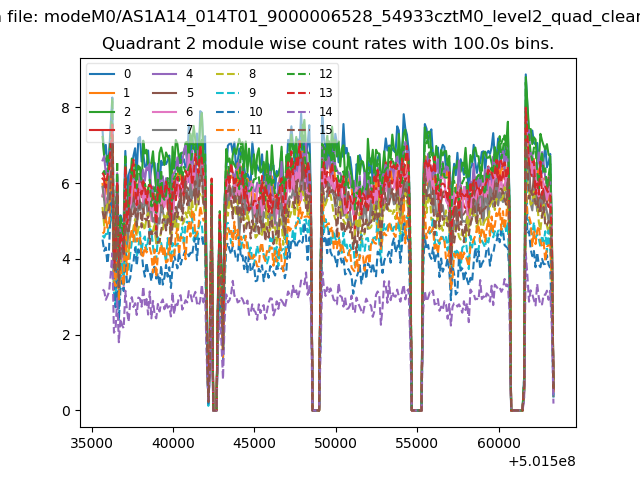
| Module-wise count rates for Quadrant B Data is divided into 100 sec bins |
 |
 |
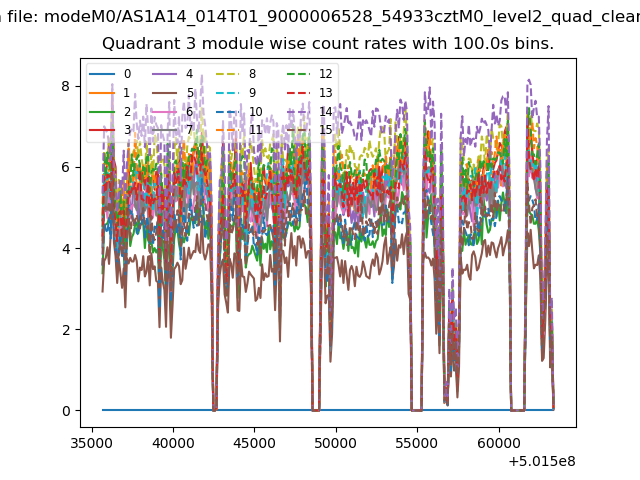
| Module-wise count rates for Quadrant C Data is divided into 100 sec bins |
 |
 |
| Module-wise count rates for Quadrant D Data is divided into 100 sec bins |
 |
 |
| Parameter | Plot |
|---|---|
| CZT HV Monitor | 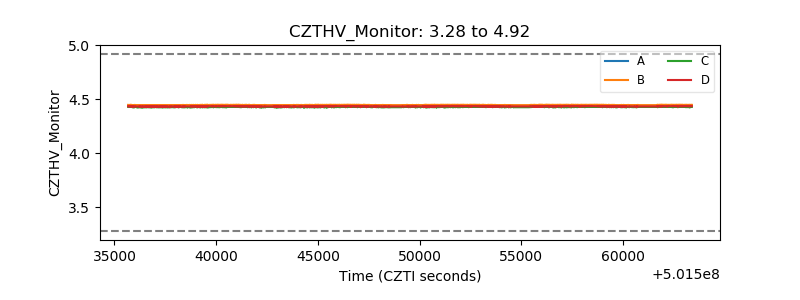 |
| D_VDD | 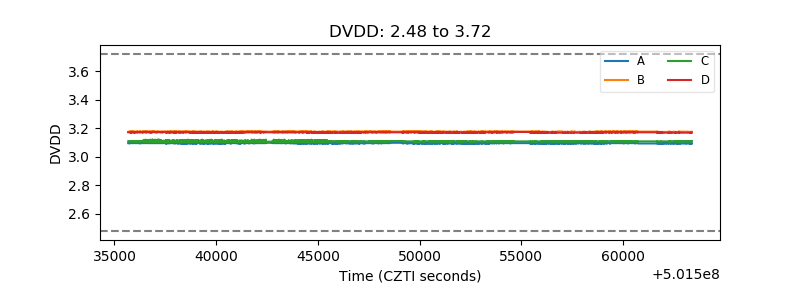 |
| Temperature 1 | 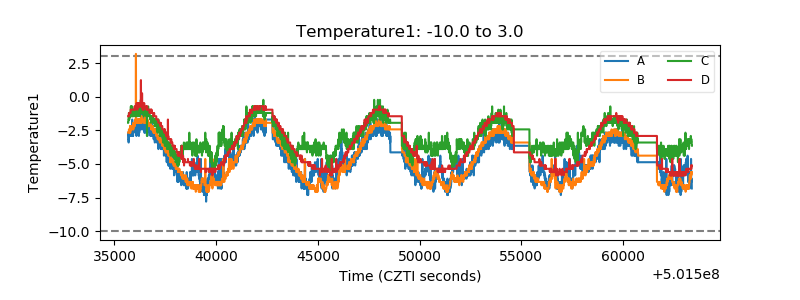 |
| Veto HV Monitor | 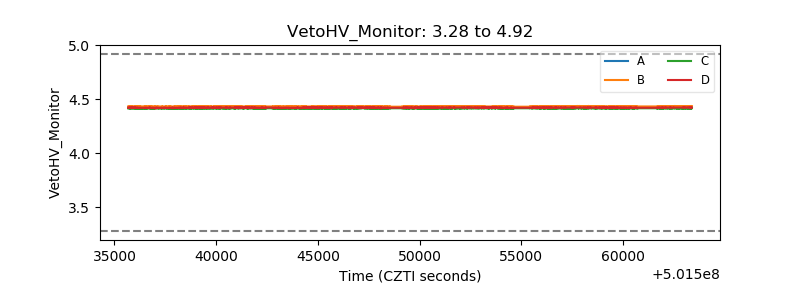 |
| Veto LLD |  |
| Alpha Counter | 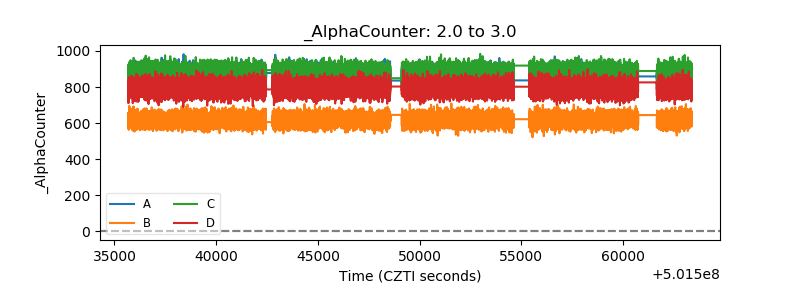 |
| _CPM_Rate | 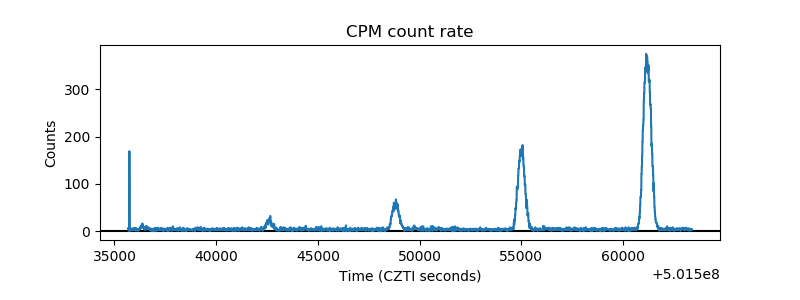 |
| CZT Counter | 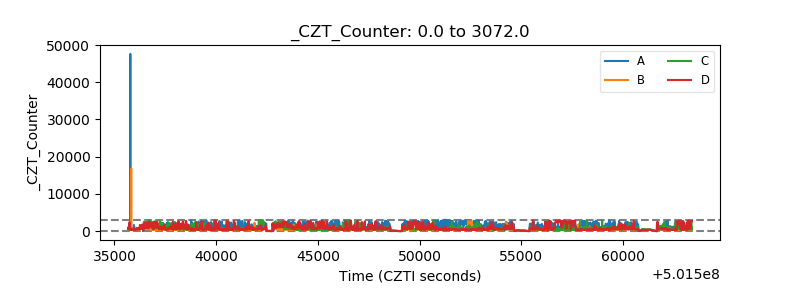 |
| +2.5 Volts monitor | 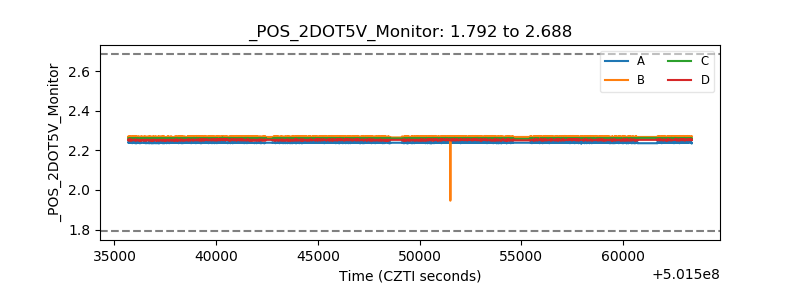 |
| +5 Volts monitor |  |
| _ROLL_ROT | 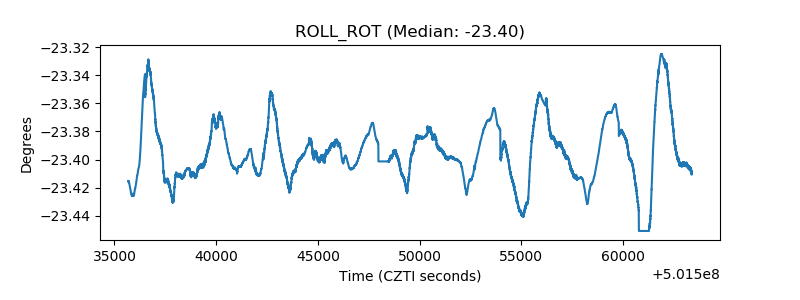 |
| _Roll_DEC | 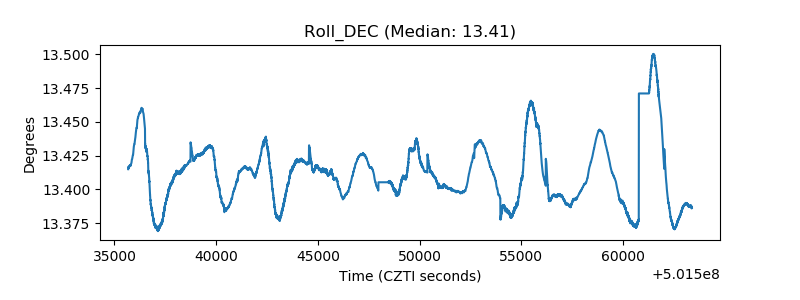 |
| _Roll_RA | 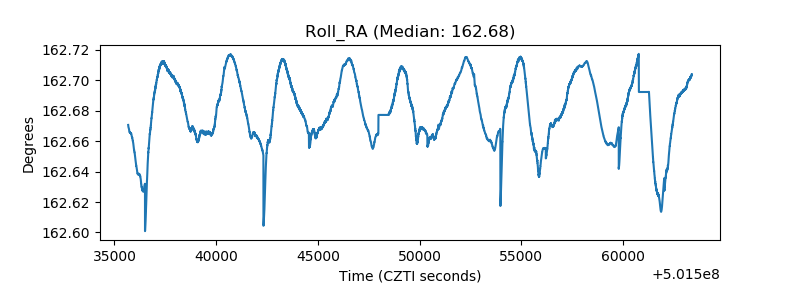 |
| Veto Counter | 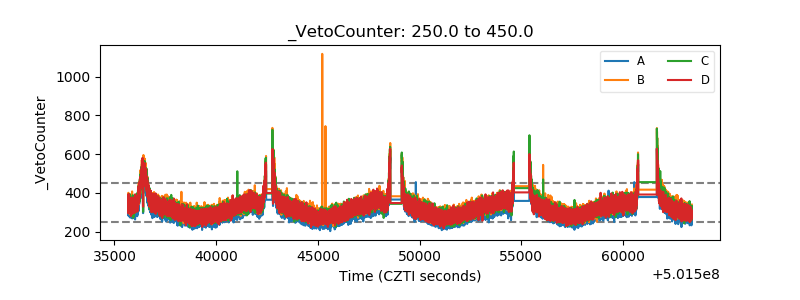 |