| Param | Original file | Final file |
|---|---|---|
| Filename | modeM0/AS1A14_014T01_9000006528_54935cztM0_level2.fits | modeM0/AS1A14_014T01_9000006528_54935cztM0_level2_quad_clean.evt |
| Size (bytes) | 3,184,764,480 | 465,261,120 |
| Size | 3.0 GB | 443.7 MB |
| Events in quadrant A | 39,097,307 | 2,790,560 |
| Events in quadrant B | 16,563,378 | 3,409,944 |
| Events in quadrant C | 27,745,235 | 2,938,469 |
| Events in quadrant D | 31,830,537 | 2,580,160 |
| Mode M0 | |||
|---|---|---|---|
| Quadrant | BADHDUFLAG | Total packets | Discarded packets |
| A | 0 | 140414 | 7 |
| B | 0 | 76109 | 6 |
| C | 0 | 106636 | 8 |
| D | 0 | 118949 | 6 |
| Mode SS | |||
|---|---|---|---|
| Quadrant | BADHDUFLAG | Total packets | Discarded packets |
| A | 0 | 696 | 0 |
| B | 0 | 696 | 0 |
| C | 0 | 696 | 0 |
| D | 0 | 696 | 0 |
| Mode M9 | |||
|---|---|---|---|
| Quadrant | BADHDUFLAG | Total packets | Discarded packets |
| A | 0 | 27 | 0 |
| B | 0 | 27 | 0 |
| C | 0 | 27 | 0 |
| D | 0 | 27 | 0 |
| Quadrant | Total seconds | Saturated seconds | Saturation percentage |
|---|---|---|---|
| A | 34446 | 5704 | 16.559252% |
| B | 34447 | 634 | 1.840509% |
| C | 34446 | 1705 | 4.949776% |
| D | 34446 | 4202 | 12.198804% |
Noise dominated data is calculated using 1-second bins in cleaned event files. If a bin has >2000 counts, and if more than 50% of those come from <1% of pixels, then it is considered to be noise-dominated and hence unusable.
| Quadrant | # 1 sec bins | Bins with >0 counts | Bins with >2000 counts | High rate bins dominated by noise | Noise dominated (total time) | Noise dominated (detector-on time) | Marked lightcurve |
|---|---|---|---|---|---|---|---|
| A | 38424 | 34450 | 5025 | 5025 | 13.08% | 14.59% | 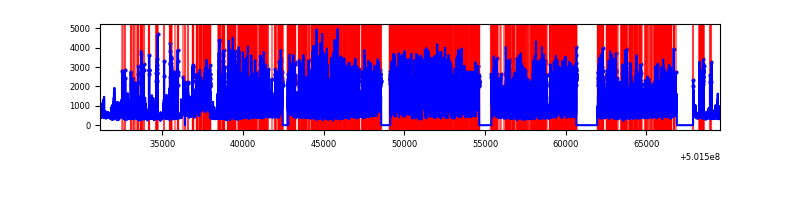 |
| B | 38425 | 34453 | 315 | 315 | 0.82% | 0.91% | 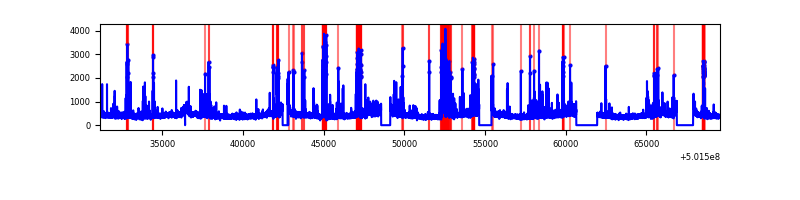 |
| C | 38425 | 34453 | 1476 | 1476 | 3.84% | 4.28% | 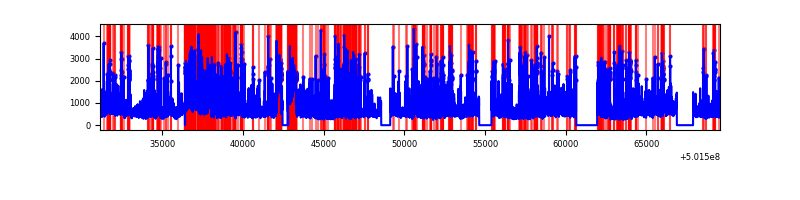 |
| D | 38425 | 34452 | 3981 | 3981 | 10.36% | 11.56% | 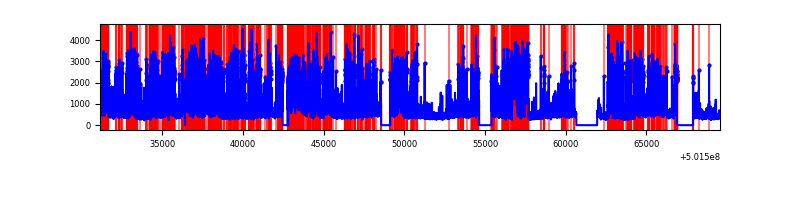 |
Top three noisy pixels from each quadrant. If the there are fewer than three noisy pixels in the level2.evt file, extra rows are filled as -1
| Pixel properties | Quadrant properties | ||||||
|---|---|---|---|---|---|---|---|
| Quadrant | DetID | PixID | Counts | Sigma | Mean | Median | Sigma |
| A | 3 | 14 | 12786974 | 15370.46 | 3356 | 3272 | 831.7 |
| A | 3 | 45 | 10679328 | 12836.34 | 3356 | 3272 | 831.7 |
| A | 13 | 248 | 1115430 | 1337.2 | 3356 | 3272 | 831.7 |
| B | 5 | 185 | 1266621 | 1653.54 | 3556 | 3421 | 763.9 |
| B | 5 | 172 | 297156 | 384.5 | 3556 | 3421 | 763.9 |
| B | 4 | 81 | 214176 | 275.88 | 3556 | 3421 | 763.9 |
| C | 12 | 252 | 6347374 | 6687.62 | 3443 | 3416 | 948.6 |
| C | 1 | 16 | 1717327 | 1806.76 | 3443 | 3416 | 948.6 |
| C | 7 | 2 | 1340107 | 1409.1 | 3443 | 3416 | 948.6 |
| D | 2 | 249 | 6508792 | 6884.01 | 3305 | 3155 | 945.0 |
| D | 11 | 129 | 3337616 | 3528.39 | 3305 | 3155 | 945.0 |
| D | 6 | 239 | 1456904 | 1538.3 | 3305 | 3155 | 945.0 |
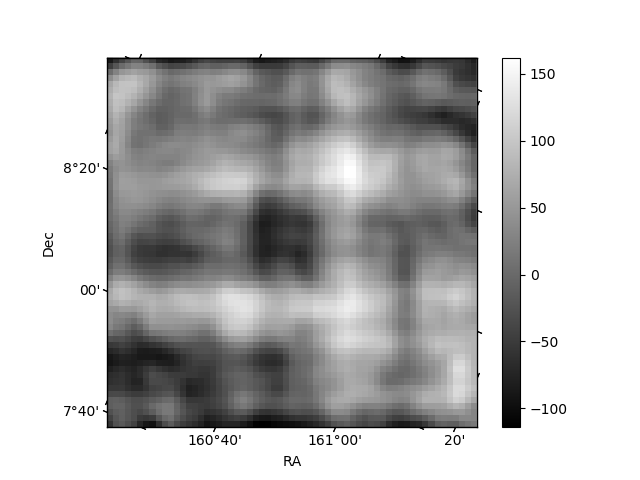
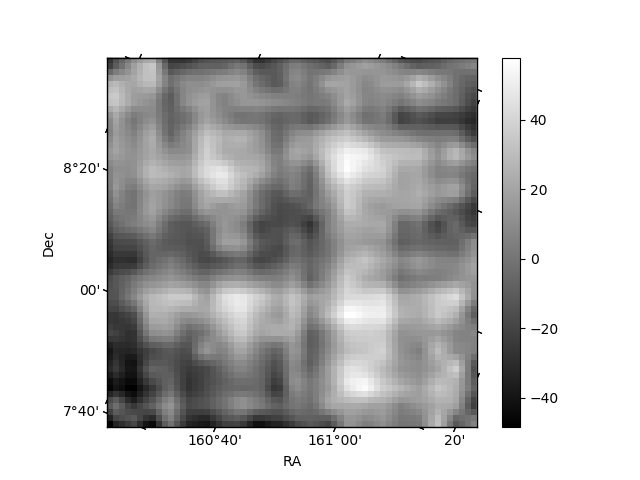
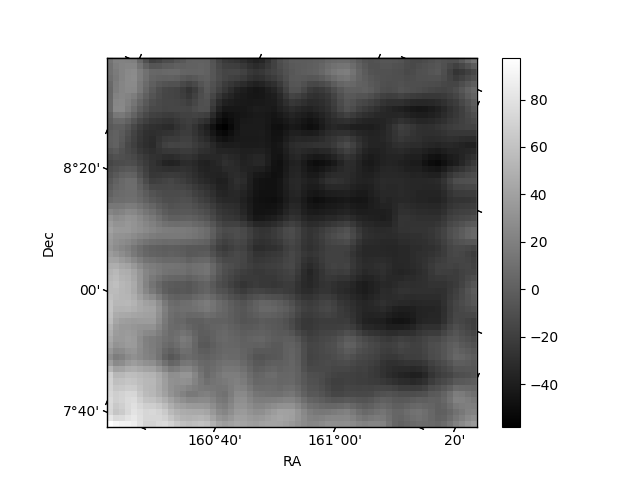
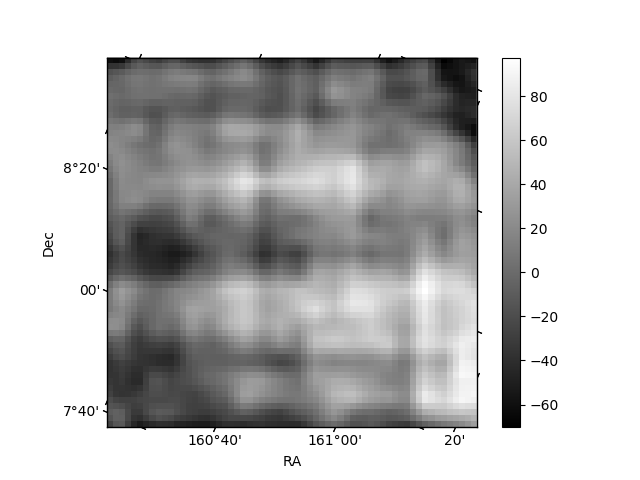
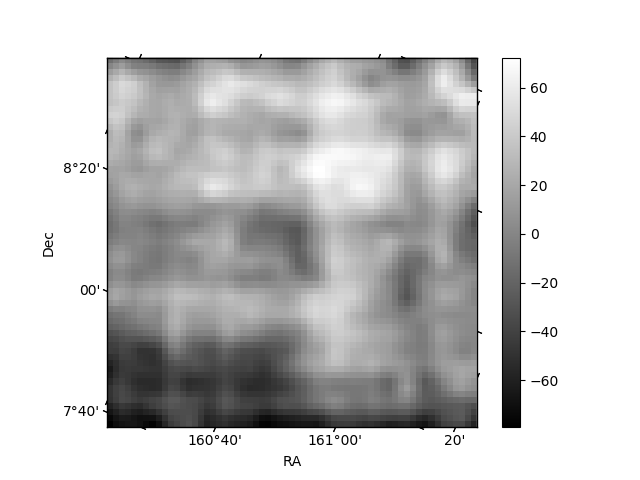
Histogram calculated using DETX and DETY for each event in the final _common_clean file
| Quadrant A | 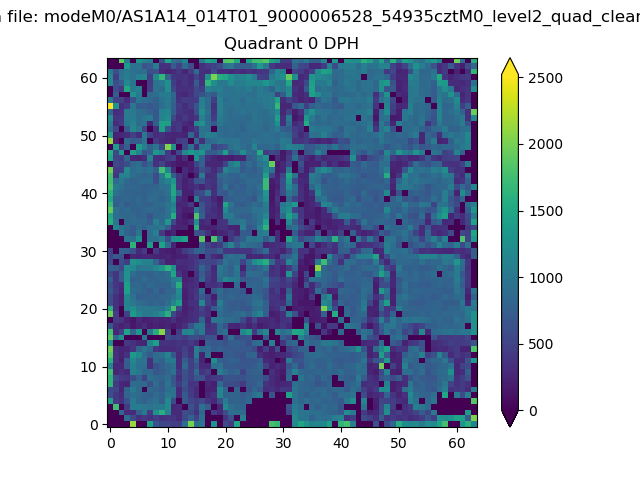 |
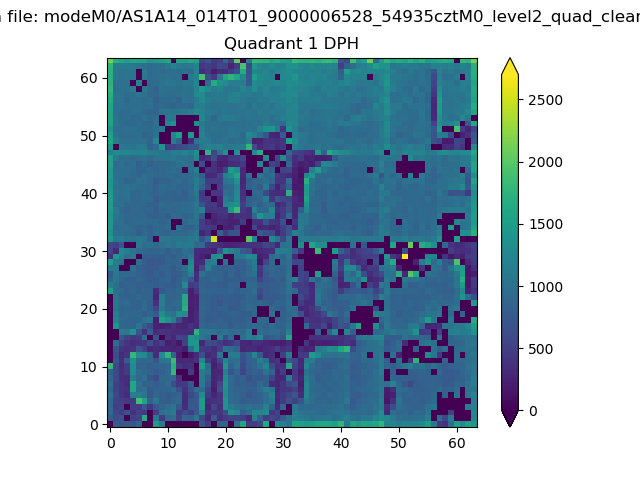 |
Quadrant B |
|---|---|---|---|
| Quadrant D |  |
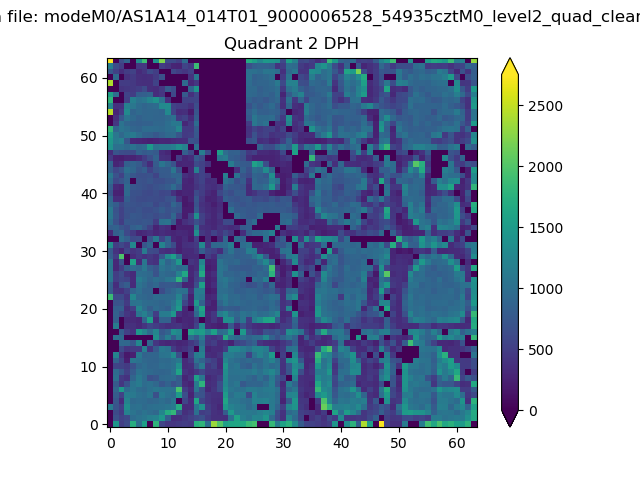 |
Quadrant C |
| Plot type | Count rate plots | Images |
|---|---|---|
| Comparison with Poisson distribution Blue bars denote a histogram of data divided into 1 sec bins. Red curve is a Poisson curve with rate = median count rate of data. |
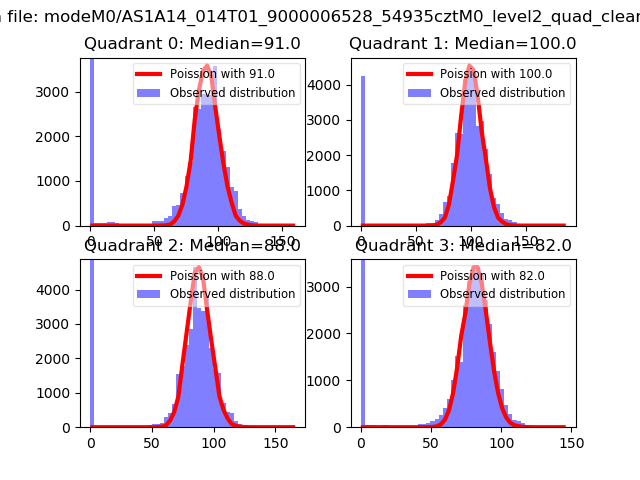 |
 |
| Quadrant-wise count rates Data is divided into 100 sec bins |
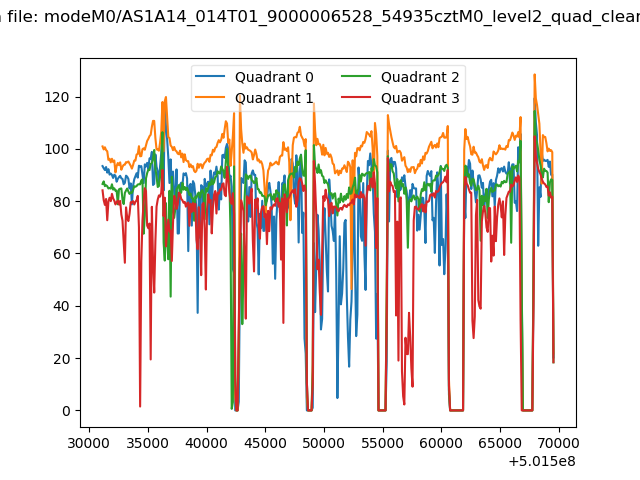 |
|
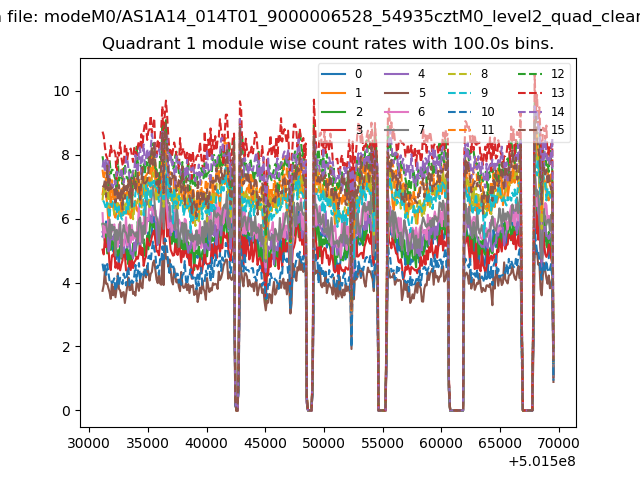
| Module-wise count rates for Quadrant A Data is divided into 100 sec bins |
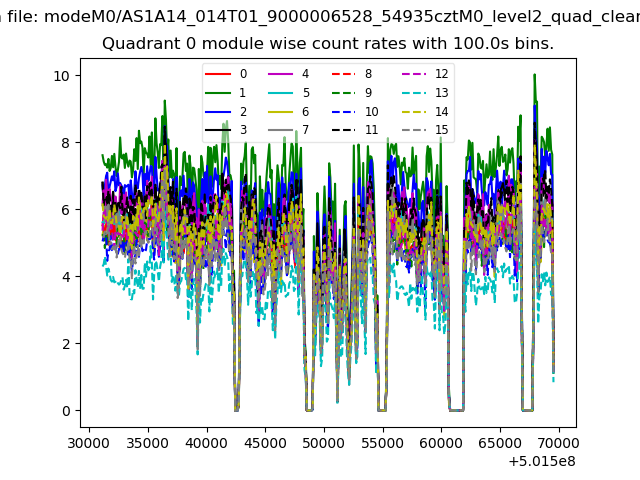 |
 |
| Module-wise count rates for Quadrant B Data is divided into 100 sec bins |
 |
 |
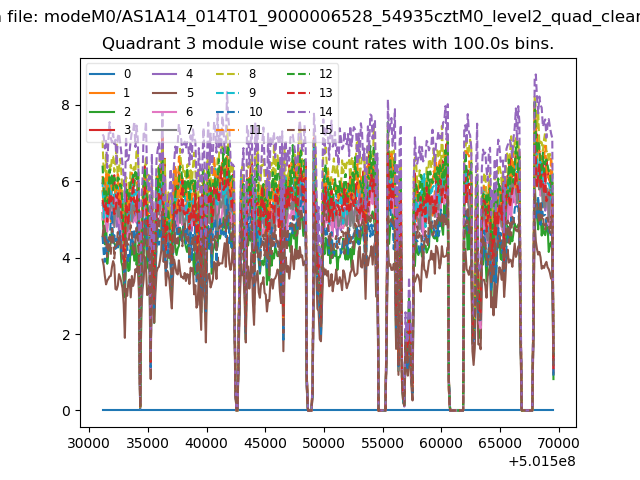
| Module-wise count rates for Quadrant C Data is divided into 100 sec bins |
 |
 |
| Module-wise count rates for Quadrant D Data is divided into 100 sec bins |
 |
 |
| Parameter | Plot |
|---|---|
| CZT HV Monitor |  |
| D_VDD | 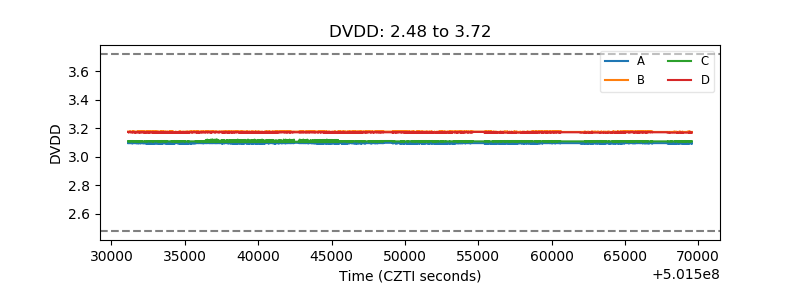 |
| Temperature 1 | 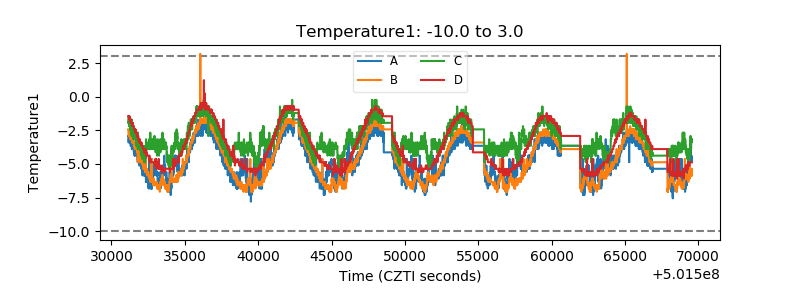 |
| Veto HV Monitor | 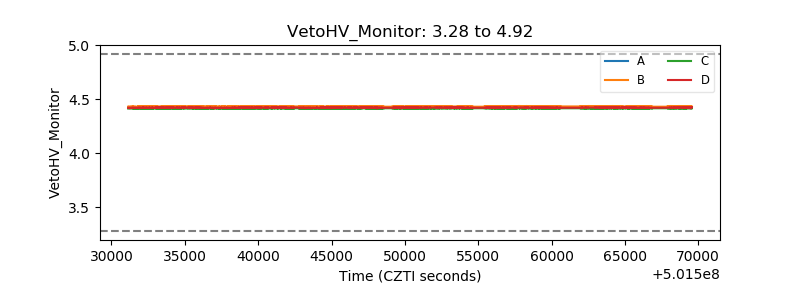 |
| Veto LLD | 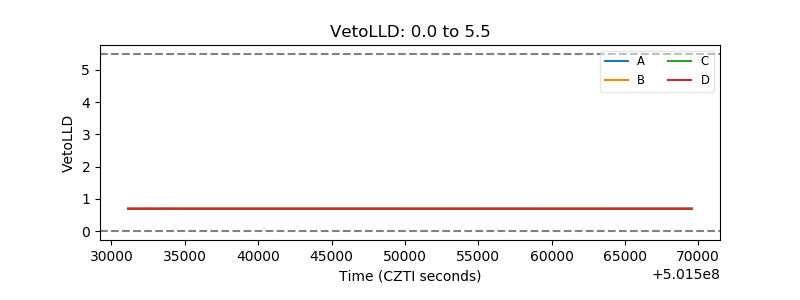 |
| Alpha Counter | 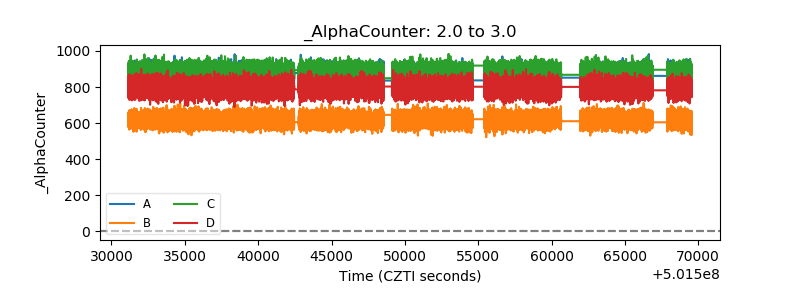 |
| _CPM_Rate | 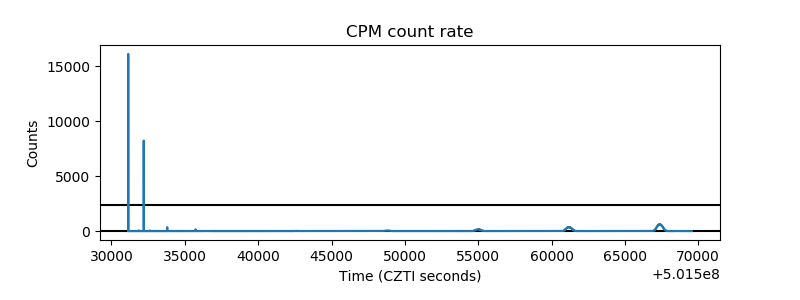 |
| CZT Counter | 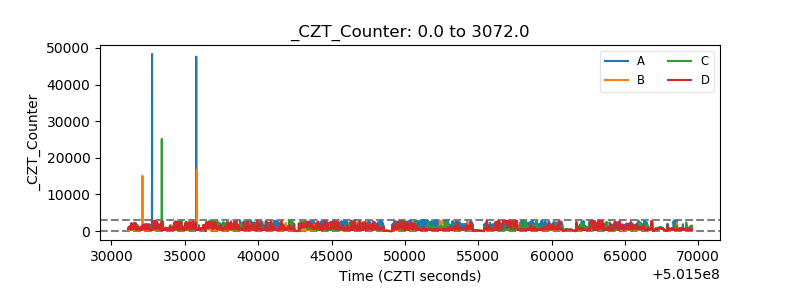 |
| +2.5 Volts monitor |  |
| +5 Volts monitor |  |
| _ROLL_ROT | 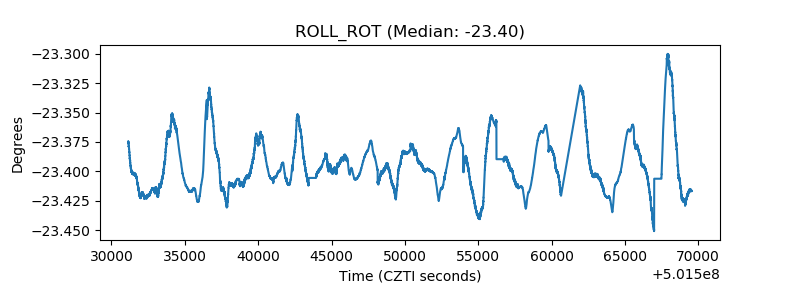 |
| _Roll_DEC | 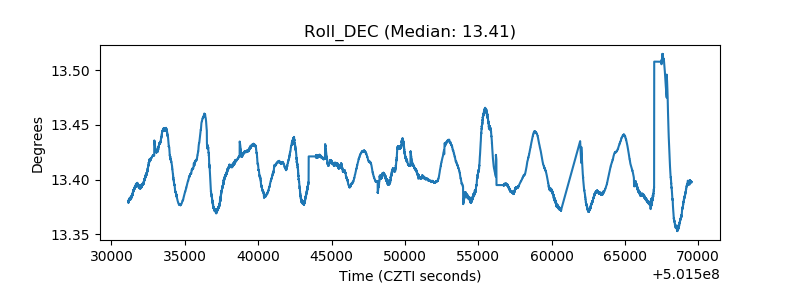 |
| _Roll_RA | 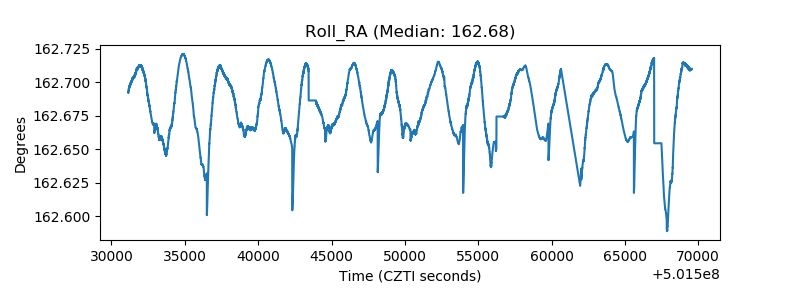 |
| Veto Counter | 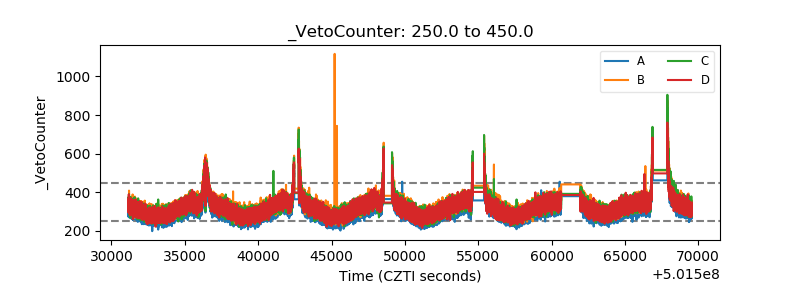 |