| Param | Original file | Final file |
|---|---|---|
| Filename | modeM0/AS1A14_014T01_9000006528_54937cztM0_level2.fits | modeM0/AS1A14_014T01_9000006528_54937cztM0_level2_quad_clean.evt |
| Size (bytes) | 458,668,800 | 97,542,720 |
| Size | 437.4 MB | 93.0 MB |
| Events in quadrant A | 4,161,868 | 627,622 |
| Events in quadrant B | 2,954,699 | 701,792 |
| Events in quadrant C | 4,952,121 | 597,324 |
| Events in quadrant D | 4,397,961 | 567,631 |
| Mode M0 | |||
|---|---|---|---|
| Quadrant | BADHDUFLAG | Total packets | Discarded packets |
| A | 0 | 16893 | 2 |
| B | 0 | 13710 | 2 |
| C | 0 | 19330 | 2 |
| D | 0 | 17742 | 2 |
| Mode SS | |||
|---|---|---|---|
| Quadrant | BADHDUFLAG | Total packets | Discarded packets |
| A | 0 | 134 | 0 |
| B | 0 | 134 | 0 |
| C | 0 | 134 | 0 |
| D | 0 | 134 | 0 |
| Mode M9 | |||
|---|---|---|---|
| Quadrant | BADHDUFLAG | Total packets | Discarded packets |
| A | 0 | 16 | 0 |
| B | 0 | 17 | 0 |
| C | 0 | 17 | 0 |
| D | 0 | 17 | 0 |
| Quadrant | Total seconds | Saturated seconds | Saturation percentage |
|---|---|---|---|
| A | 6585 | 372 | 5.649203% |
| B | 6585 | 104 | 1.579347% |
| C | 6585 | 439 | 6.666667% |
| D | 6584 | 248 | 3.766707% |
Noise dominated data is calculated using 1-second bins in cleaned event files. If a bin has >2000 counts, and if more than 50% of those come from <1% of pixels, then it is considered to be noise-dominated and hence unusable.
| Quadrant | # 1 sec bins | Bins with >0 counts | Bins with >2000 counts | High rate bins dominated by noise | Noise dominated (total time) | Noise dominated (detector-on time) | Marked lightcurve |
|---|---|---|---|---|---|---|---|
| A | 7705 | 6586 | 308 | 308 | 4.00% | 4.68% | 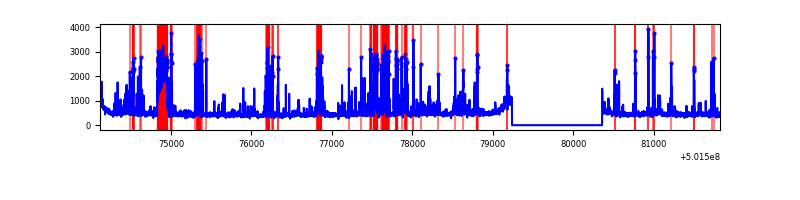 |
| B | 7705 | 6585 | 10 | 10 | 0.13% | 0.15% | 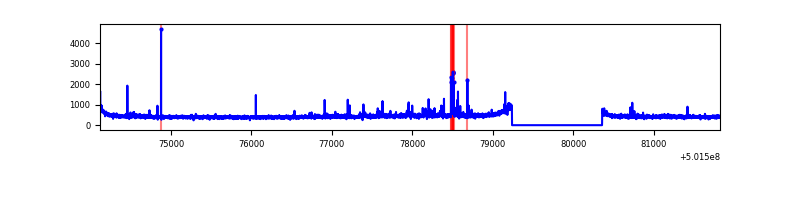 |
| C | 7705 | 6586 | 378 | 378 | 4.91% | 5.74% | 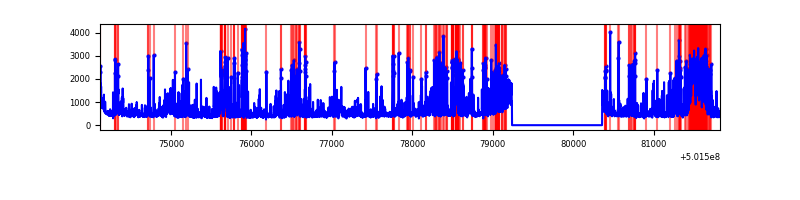 |
| D | 7704 | 6584 | 174 | 174 | 2.26% | 2.64% | 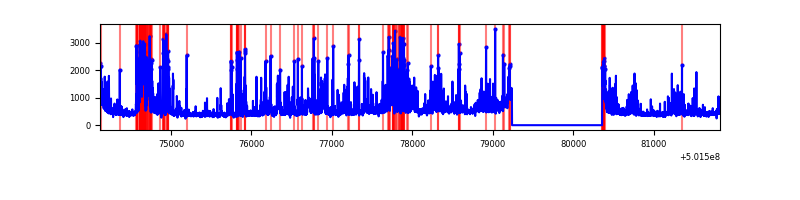 |
Top three noisy pixels from each quadrant. If the there are fewer than three noisy pixels in the level2.evt file, extra rows are filled as -1
| Pixel properties | Quadrant properties | ||||||
|---|---|---|---|---|---|---|---|
| Quadrant | DetID | PixID | Counts | Sigma | Mean | Median | Sigma |
| A | 3 | 45 | 724502 | 4133.72 | 712 | 694 | 175.1 |
| A | 5 | 241 | 275248 | 1568.0 | 712 | 694 | 175.1 |
| A | 3 | 14 | 171576 | 975.92 | 712 | 694 | 175.1 |
| B | 7 | 252 | 53693 | 343.85 | 715 | 690 | 154.1 |
| B | 0 | 182 | 31333 | 198.79 | 715 | 690 | 154.1 |
| B | 12 | 111 | 18853 | 117.83 | 715 | 690 | 154.1 |
| C | 12 | 252 | 932079 | 4916.72 | 687 | 680 | 189.4 |
| C | 4 | 5 | 916091 | 4832.32 | 687 | 680 | 189.4 |
| C | 14 | 254 | 247696 | 1303.96 | 687 | 680 | 189.4 |
| D | 2 | 249 | 476645 | 2424.08 | 692 | 663 | 196.4 |
| D | 2 | 207 | 252446 | 1282.28 | 692 | 663 | 196.4 |
| D | 3 | 224 | 225996 | 1147.57 | 692 | 663 | 196.4 |
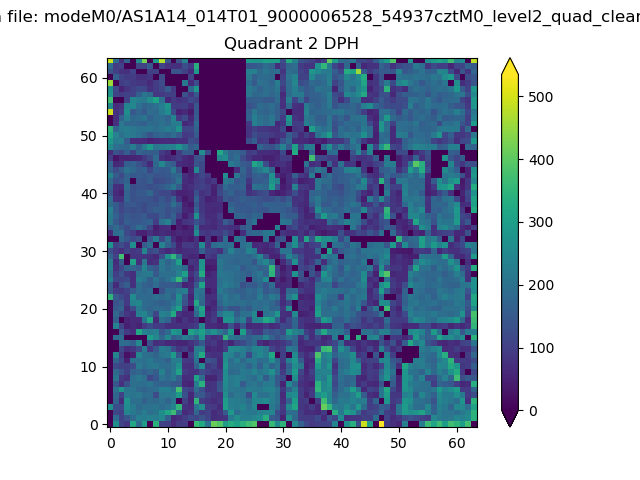
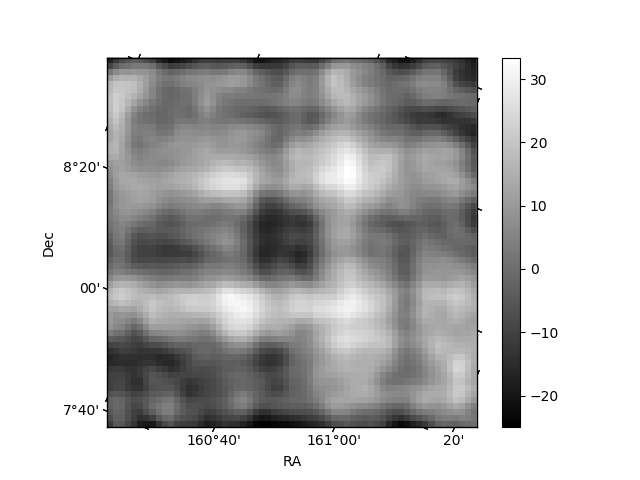
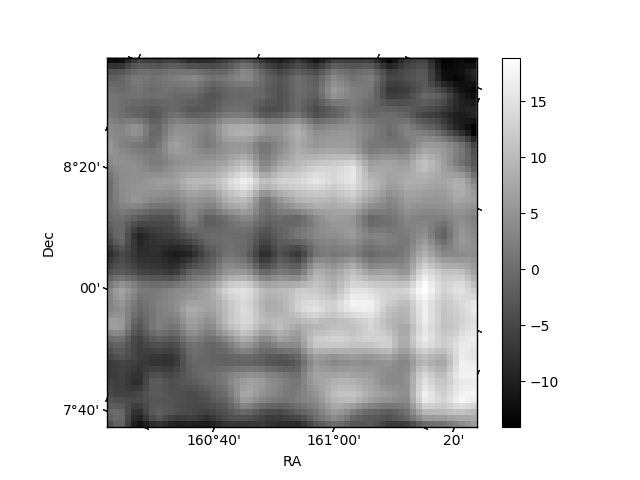
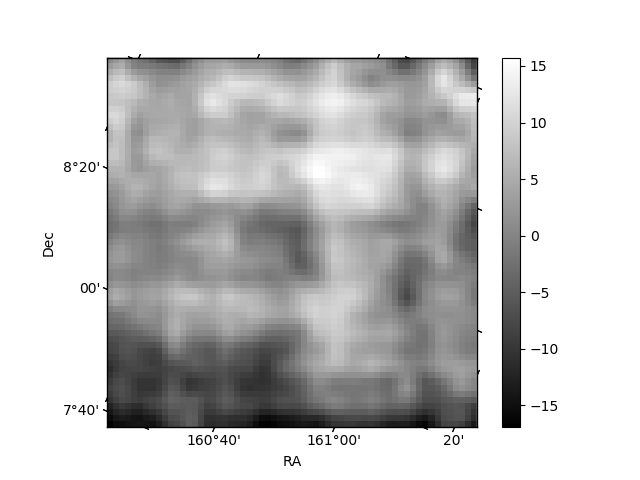
Histogram calculated using DETX and DETY for each event in the final _common_clean file
| Quadrant A | 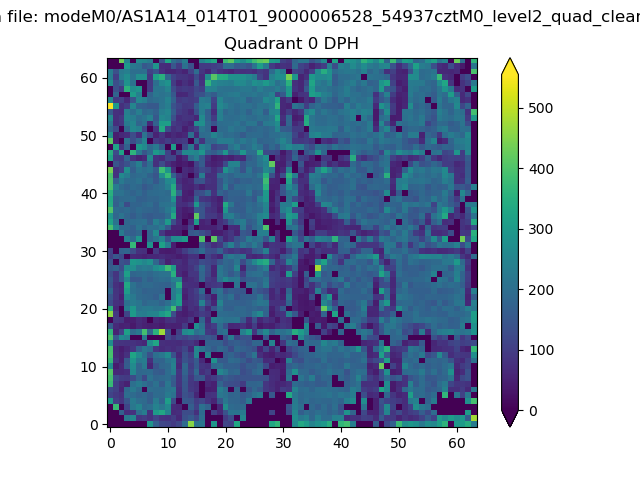 |
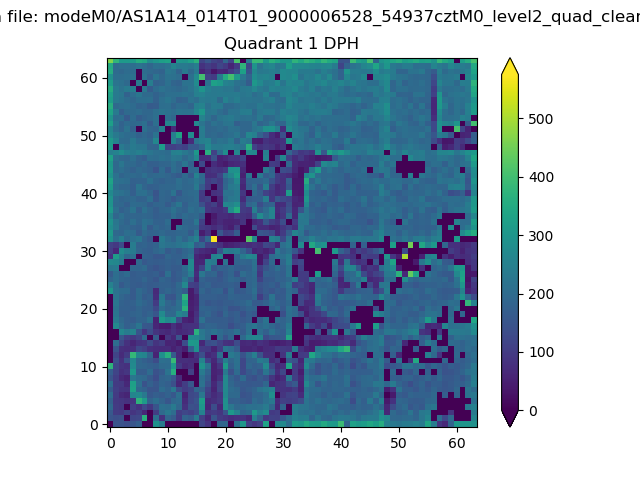 |
Quadrant B |
|---|---|---|---|
| Quadrant D | 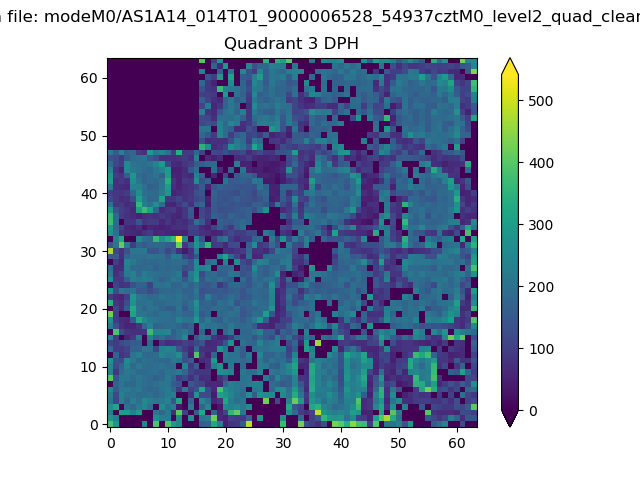 |
 |
Quadrant C |
| Plot type | Count rate plots | Images |
|---|---|---|
| Comparison with Poisson distribution Blue bars denote a histogram of data divided into 1 sec bins. Red curve is a Poisson curve with rate = median count rate of data. |
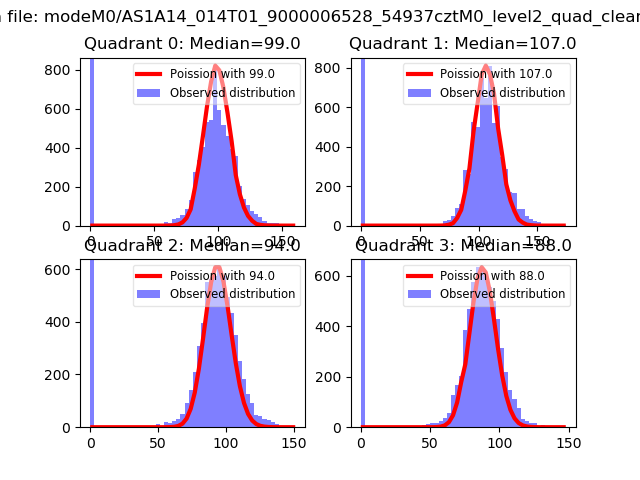 |
 |
| Quadrant-wise count rates Data is divided into 100 sec bins |
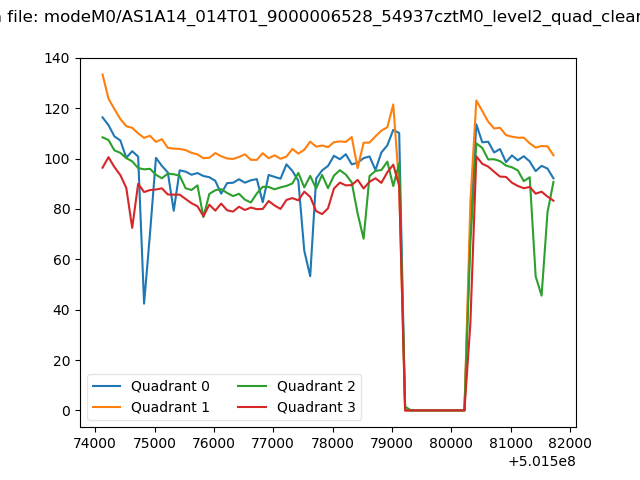 |
|
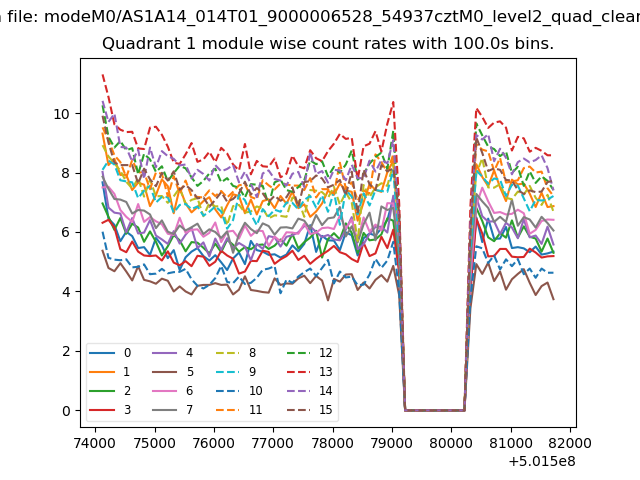
| Module-wise count rates for Quadrant A Data is divided into 100 sec bins |
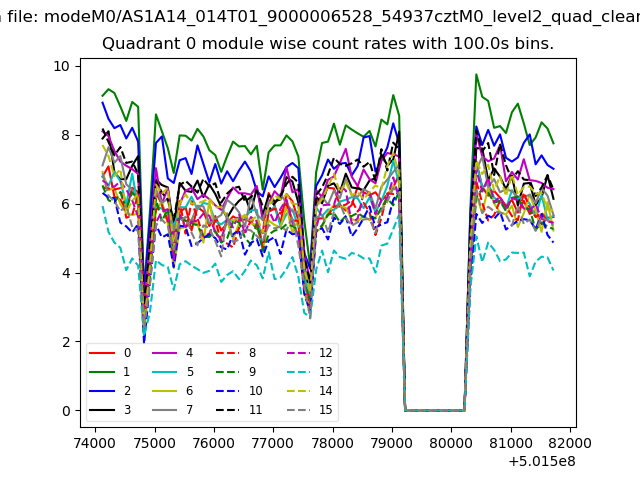 |
 |
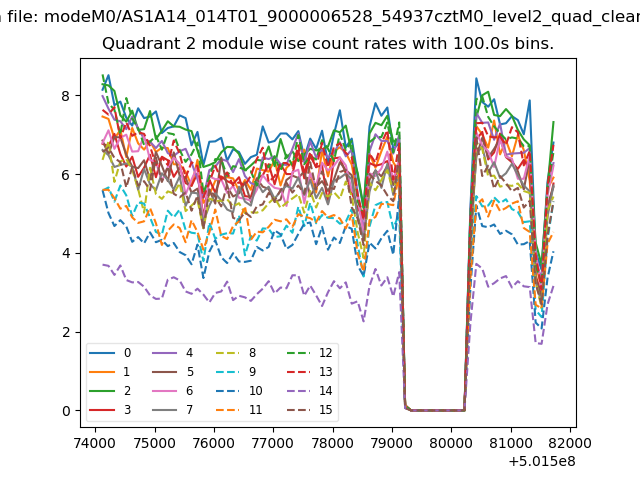
| Module-wise count rates for Quadrant B Data is divided into 100 sec bins |
 |
 |
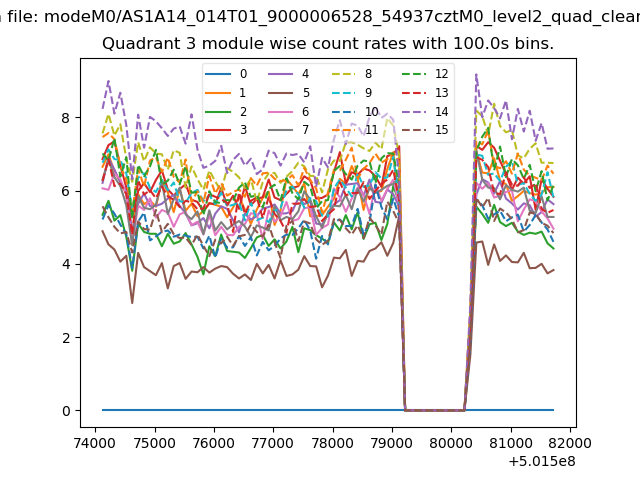
| Module-wise count rates for Quadrant C Data is divided into 100 sec bins |
 |
 |
| Module-wise count rates for Quadrant D Data is divided into 100 sec bins |
 |
 |
| Parameter | Plot |
|---|---|
| CZT HV Monitor | 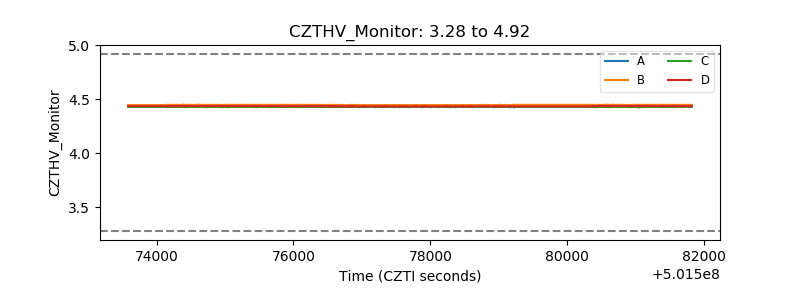 |
| D_VDD | 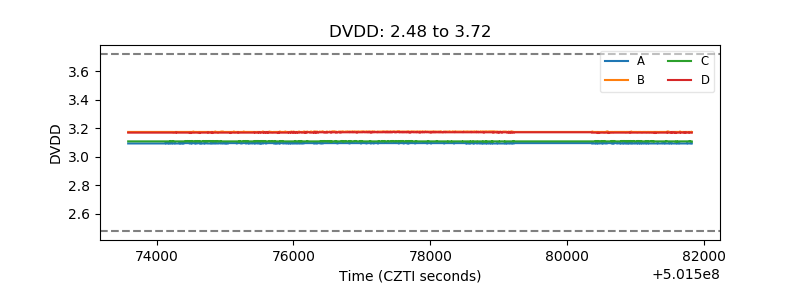 |
| Temperature 1 | 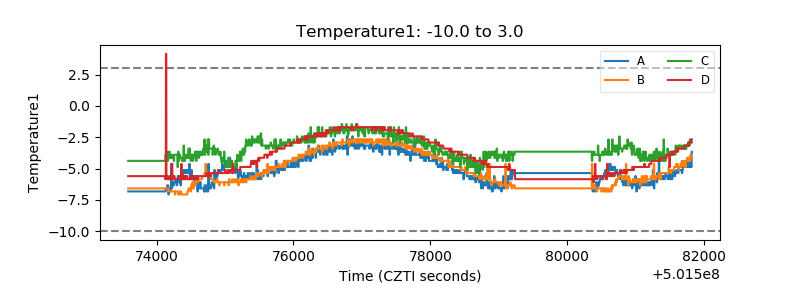 |
| Veto HV Monitor | 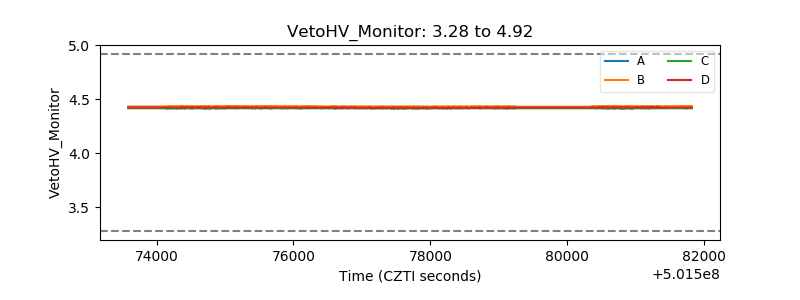 |
| Veto LLD | 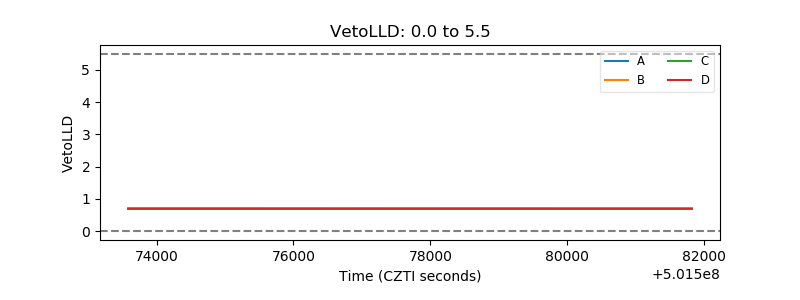 |
| Alpha Counter | 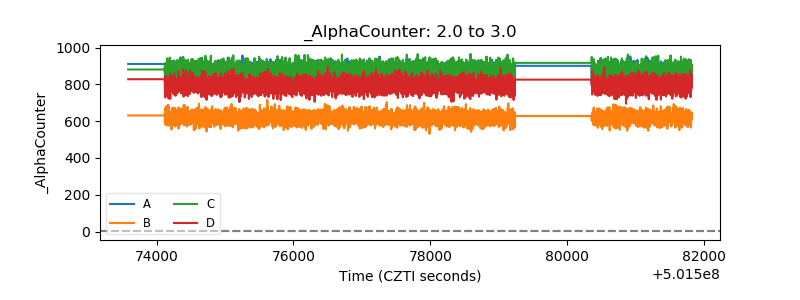 |
| _CPM_Rate | 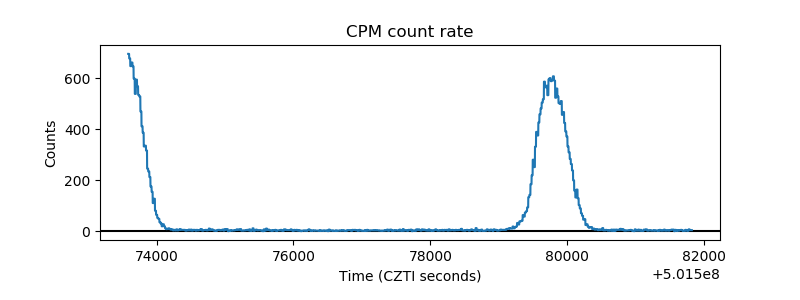 |
| CZT Counter | 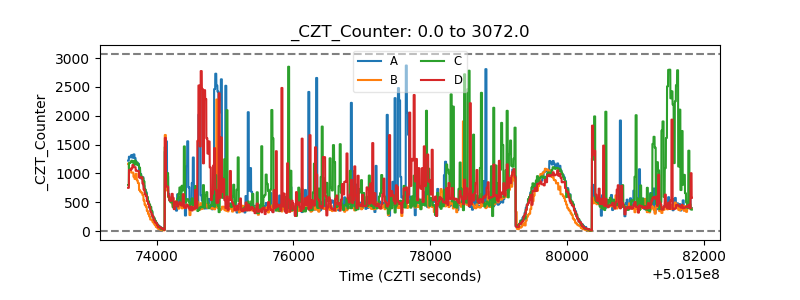 |
| +2.5 Volts monitor |  |
| +5 Volts monitor |  |
| _ROLL_ROT | 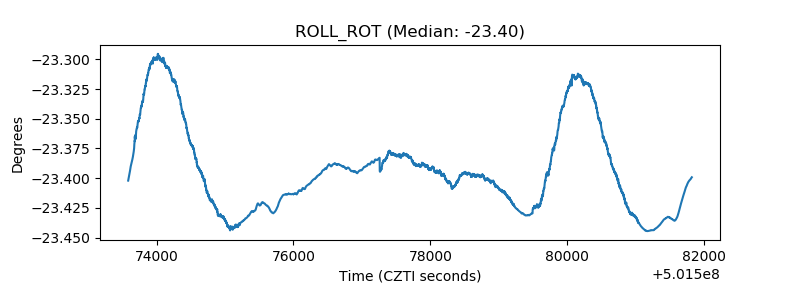 |
| _Roll_DEC | 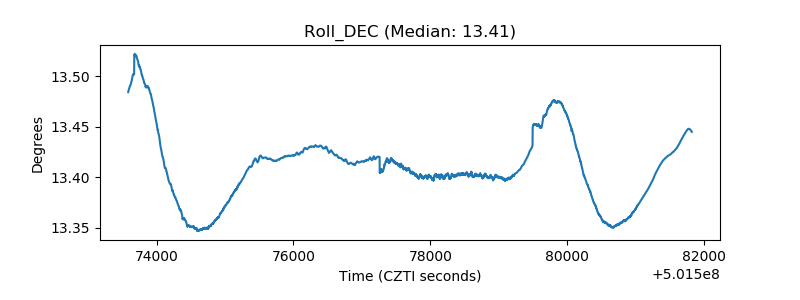 |
| _Roll_RA | 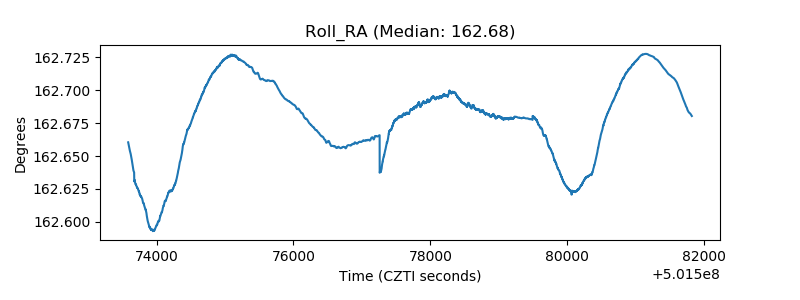 |
| Veto Counter | 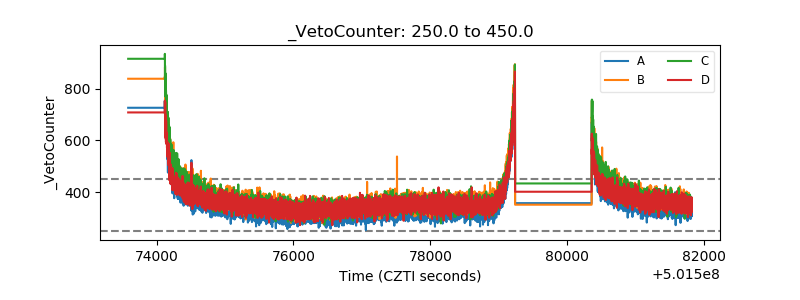 |