| Param | Original file | Final file |
|---|---|---|
| Filename | modeM0/AS1A14_014T01_9000006528_54938cztM0_level2.fits | modeM0/AS1A14_014T01_9000006528_54938cztM0_level2_quad_clean.evt |
| Size (bytes) | 482,731,200 | 96,894,720 |
| Size | 460.4 MB | 92.4 MB |
| Events in quadrant A | 3,686,348 | 639,991 |
| Events in quadrant B | 2,944,126 | 700,444 |
| Events in quadrant C | 6,160,967 | 568,154 |
| Events in quadrant D | 4,565,788 | 565,895 |
| Mode M0 | |||
|---|---|---|---|
| Quadrant | BADHDUFLAG | Total packets | Discarded packets |
| A | 0 | 15267 | 2 |
| B | 0 | 13646 | 5 |
| C | 0 | 22967 | 10 |
| D | 0 | 18168 | 2 |
| Mode SS | |||
|---|---|---|---|
| Quadrant | BADHDUFLAG | Total packets | Discarded packets |
| A | 0 | 134 | 0 |
| B | 0 | 134 | 0 |
| C | 0 | 134 | 0 |
| D | 0 | 134 | 0 |
| Mode M9 | |||
|---|---|---|---|
| Quadrant | BADHDUFLAG | Total packets | Discarded packets |
| A | 0 | 16 | 0 |
| B | 0 | 16 | 0 |
| C | 0 | 17 | 0 |
| D | 0 | 17 | 0 |
| Quadrant | Total seconds | Saturated seconds | Saturation percentage |
|---|---|---|---|
| A | 6589 | 182 | 2.762179% |
| B | 6587 | 85 | 1.290421% |
| C | 6587 | 801 | 12.160316% |
| D | 6589 | 243 | 3.687965% |
Noise dominated data is calculated using 1-second bins in cleaned event files. If a bin has >2000 counts, and if more than 50% of those come from <1% of pixels, then it is considered to be noise-dominated and hence unusable.
| Quadrant | # 1 sec bins | Bins with >0 counts | Bins with >2000 counts | High rate bins dominated by noise | Noise dominated (total time) | Noise dominated (detector-on time) | Marked lightcurve |
|---|---|---|---|---|---|---|---|
| A | 7679 | 6589 | 103 | 103 | 1.34% | 1.56% | 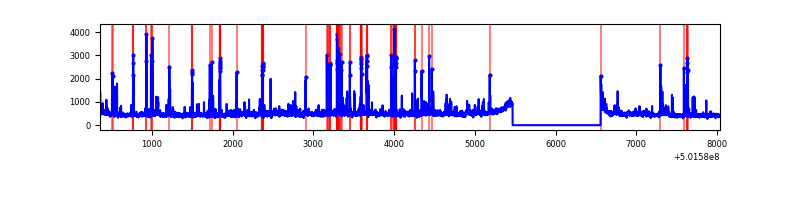 |
| B | 7679 | 6588 | 4 | 4 | 0.05% | 0.06% | 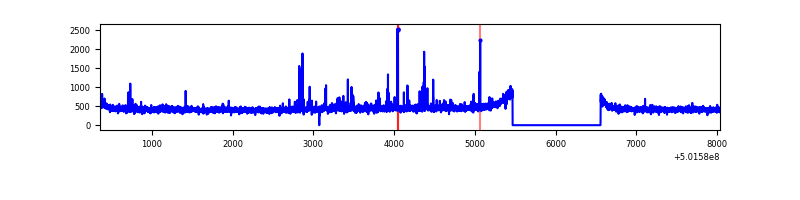 |
| C | 7679 | 6589 | 664 | 664 | 8.65% | 10.08% | 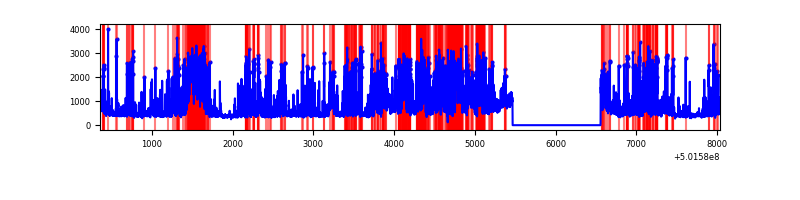 |
| D | 7679 | 6590 | 179 | 179 | 2.33% | 2.72% | 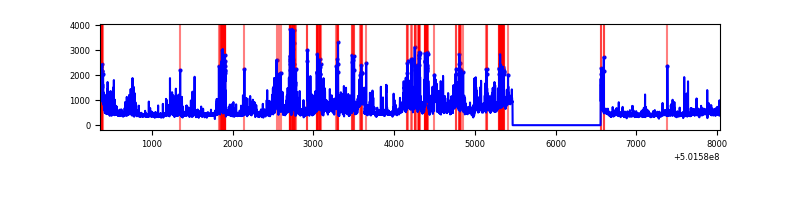 |
Top three noisy pixels from each quadrant. If the there are fewer than three noisy pixels in the level2.evt file, extra rows are filled as -1
| Pixel properties | Quadrant properties | ||||||
|---|---|---|---|---|---|---|---|
| Quadrant | DetID | PixID | Counts | Sigma | Mean | Median | Sigma |
| A | 3 | 45 | 491747 | 2744.49 | 723 | 705 | 178.9 |
| A | 3 | 14 | 324273 | 1808.45 | 723 | 705 | 178.9 |
| A | 5 | 241 | 25704 | 139.72 | 723 | 705 | 178.9 |
| B | 0 | 182 | 70786 | 452.1 | 715 | 688 | 155.0 |
| B | 7 | 252 | 25842 | 162.23 | 715 | 688 | 155.0 |
| B | 12 | 111 | 18525 | 115.04 | 715 | 688 | 155.0 |
| C | 4 | 5 | 2492980 | 13345.61 | 677 | 670 | 186.8 |
| C | 12 | 252 | 525021 | 2807.75 | 677 | 670 | 186.8 |
| C | 6 | 223 | 197100 | 1051.83 | 677 | 670 | 186.8 |
| D | 6 | 46 | 445182 | 2253.56 | 695 | 665 | 197.3 |
| D | 2 | 172 | 299596 | 1515.49 | 695 | 665 | 197.3 |
| D | 11 | 129 | 220343 | 1113.7 | 695 | 665 | 197.3 |
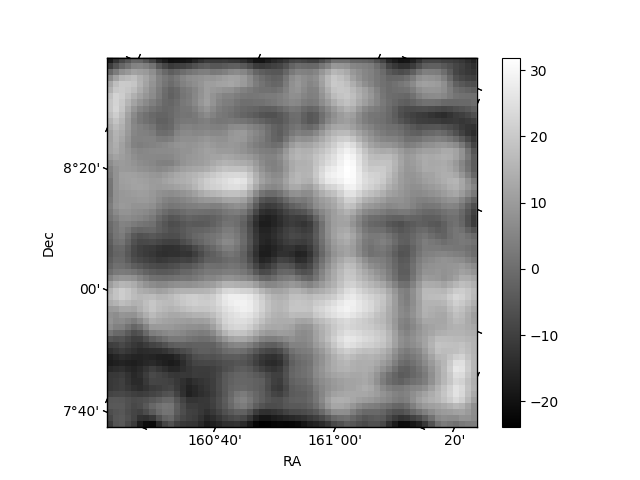
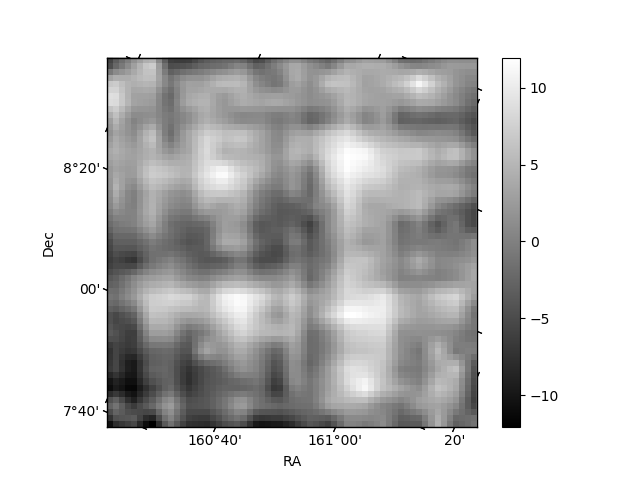
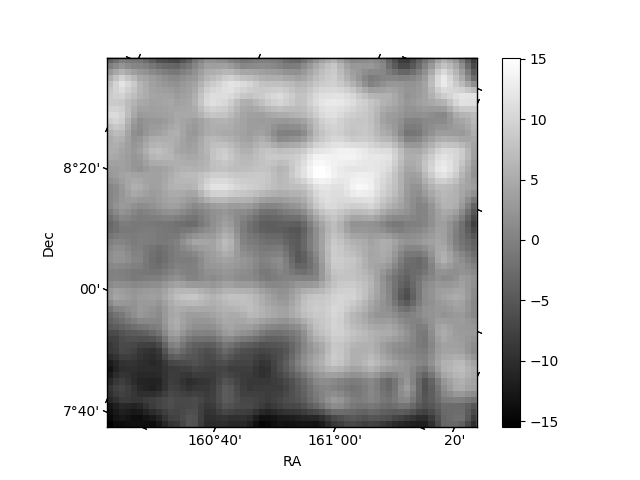
Histogram calculated using DETX and DETY for each event in the final _common_clean file
| Quadrant A | 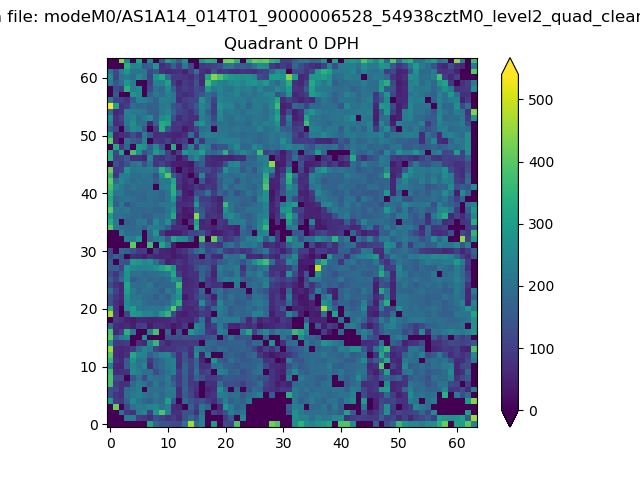 |
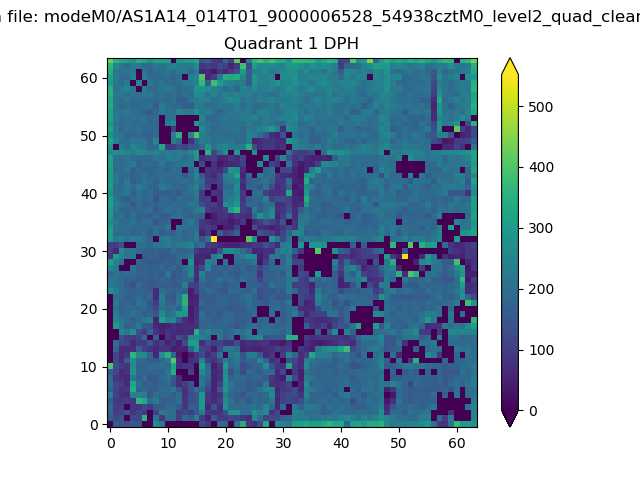 |
Quadrant B |
|---|---|---|---|
| Quadrant D | 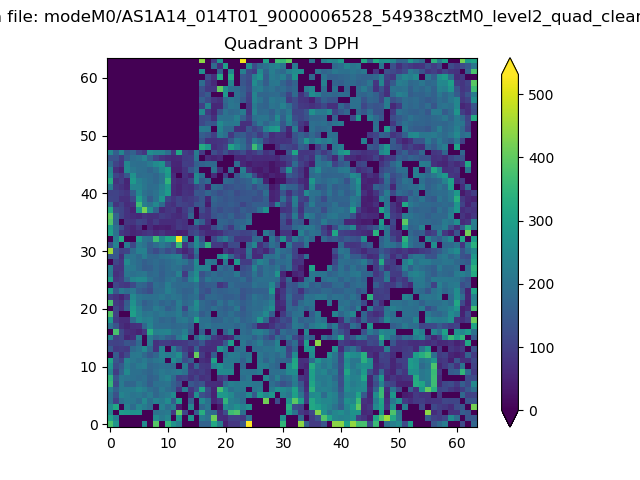 |
 |
Quadrant C |
| Plot type | Count rate plots | Images |
|---|---|---|
| Comparison with Poisson distribution Blue bars denote a histogram of data divided into 1 sec bins. Red curve is a Poisson curve with rate = median count rate of data. |
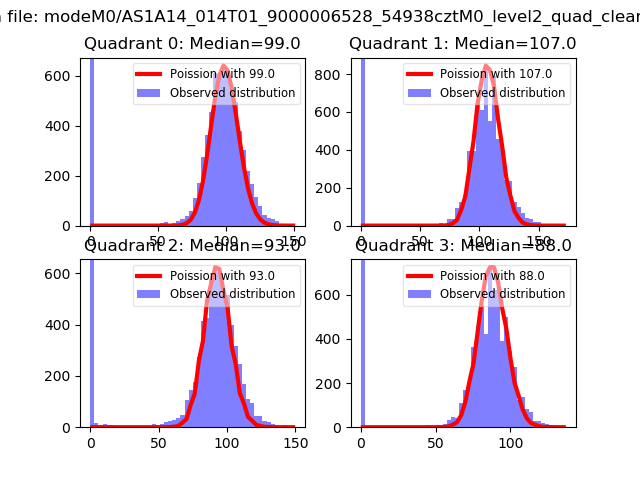 |
 |
| Quadrant-wise count rates Data is divided into 100 sec bins |
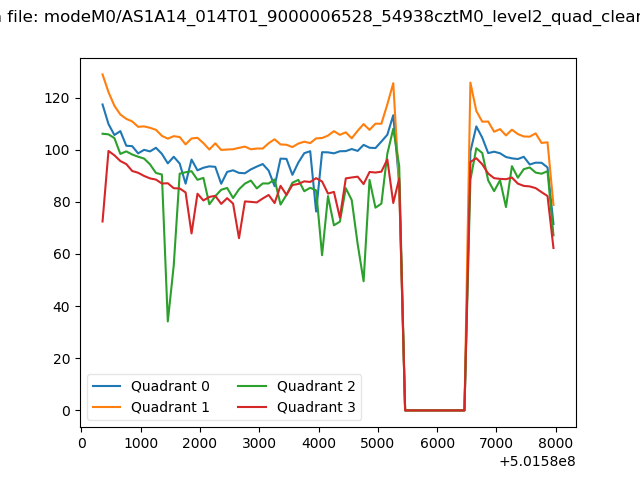 |
|
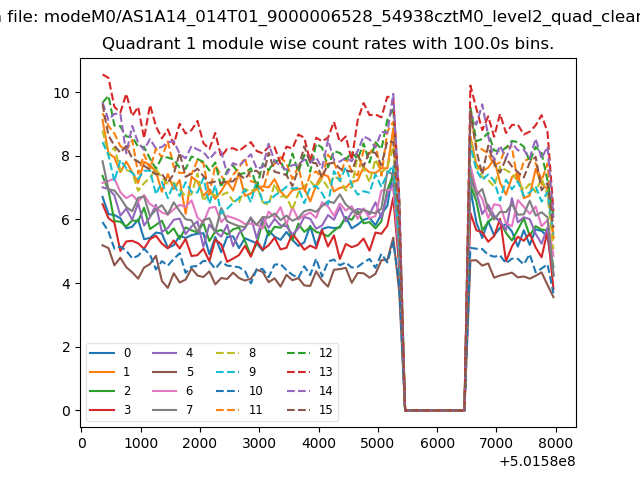
| Module-wise count rates for Quadrant A Data is divided into 100 sec bins |
 |
 |
| Module-wise count rates for Quadrant B Data is divided into 100 sec bins |
 |
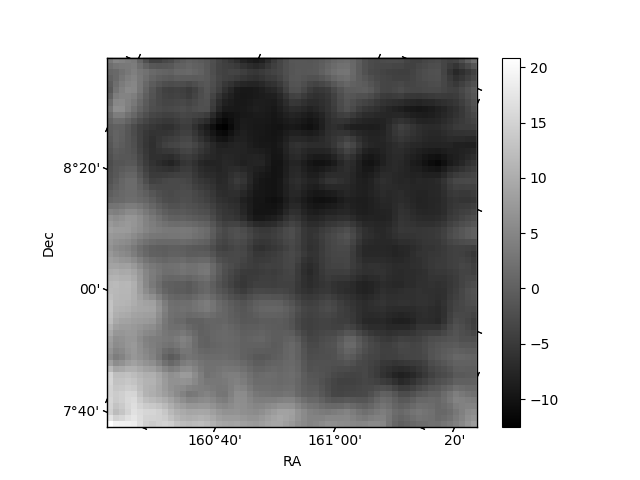 |
| Module-wise count rates for Quadrant C Data is divided into 100 sec bins |
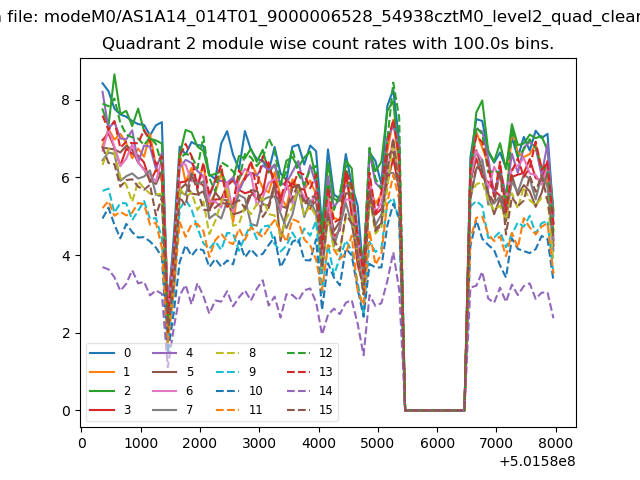 |
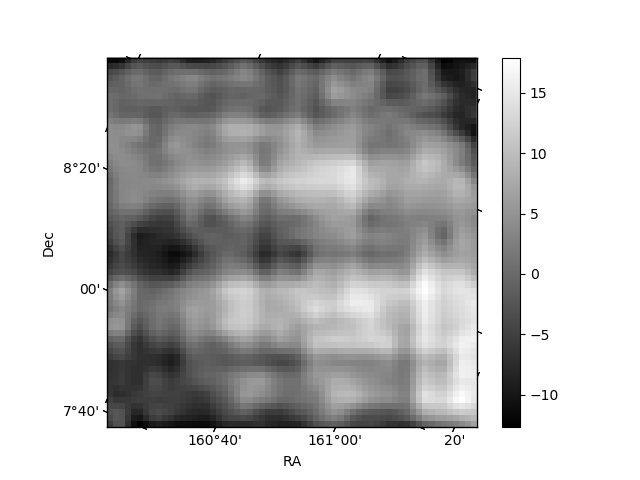 |
| Module-wise count rates for Quadrant D Data is divided into 100 sec bins |
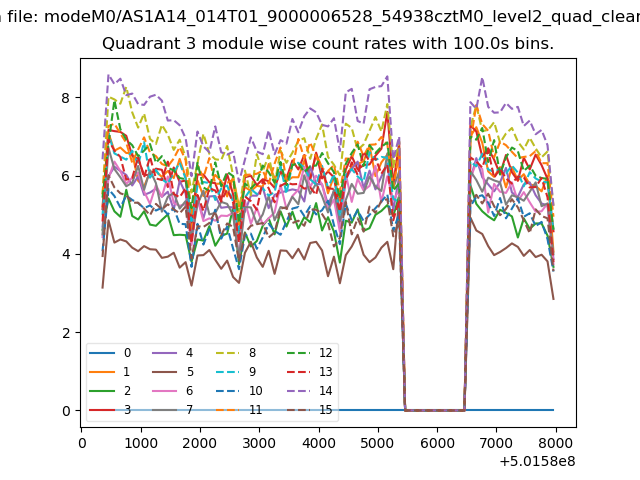 |
 |
| Parameter | Plot |
|---|---|
| CZT HV Monitor | 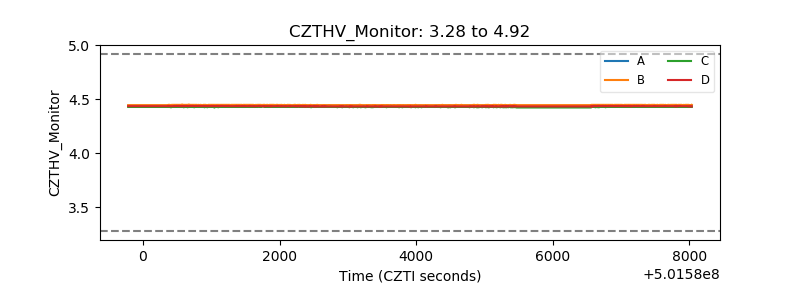 |
| D_VDD | 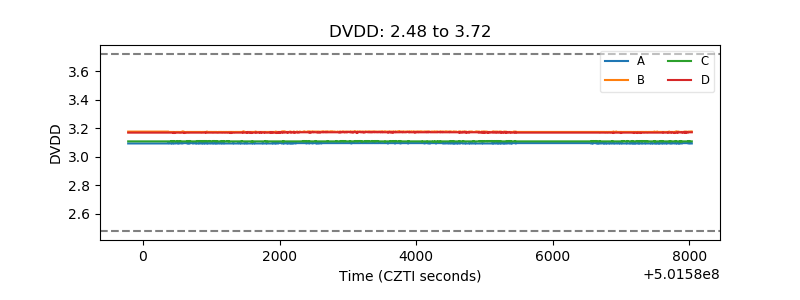 |
| Temperature 1 |  |
| Veto HV Monitor | 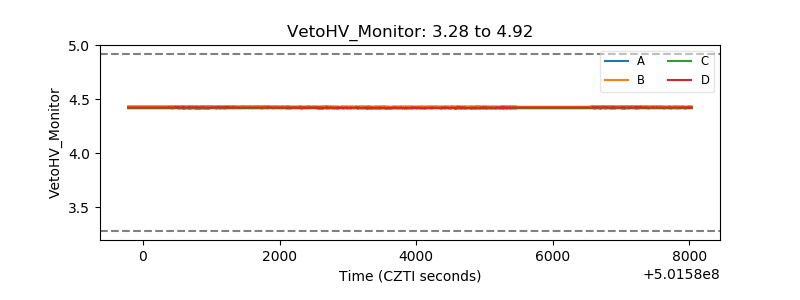 |
| Veto LLD | 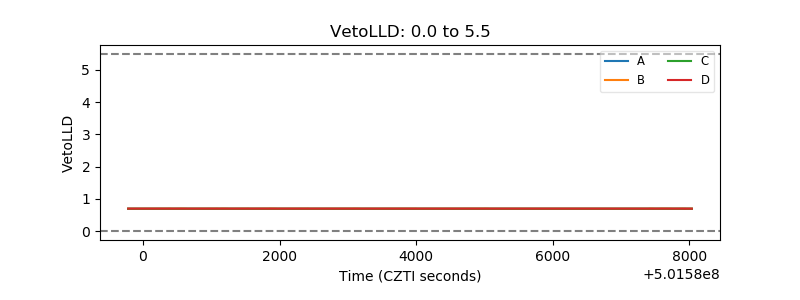 |
| Alpha Counter | 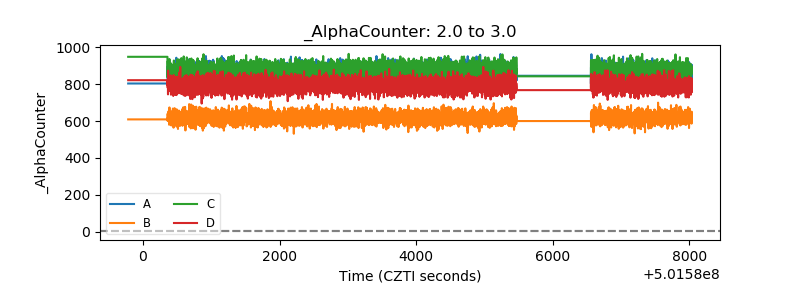 |
| _CPM_Rate | 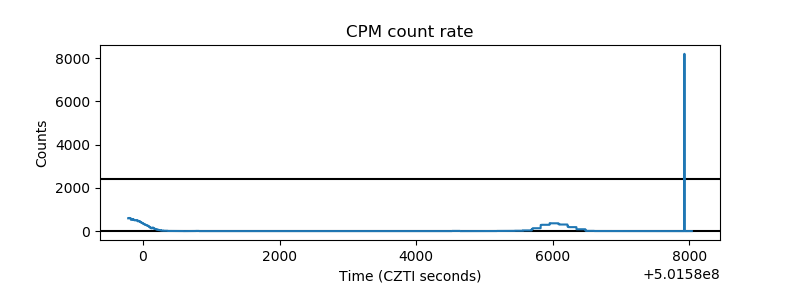 |
| CZT Counter |  |
| +2.5 Volts monitor | 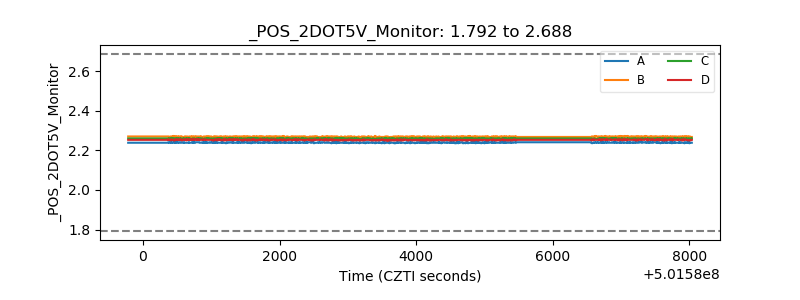 |
| +5 Volts monitor | 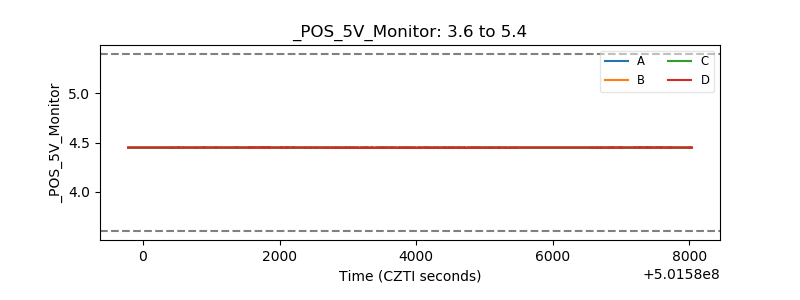 |
| _ROLL_ROT | 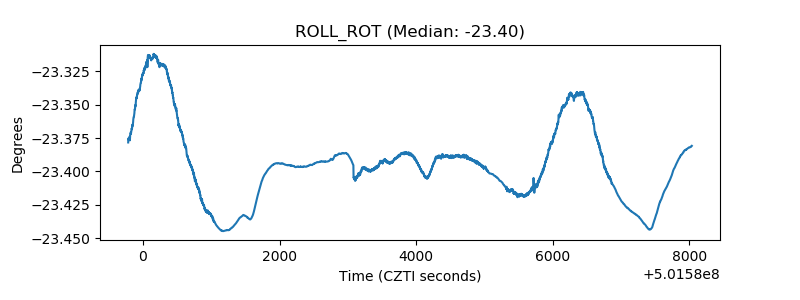 |
| _Roll_DEC | 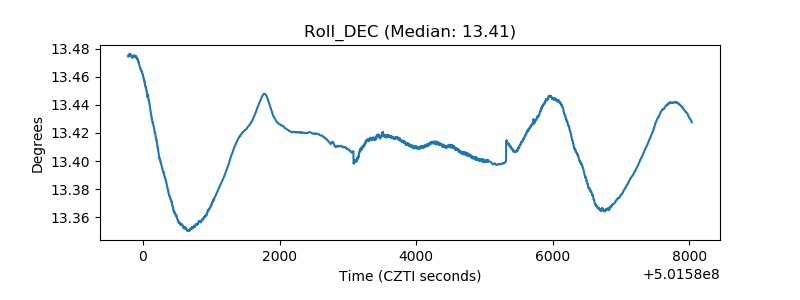 |
| _Roll_RA | 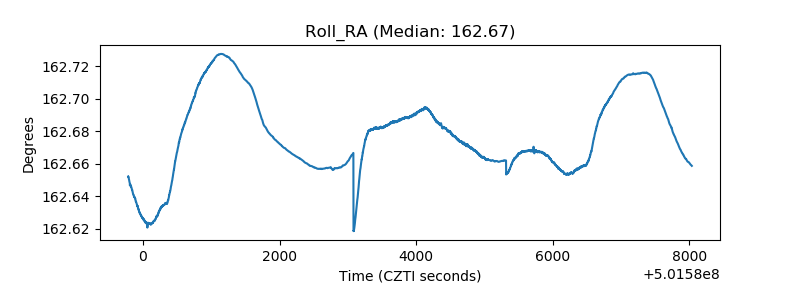 |
| Veto Counter | 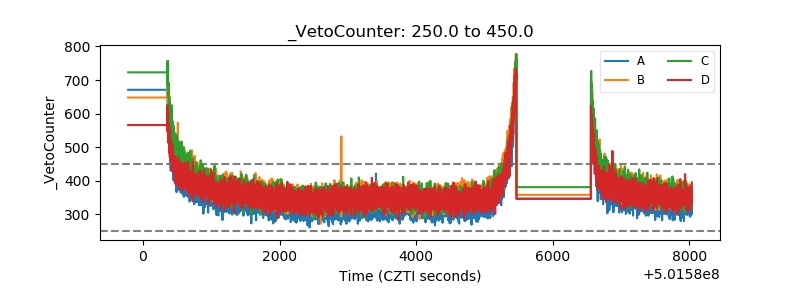 |