| Param | Original file | Final file |
|---|---|---|
| Filename | modeM0/AS1A14_014T01_9000006528_54940cztM0_level2.fits | modeM0/AS1A14_014T01_9000006528_54940cztM0_level2_quad_clean.evt |
| Size (bytes) | 567,930,240 | 98,326,080 |
| Size | 541.6 MB | 93.8 MB |
| Events in quadrant A | 4,950,385 | 622,598 |
| Events in quadrant B | 3,388,645 | 715,400 |
| Events in quadrant C | 5,768,280 | 581,811 |
| Events in quadrant D | 6,357,466 | 557,012 |
| Mode M0 | |||
|---|---|---|---|
| Quadrant | BADHDUFLAG | Total packets | Discarded packets |
| A | 0 | 19810 | 3 |
| B | 0 | 15172 | 2 |
| C | 0 | 22223 | 2 |
| D | 0 | 23847 | 16 |
| Mode SS | |||
|---|---|---|---|
| Quadrant | BADHDUFLAG | Total packets | Discarded packets |
| A | 0 | 146 | 0 |
| B | 0 | 146 | 0 |
| C | 0 | 146 | 0 |
| D | 0 | 146 | 0 |
| Mode M9 | |||
|---|---|---|---|
| Quadrant | BADHDUFLAG | Total packets | Discarded packets |
| A | 0 | 9 | 0 |
| B | 0 | 10 | 0 |
| C | 0 | 10 | 0 |
| D | 0 | 10 | 0 |
| Quadrant | Total seconds | Saturated seconds | Saturation percentage |
|---|---|---|---|
| A | 7186 | 720 | 10.019482% |
| B | 7186 | 224 | 3.117172% |
| C | 7186 | 863 | 12.009463% |
| D | 7183 | 726 | 10.107198% |
Noise dominated data is calculated using 1-second bins in cleaned event files. If a bin has >2000 counts, and if more than 50% of those come from <1% of pixels, then it is considered to be noise-dominated and hence unusable.
| Quadrant | # 1 sec bins | Bins with >0 counts | Bins with >2000 counts | High rate bins dominated by noise | Noise dominated (total time) | Noise dominated (detector-on time) | Marked lightcurve |
|---|---|---|---|---|---|---|---|
| A | 7787 | 7187 | 493 | 493 | 6.33% | 6.86% | 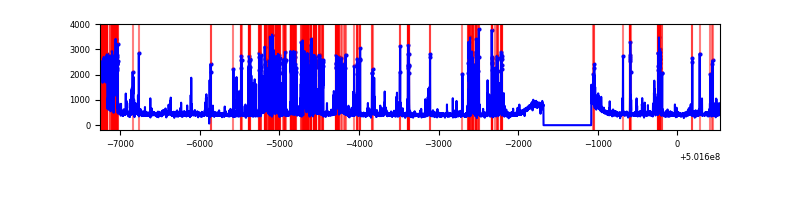 |
| B | 7786 | 7186 | 15 | 15 | 0.19% | 0.21% | 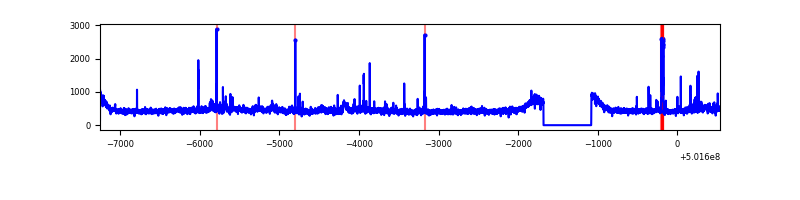 |
| C | 7786 | 7186 | 656 | 656 | 8.43% | 9.13% | 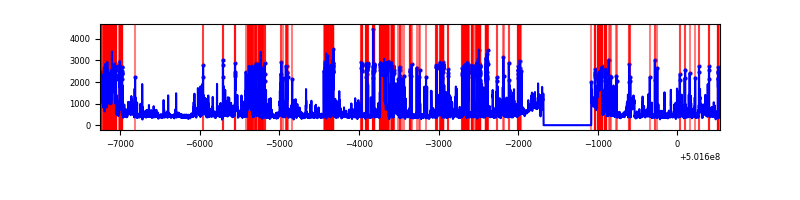 |
| D | 7786 | 7185 | 607 | 607 | 7.80% | 8.45% | 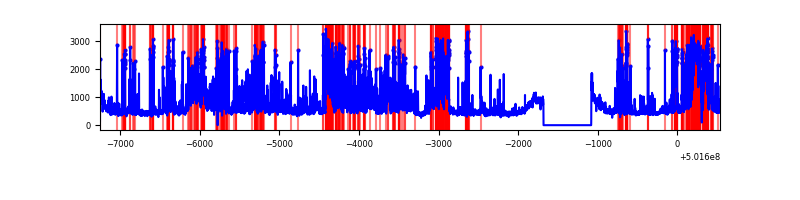 |
Top three noisy pixels from each quadrant. If the there are fewer than three noisy pixels in the level2.evt file, extra rows are filled as -1
| Pixel properties | Quadrant properties | ||||||
|---|---|---|---|---|---|---|---|
| Quadrant | DetID | PixID | Counts | Sigma | Mean | Median | Sigma |
| A | 3 | 45 | 1314154 | 6956.36 | 767 | 746 | 188.8 |
| A | 15 | 32 | 423095 | 2236.94 | 767 | 746 | 188.8 |
| A | 0 | 8 | 110925 | 583.55 | 767 | 746 | 188.8 |
| B | 7 | 0 | 166002 | 969.54 | 782 | 752 | 170.4 |
| B | 10 | 247 | 61710 | 357.65 | 782 | 752 | 170.4 |
| B | 12 | 111 | 20762 | 117.4 | 782 | 752 | 170.4 |
| C | 12 | 252 | 2045682 | 10063.29 | 738 | 731 | 203.2 |
| C | 4 | 5 | 381294 | 1872.77 | 738 | 731 | 203.2 |
| C | 14 | 254 | 149237 | 730.8 | 738 | 731 | 203.2 |
| D | 2 | 249 | 836990 | 3968.04 | 755 | 723 | 210.8 |
| D | 11 | 176 | 499974 | 2368.92 | 755 | 723 | 210.8 |
| D | 12 | 191 | 449953 | 2131.57 | 755 | 723 | 210.8 |
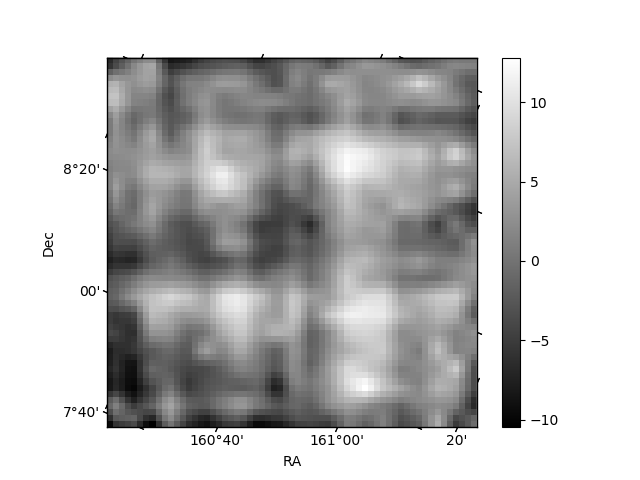
Histogram calculated using DETX and DETY for each event in the final _common_clean file
| Quadrant A |  |
 |
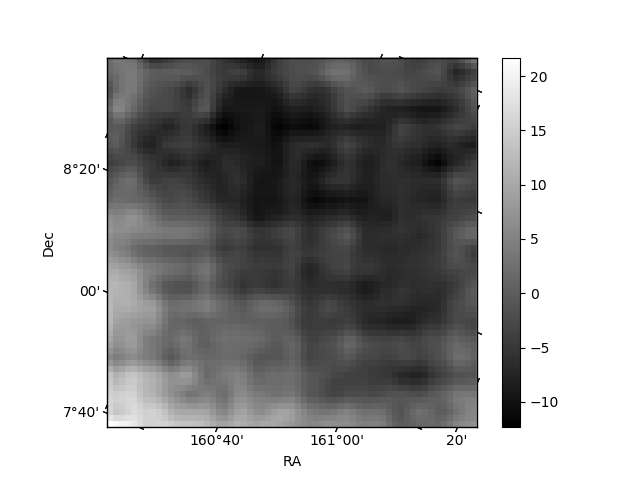
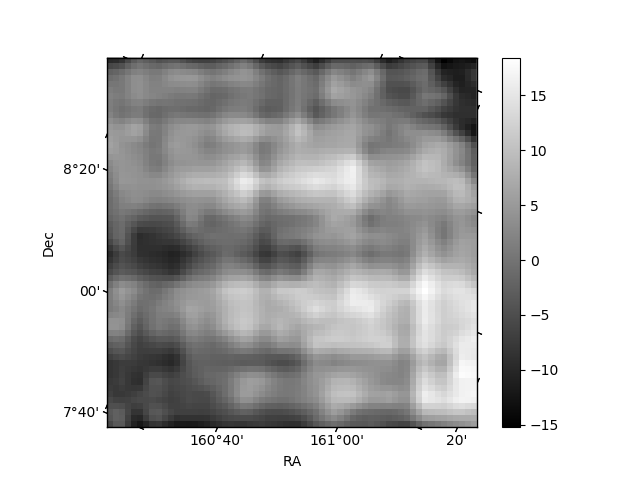
Quadrant B |
|---|---|---|---|
| Quadrant D |  |
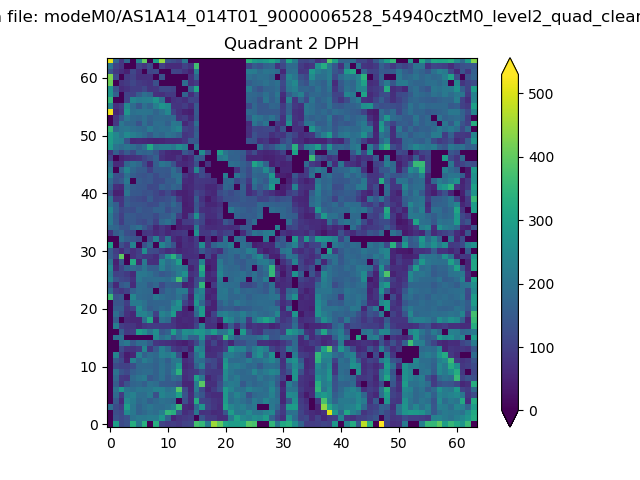 |
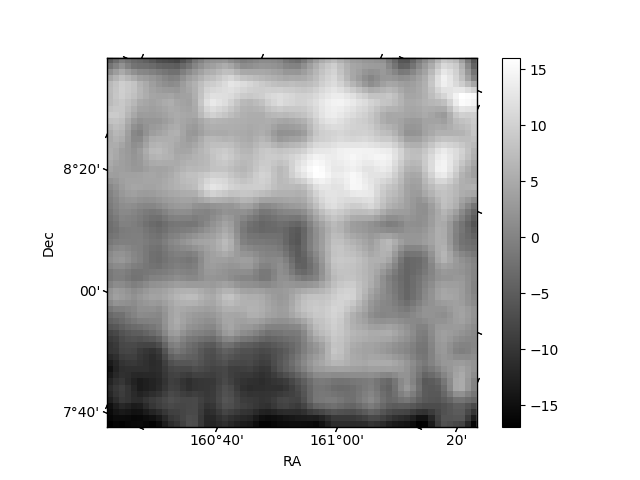
Quadrant C |
| Plot type | Count rate plots | Images |
|---|---|---|
| Comparison with Poisson distribution Blue bars denote a histogram of data divided into 1 sec bins. Red curve is a Poisson curve with rate = median count rate of data. |
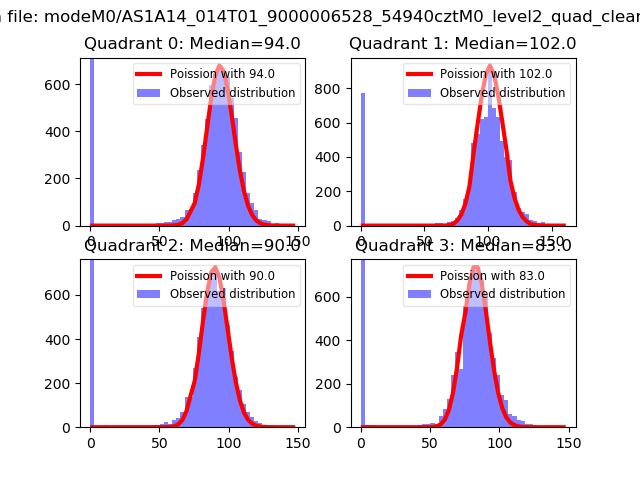 |
 |
| Quadrant-wise count rates Data is divided into 100 sec bins |
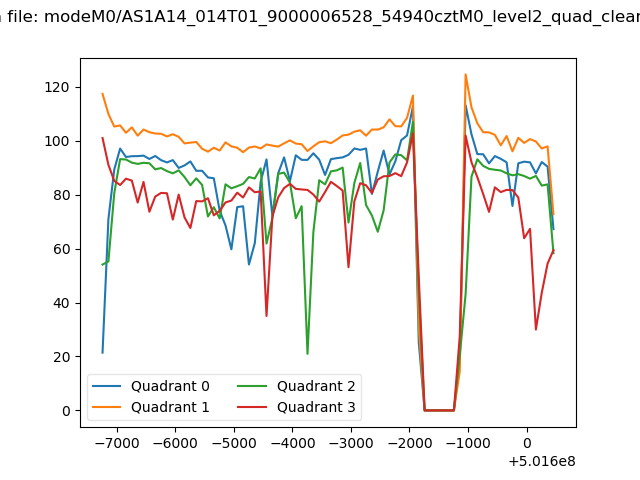 |
|
| Module-wise count rates for Quadrant A Data is divided into 100 sec bins |
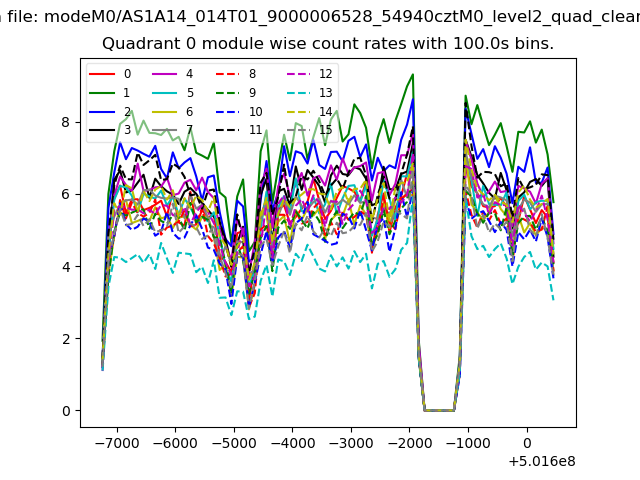 |
 |
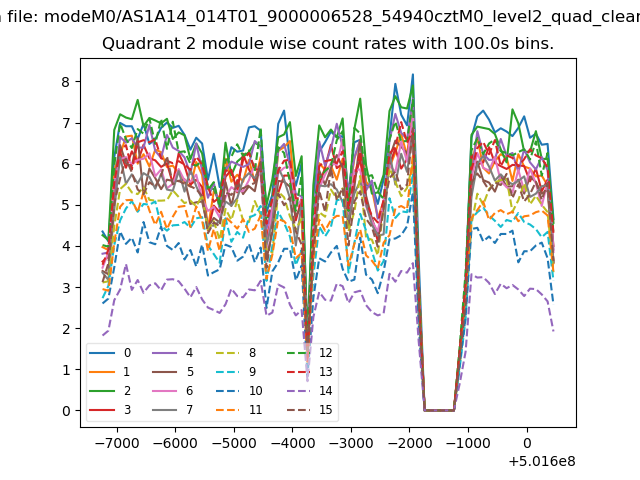
| Module-wise count rates for Quadrant B Data is divided into 100 sec bins |
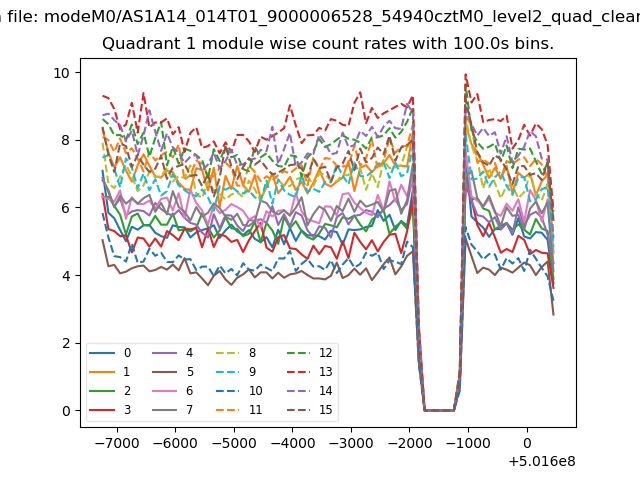 |
 |
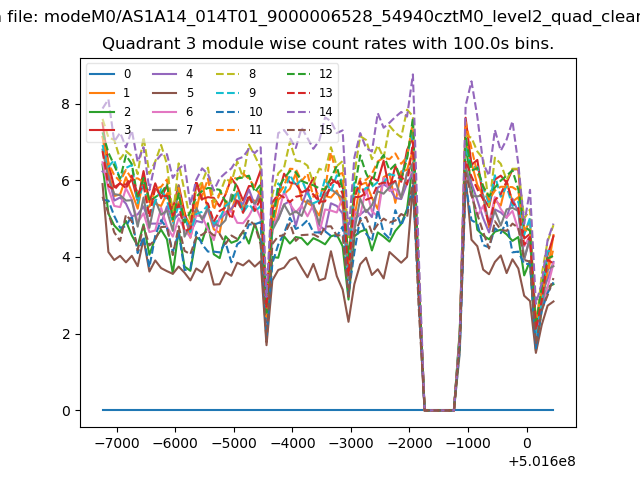
| Module-wise count rates for Quadrant C Data is divided into 100 sec bins |
 |
 |
| Module-wise count rates for Quadrant D Data is divided into 100 sec bins |
 |
 |
| Parameter | Plot |
|---|---|
| CZT HV Monitor | 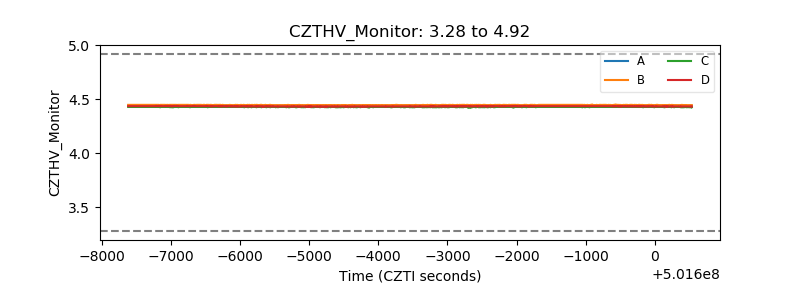 |
| D_VDD | 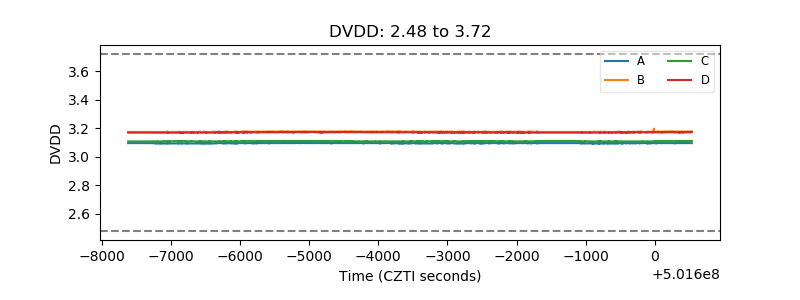 |
| Temperature 1 | 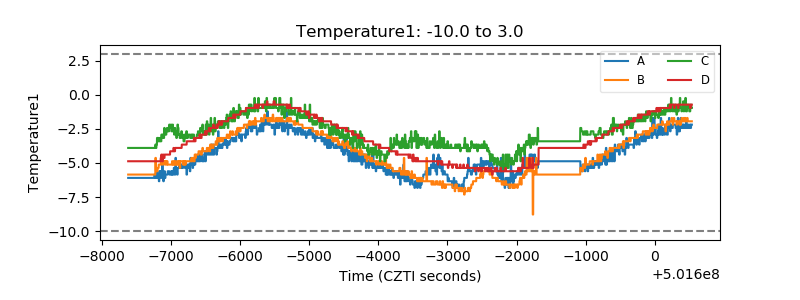 |
| Veto HV Monitor | 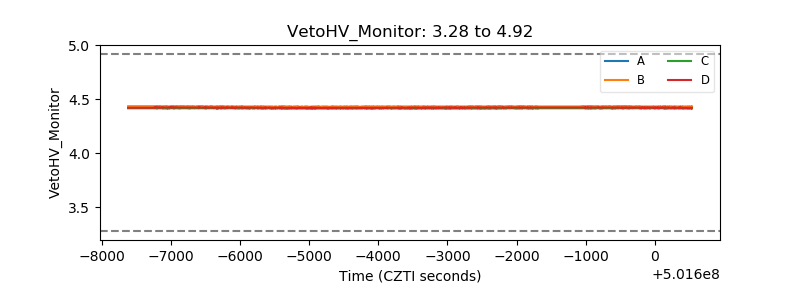 |
| Veto LLD | 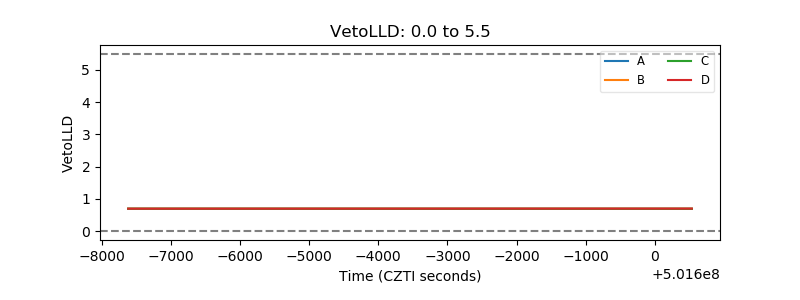 |
| Alpha Counter | 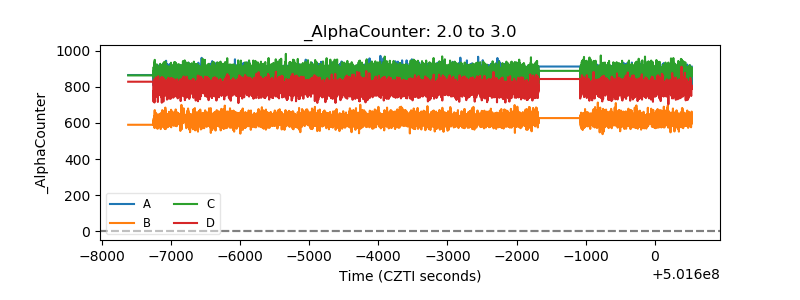 |
| _CPM_Rate | 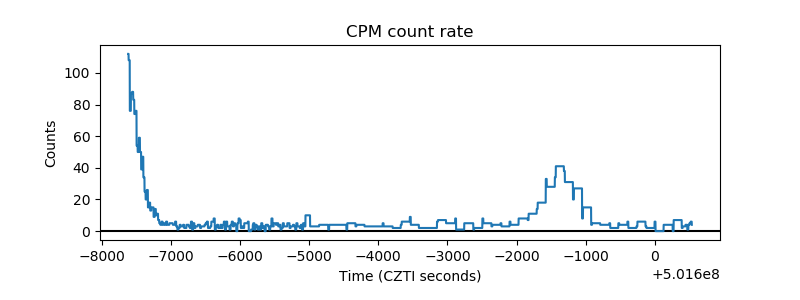 |
| CZT Counter | 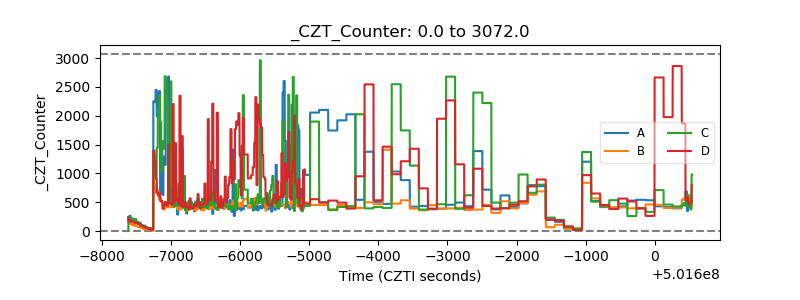 |
| +2.5 Volts monitor |  |
| +5 Volts monitor |  |
| _ROLL_ROT | 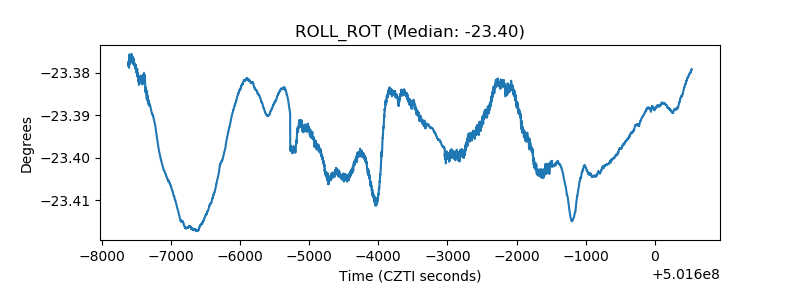 |
| _Roll_DEC | 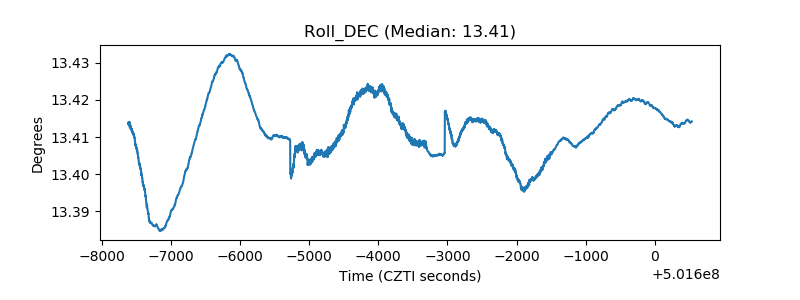 |
| _Roll_RA | 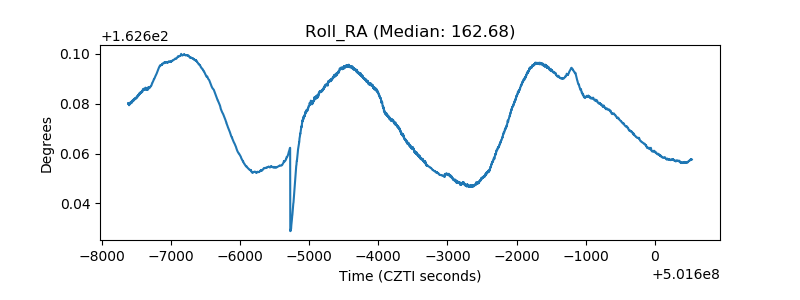 |
| Veto Counter | 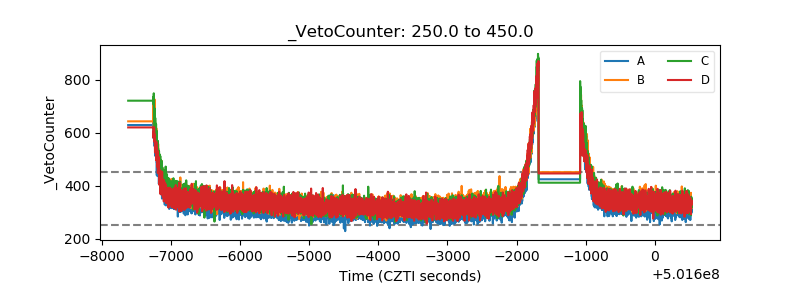 |