| Param | Original file | Final file |
|---|---|---|
| Filename | modeM0/AS1A14_014T01_9000006528_54942cztM0_level2.fits | modeM0/AS1A14_014T01_9000006528_54942cztM0_level2_quad_clean.evt |
| Size (bytes) | 516,458,880 | 110,615,040 |
| Size | 492.5 MB | 105.5 MB |
| Events in quadrant A | 3,797,336 | 726,381 |
| Events in quadrant B | 3,575,187 | 787,577 |
| Events in quadrant C | 4,327,821 | 681,283 |
| Events in quadrant D | 6,810,086 | 610,608 |
| Mode M0 | |||
|---|---|---|---|
| Quadrant | BADHDUFLAG | Total packets | Discarded packets |
| A | 0 | 17148 | 2 |
| B | 0 | 16482 | 0 |
| C | 0 | 18562 | 0 |
| D | 0 | 25777 | 2 |
| Mode SS | |||
|---|---|---|---|
| Quadrant | BADHDUFLAG | Total packets | Discarded packets |
| A | 0 | 156 | 0 |
| B | 0 | 156 | 0 |
| C | 0 | 156 | 0 |
| D | 0 | 156 | 0 |
| Quadrant | Total seconds | Saturated seconds | Saturation percentage |
|---|---|---|---|
| A | 7813 | 118 | 1.510303% |
| B | 7815 | 27 | 0.345489% |
| C | 7815 | 210 | 2.687140% |
| D | 7814 | 668 | 8.548759% |
Noise dominated data is calculated using 1-second bins in cleaned event files. If a bin has >2000 counts, and if more than 50% of those come from <1% of pixels, then it is considered to be noise-dominated and hence unusable.
| Quadrant | # 1 sec bins | Bins with >0 counts | Bins with >2000 counts | High rate bins dominated by noise | Noise dominated (total time) | Noise dominated (detector-on time) | Marked lightcurve |
|---|---|---|---|---|---|---|---|
| A | 7814 | 7814 | 104 | 104 | 1.33% | 1.33% | 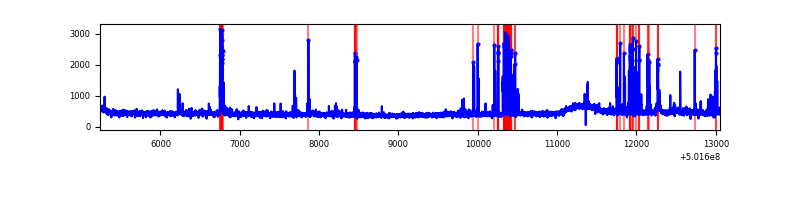 |
| B | 7815 | 7815 | 12 | 12 | 0.15% | 0.15% | 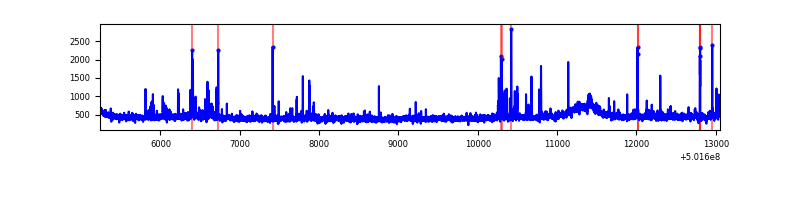 |
| C | 7815 | 7815 | 156 | 156 | 2.00% | 2.00% | 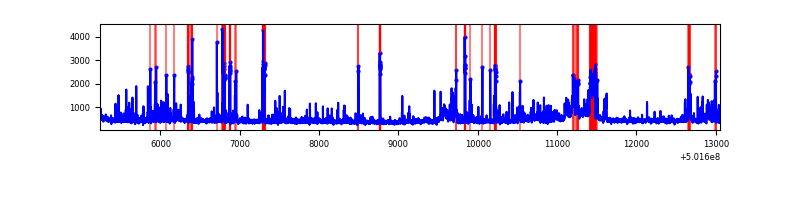 |
| D | 7815 | 7815 | 723 | 723 | 9.25% | 9.25% | 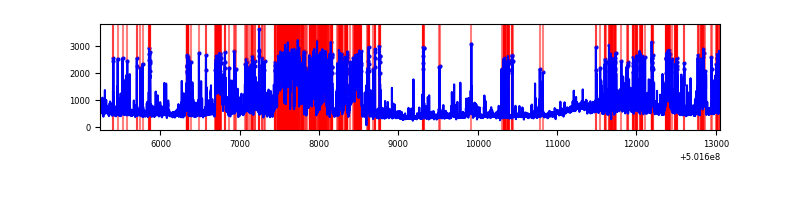 |
Top three noisy pixels from each quadrant. If the there are fewer than three noisy pixels in the level2.evt file, extra rows are filled as -1
| Pixel properties | Quadrant properties | ||||||
|---|---|---|---|---|---|---|---|
| Quadrant | DetID | PixID | Counts | Sigma | Mean | Median | Sigma |
| A | 0 | 8 | 328514 | 1577.64 | 844 | 823 | 207.7 |
| A | 3 | 45 | 104583 | 499.54 | 844 | 823 | 207.7 |
| A | 4 | 3 | 32696 | 153.45 | 844 | 823 | 207.7 |
| B | 7 | 0 | 75658 | 415.67 | 835 | 804 | 180.1 |
| B | 5 | 185 | 62108 | 340.43 | 835 | 804 | 180.1 |
| B | 0 | 182 | 49584 | 270.88 | 835 | 804 | 180.1 |
| C | 3 | 248 | 396094 | 1767.36 | 815 | 807 | 223.7 |
| C | 12 | 252 | 311799 | 1390.47 | 815 | 807 | 223.7 |
| C | 14 | 254 | 154530 | 687.31 | 815 | 807 | 223.7 |
| D | 11 | 129 | 1275929 | 5610.36 | 802 | 766 | 227.3 |
| D | 2 | 249 | 716071 | 3147.14 | 802 | 766 | 227.3 |
| D | 15 | 46 | 267094 | 1171.77 | 802 | 766 | 227.3 |
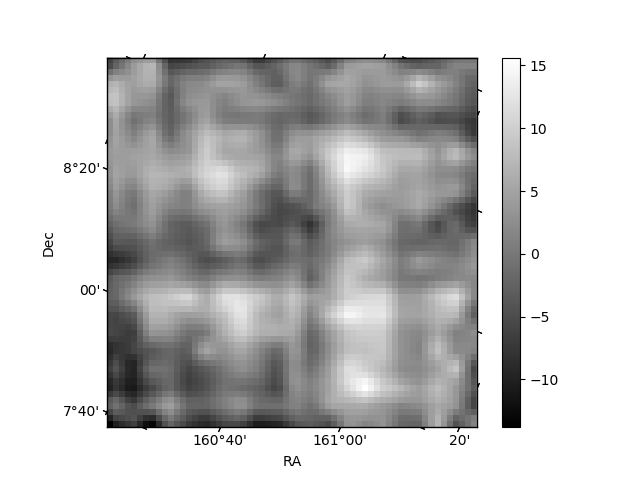
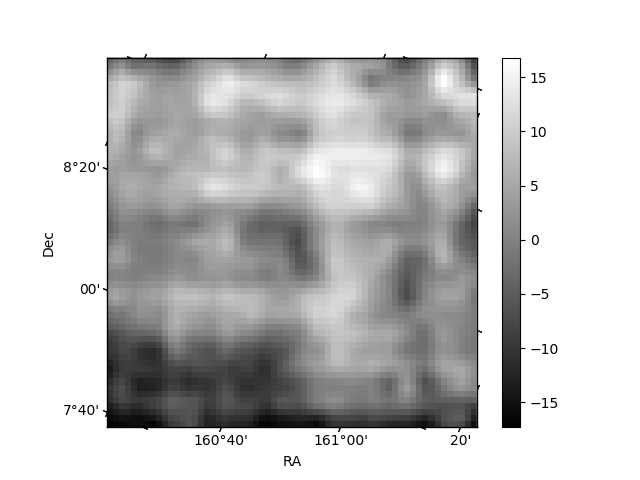
Histogram calculated using DETX and DETY for each event in the final _common_clean file
| Quadrant A | 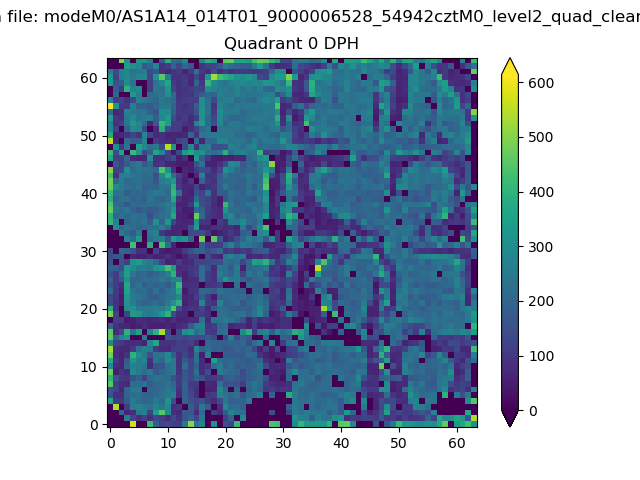 |
 |
Quadrant B |
|---|---|---|---|
| Quadrant D | 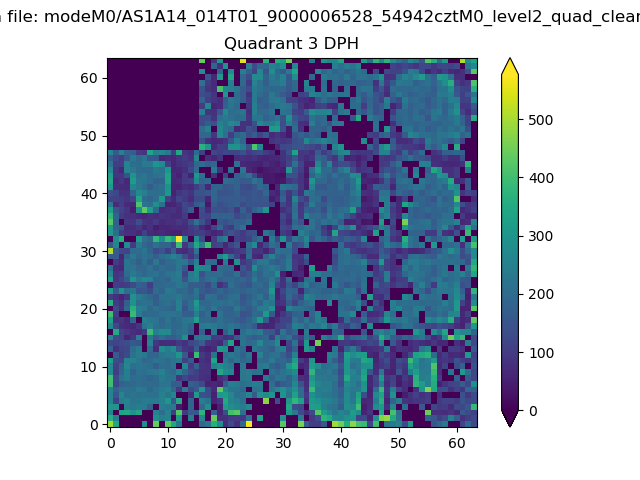 |
 |
Quadrant C |
| Plot type | Count rate plots | Images |
|---|---|---|
| Comparison with Poisson distribution Blue bars denote a histogram of data divided into 1 sec bins. Red curve is a Poisson curve with rate = median count rate of data. |
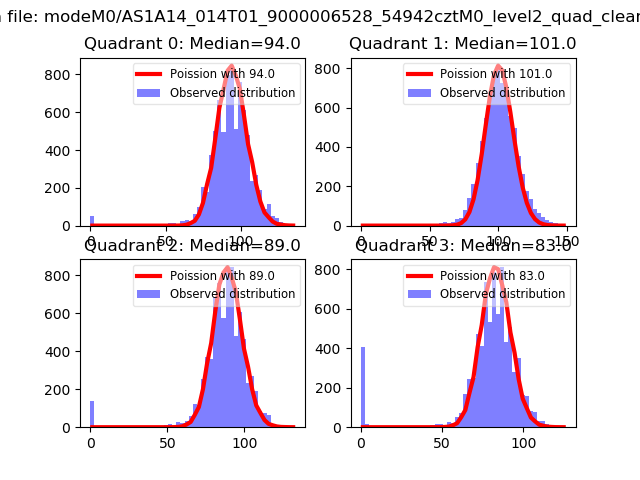 |
 |
| Quadrant-wise count rates Data is divided into 100 sec bins |
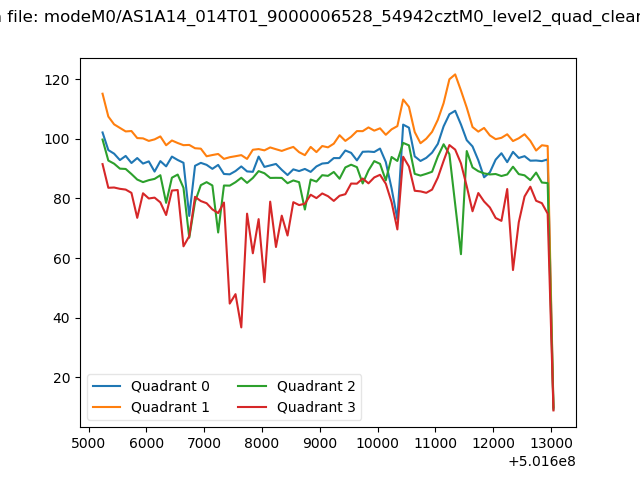 |
|
| Module-wise count rates for Quadrant A Data is divided into 100 sec bins |
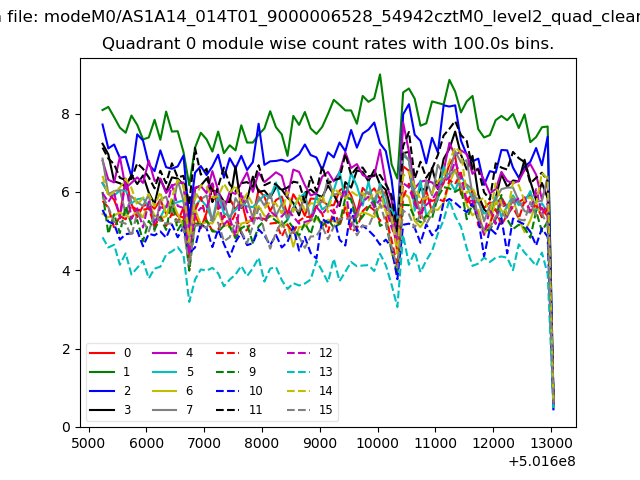 |
 |
| Module-wise count rates for Quadrant B Data is divided into 100 sec bins |
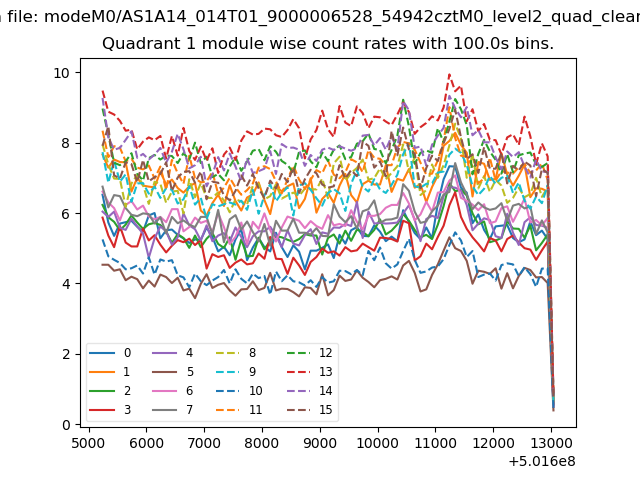 |
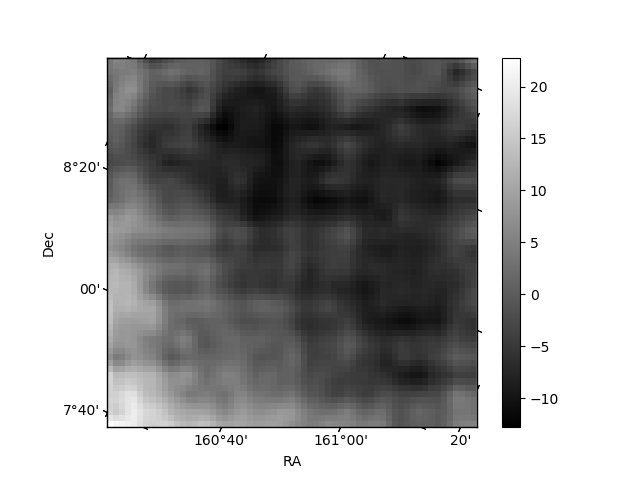 |
| Module-wise count rates for Quadrant C Data is divided into 100 sec bins |
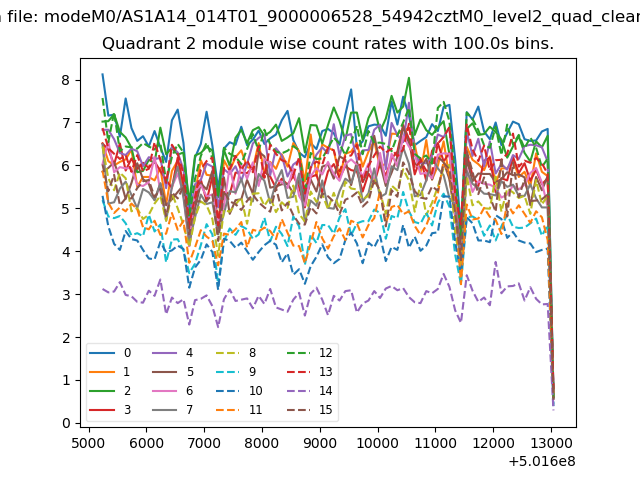 |
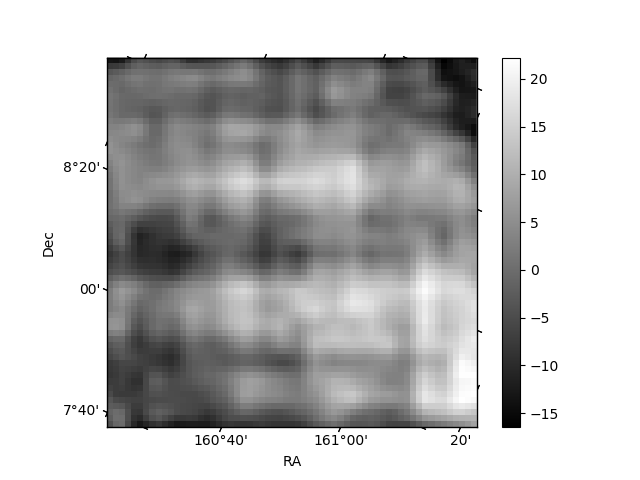 |
| Module-wise count rates for Quadrant D Data is divided into 100 sec bins |
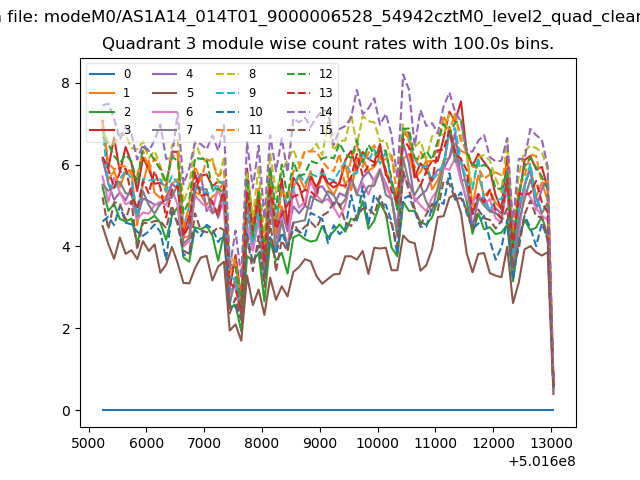 |
 |
| Parameter | Plot |
|---|---|
| CZT HV Monitor | 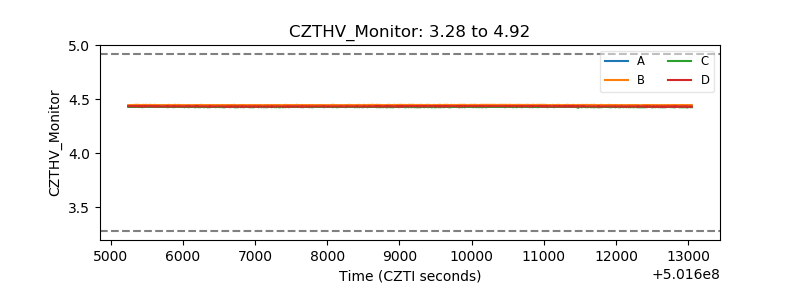 |
| D_VDD | 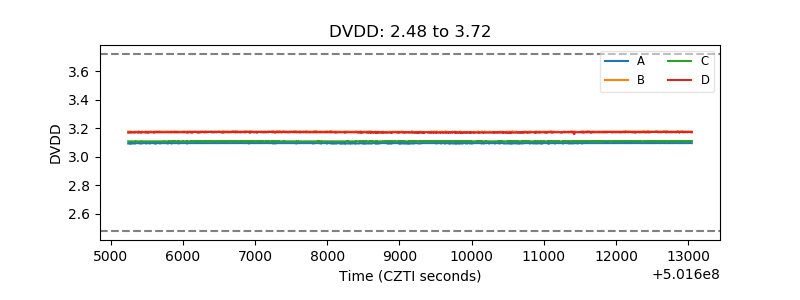 |
| Temperature 1 | 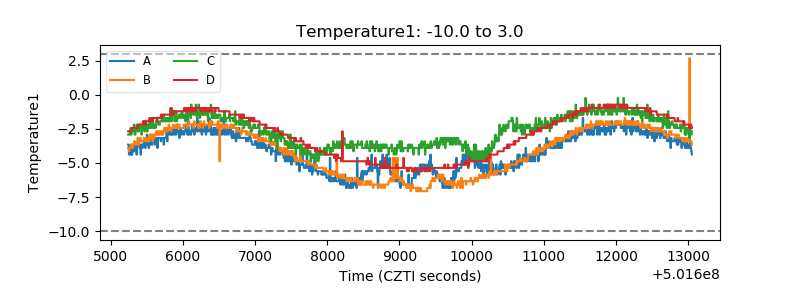 |
| Veto HV Monitor | 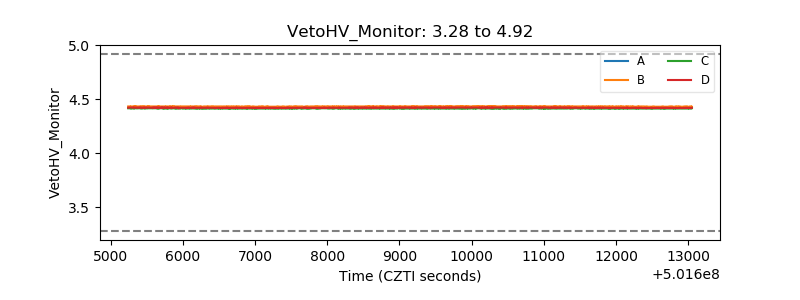 |
| Veto LLD | 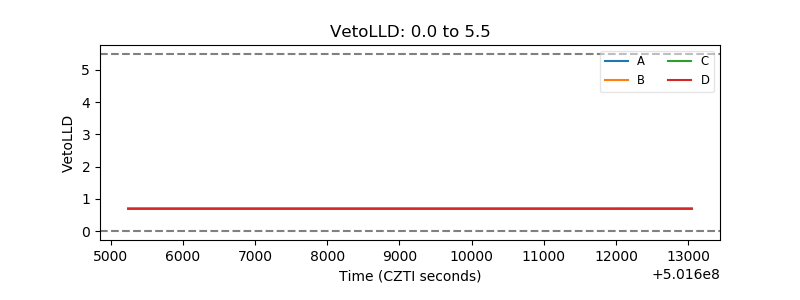 |
| Alpha Counter | 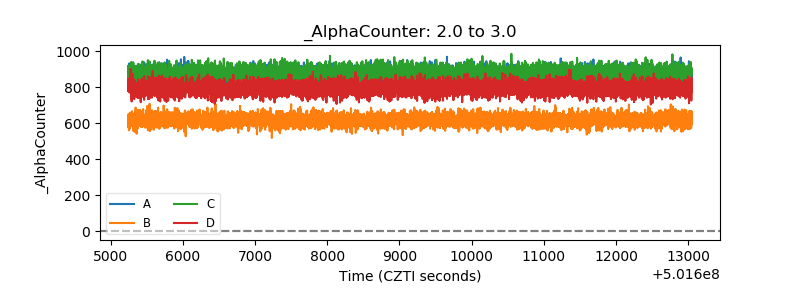 |
| _CPM_Rate | 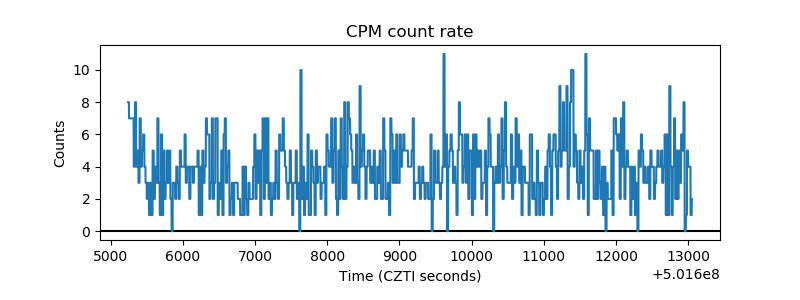 |
| CZT Counter | 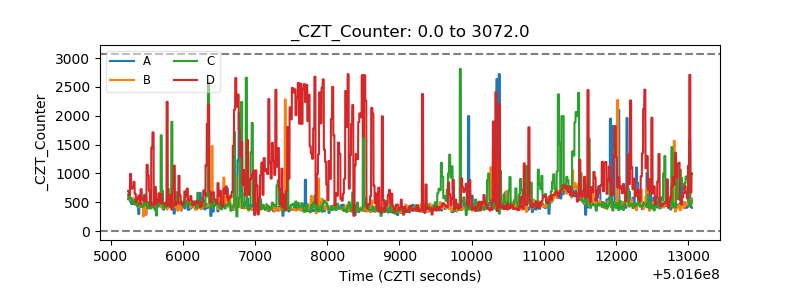 |
| +2.5 Volts monitor |  |
| +5 Volts monitor |  |
| _ROLL_ROT | 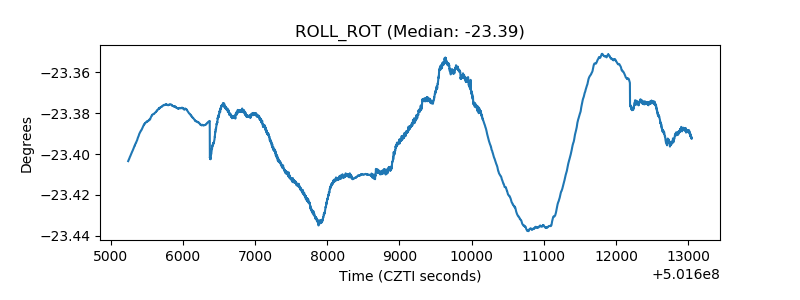 |
| _Roll_DEC | 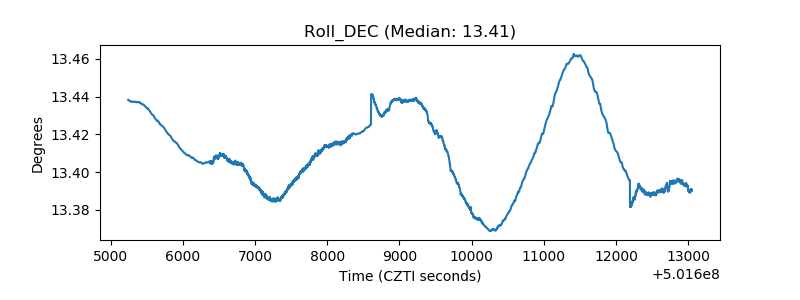 |
| _Roll_RA | 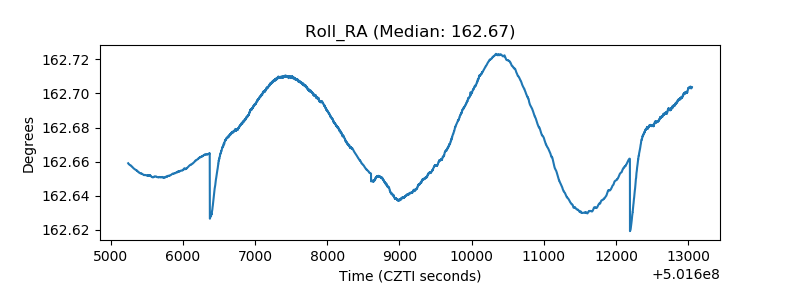 |
| Veto Counter | 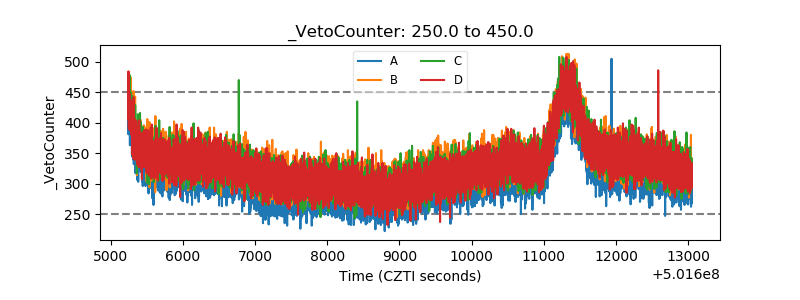 |