| Param | Original file | Final file |
|---|---|---|
| Filename | modeM0/AS1A14_014T01_9000006528_54943cztM0_level2.fits | modeM0/AS1A14_014T01_9000006528_54943cztM0_level2_quad_clean.evt |
| Size (bytes) | 567,858,240 | 113,664,960 |
| Size | 541.6 MB | 108.4 MB |
| Events in quadrant A | 4,026,349 | 755,754 |
| Events in quadrant B | 3,773,834 | 814,619 |
| Events in quadrant C | 4,944,762 | 702,950 |
| Events in quadrant D | 7,648,393 | 606,792 |
| Mode M0 | |||
|---|---|---|---|
| Quadrant | BADHDUFLAG | Total packets | Discarded packets |
| A | 0 | 17971 | 0 |
| B | 0 | 17236 | 0 |
| C | 0 | 20559 | 0 |
| D | 0 | 28369 | 0 |
| Mode SS | |||
|---|---|---|---|
| Quadrant | BADHDUFLAG | Total packets | Discarded packets |
| A | 0 | 162 | 0 |
| B | 0 | 162 | 0 |
| C | 0 | 162 | 0 |
| D | 0 | 162 | 0 |
| Quadrant | Total seconds | Saturated seconds | Saturation percentage |
|---|---|---|---|
| A | 8075 | 98 | 1.213622% |
| B | 8076 | 42 | 0.520059% |
| C | 8075 | 298 | 3.690402% |
| D | 8075 | 945 | 11.702786% |
Noise dominated data is calculated using 1-second bins in cleaned event files. If a bin has >2000 counts, and if more than 50% of those come from <1% of pixels, then it is considered to be noise-dominated and hence unusable.
| Quadrant | # 1 sec bins | Bins with >0 counts | Bins with >2000 counts | High rate bins dominated by noise | Noise dominated (total time) | Noise dominated (detector-on time) | Marked lightcurve |
|---|---|---|---|---|---|---|---|
| A | 8075 | 8075 | 80 | 80 | 0.99% | 0.99% | 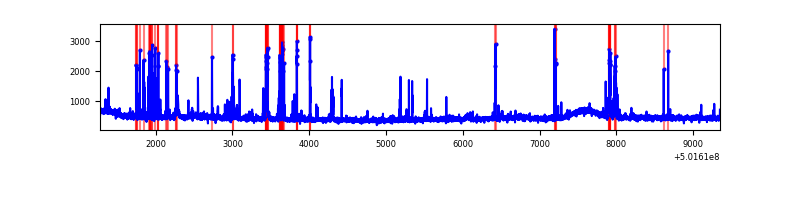 |
| B | 8076 | 8076 | 16 | 16 | 0.20% | 0.20% |  |
| C | 8075 | 8075 | 265 | 265 | 3.28% | 3.28% | 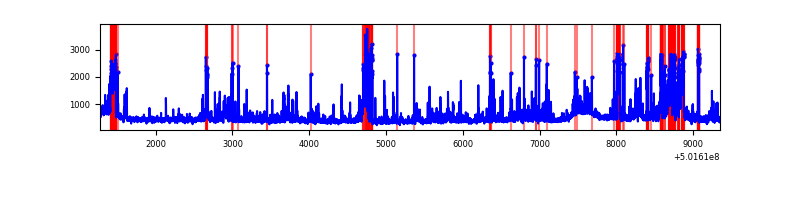 |
| D | 8075 | 8075 | 897 | 897 | 11.11% | 11.11% | 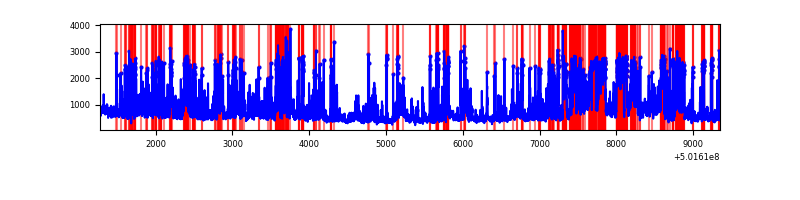 |
Top three noisy pixels from each quadrant. If the there are fewer than three noisy pixels in the level2.evt file, extra rows are filled as -1
| Pixel properties | Quadrant properties | ||||||
|---|---|---|---|---|---|---|---|
| Quadrant | DetID | PixID | Counts | Sigma | Mean | Median | Sigma |
| A | 0 | 8 | 271602 | 1221.71 | 888 | 865 | 221.6 |
| A | 3 | 45 | 190900 | 857.54 | 888 | 865 | 221.6 |
| A | 5 | 241 | 50548 | 224.2 | 888 | 865 | 221.6 |
| B | 7 | 0 | 83156 | 436.4 | 876 | 845 | 188.6 |
| B | 5 | 185 | 51498 | 268.55 | 876 | 845 | 188.6 |
| B | 10 | 247 | 46780 | 243.54 | 876 | 845 | 188.6 |
| C | 12 | 252 | 406450 | 1754.3 | 851 | 843 | 231.2 |
| C | 4 | 5 | 353366 | 1524.71 | 851 | 843 | 231.2 |
| C | 6 | 223 | 199654 | 859.88 | 851 | 843 | 231.2 |
| D | 3 | 12 | 1598665 | 6880.71 | 812 | 776 | 232.2 |
| D | 11 | 129 | 787909 | 3389.49 | 812 | 776 | 232.2 |
| D | 2 | 249 | 425768 | 1830.07 | 812 | 776 | 232.2 |
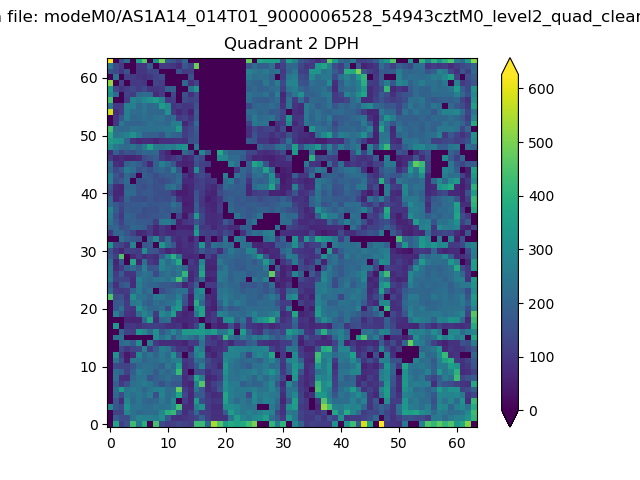
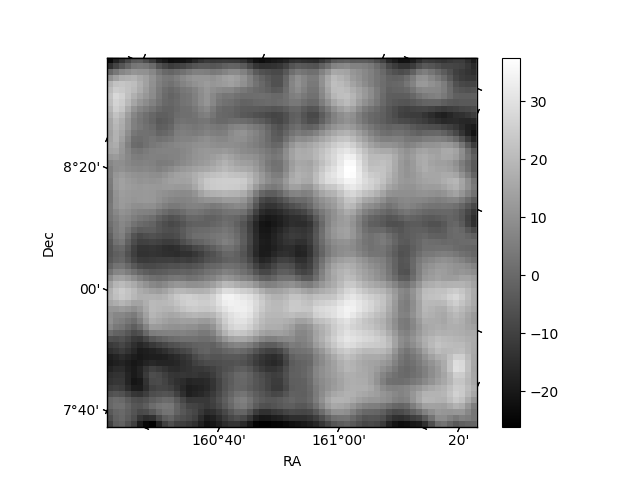
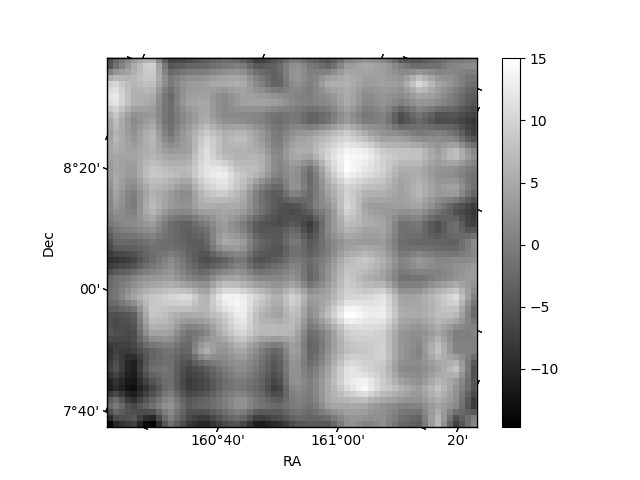
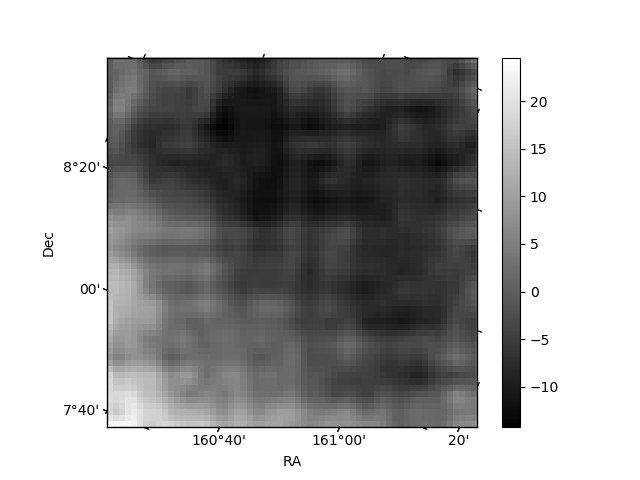
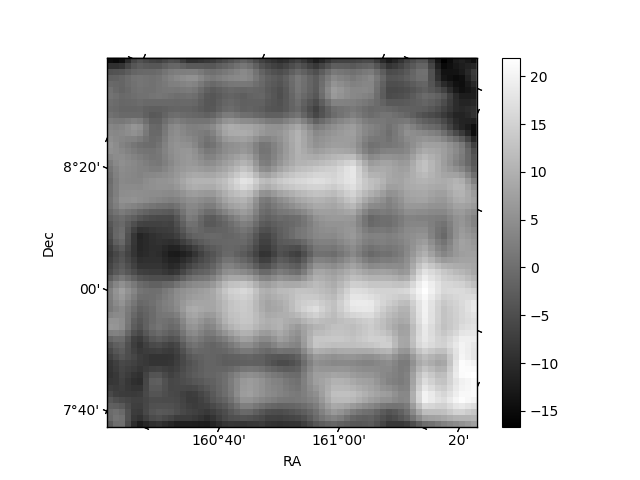
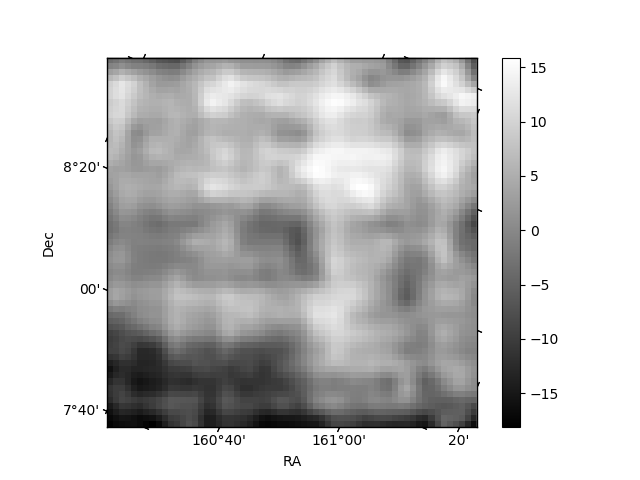
Histogram calculated using DETX and DETY for each event in the final _common_clean file
| Quadrant A | 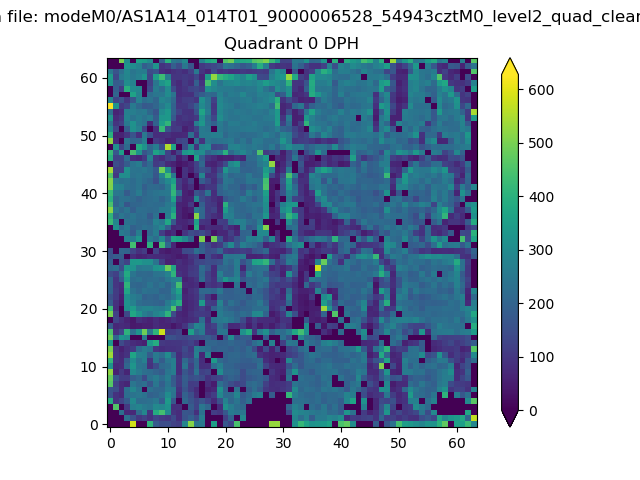 |
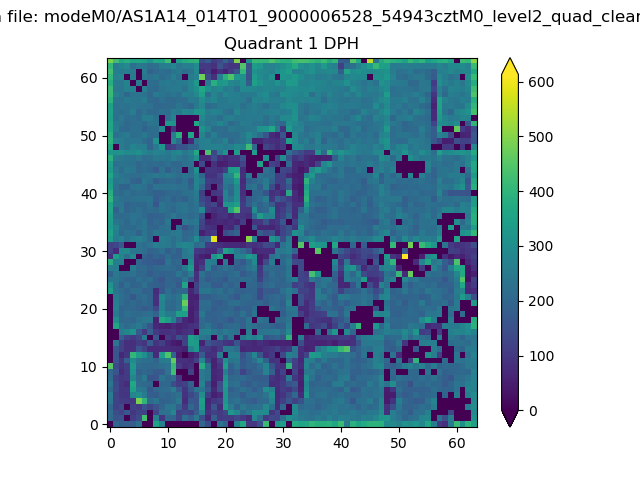 |
Quadrant B |
|---|---|---|---|
| Quadrant D | 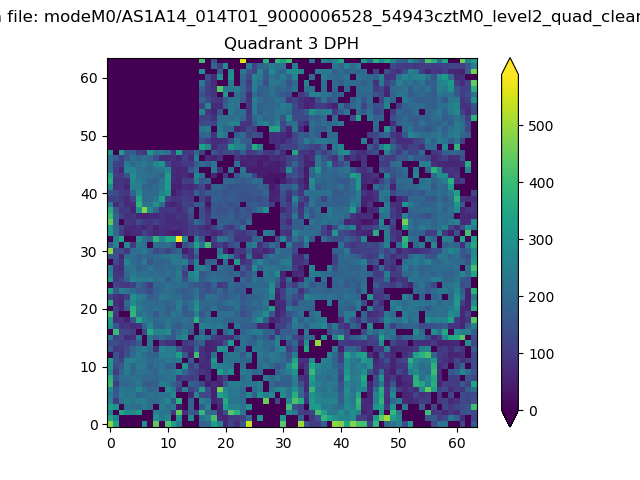 |
 |
Quadrant C |
| Plot type | Count rate plots | Images |
|---|---|---|
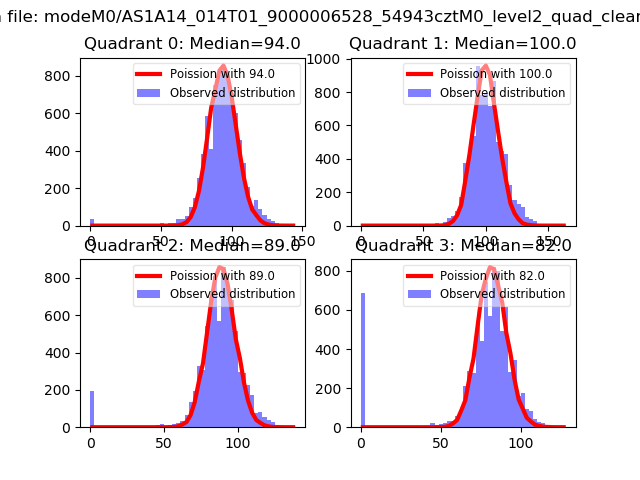
| Comparison with Poisson distribution Blue bars denote a histogram of data divided into 1 sec bins. Red curve is a Poisson curve with rate = median count rate of data. |
 |
 |
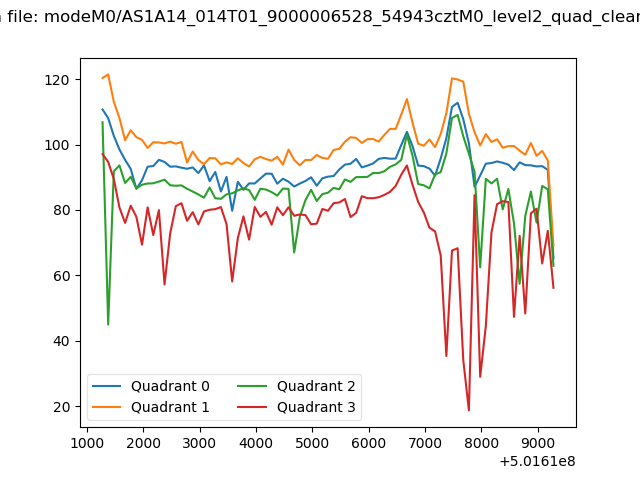
| Quadrant-wise count rates Data is divided into 100 sec bins |
 |
|
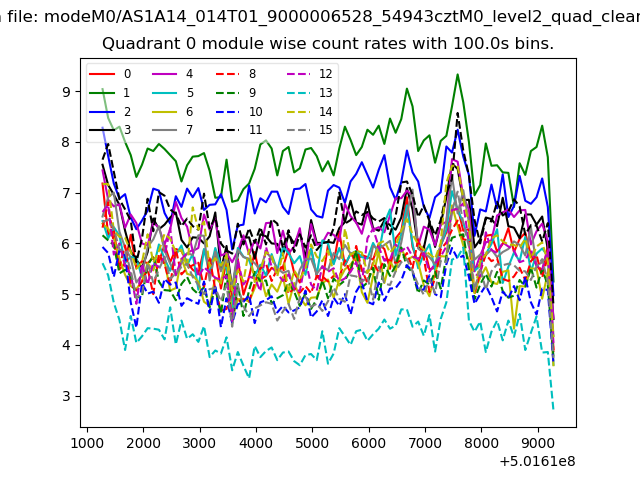
| Module-wise count rates for Quadrant A Data is divided into 100 sec bins |
 |
 |
| Module-wise count rates for Quadrant B Data is divided into 100 sec bins |
 |
 |
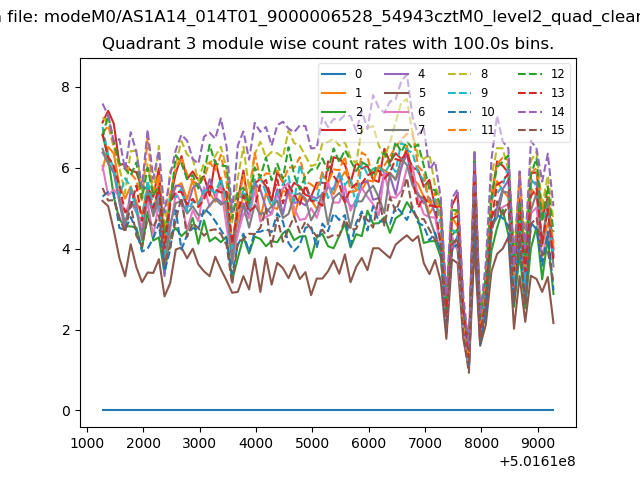
| Module-wise count rates for Quadrant C Data is divided into 100 sec bins |
 |
 |
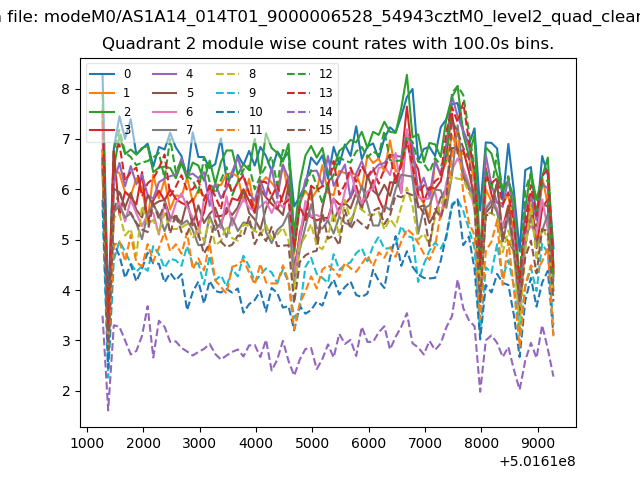
| Module-wise count rates for Quadrant D Data is divided into 100 sec bins |
 |
 |
| Parameter | Plot |
|---|---|
| CZT HV Monitor |  |
| D_VDD | 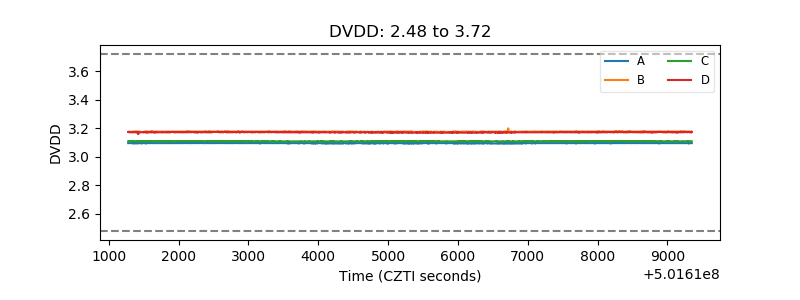 |
| Temperature 1 | 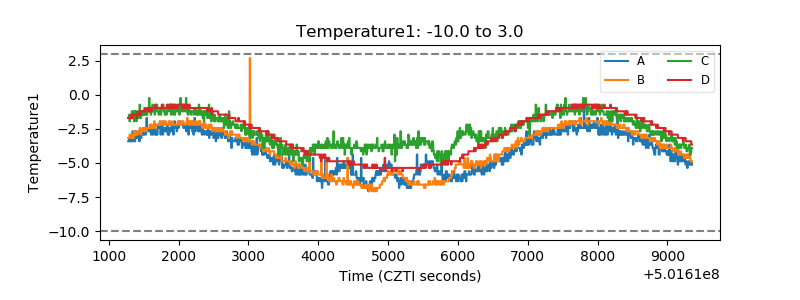 |
| Veto HV Monitor | 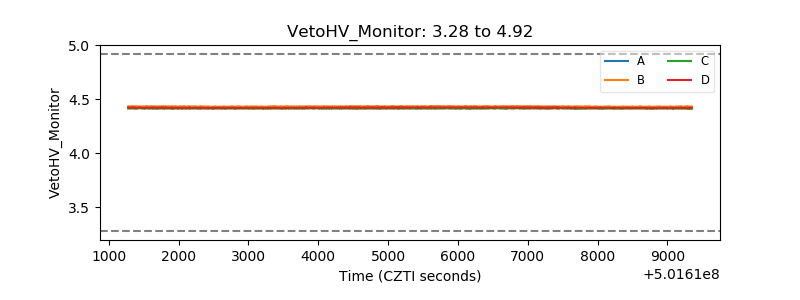 |
| Veto LLD | 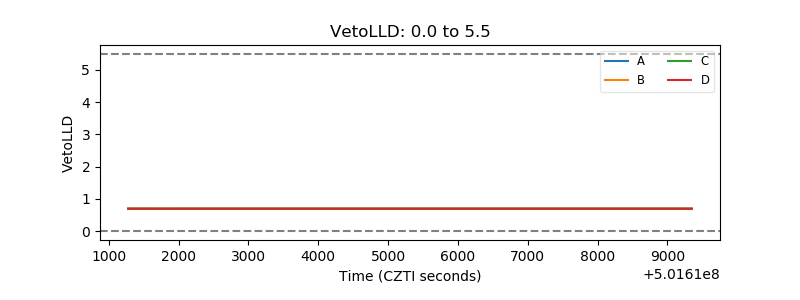 |
| Alpha Counter | 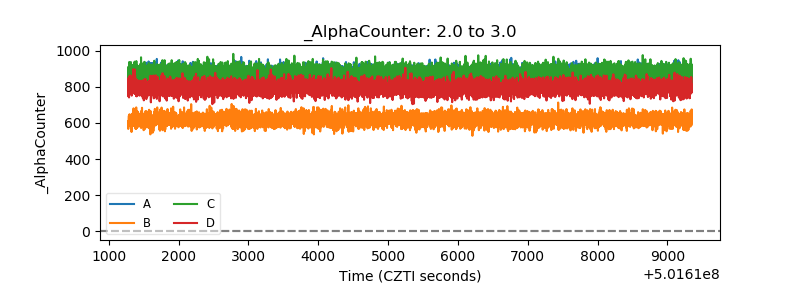 |
| _CPM_Rate | 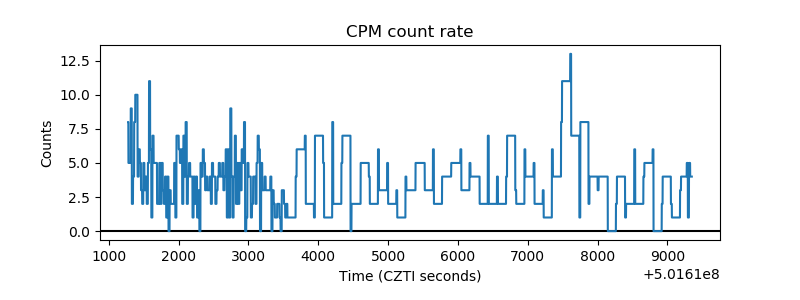 |
| CZT Counter | 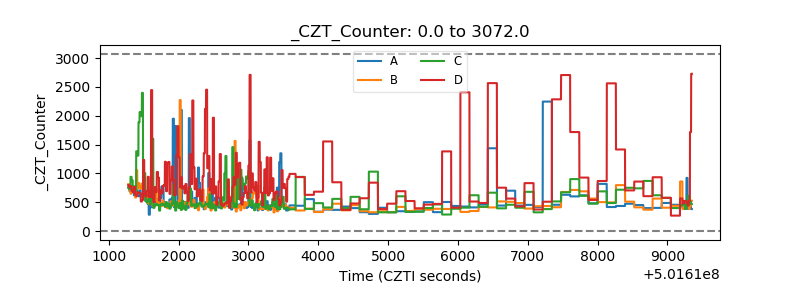 |
| +2.5 Volts monitor |  |
| +5 Volts monitor | 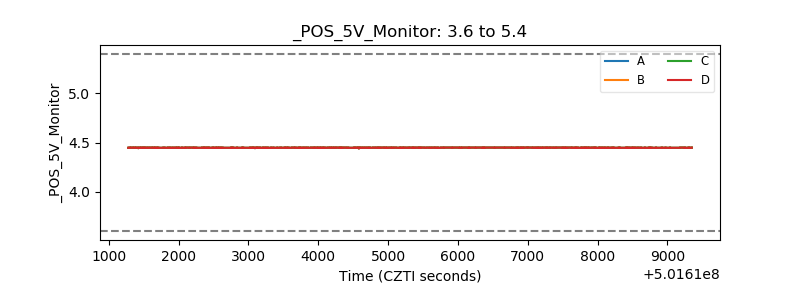 |
| _ROLL_ROT | 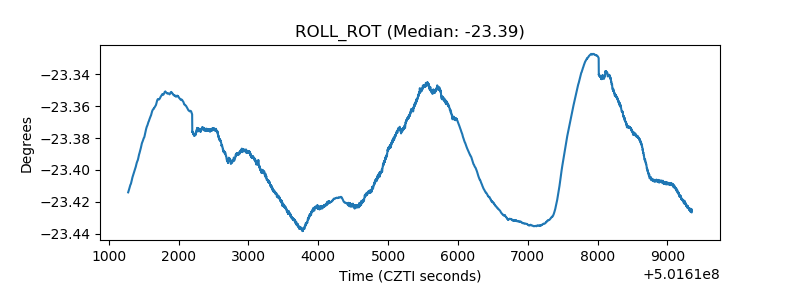 |
| _Roll_DEC | 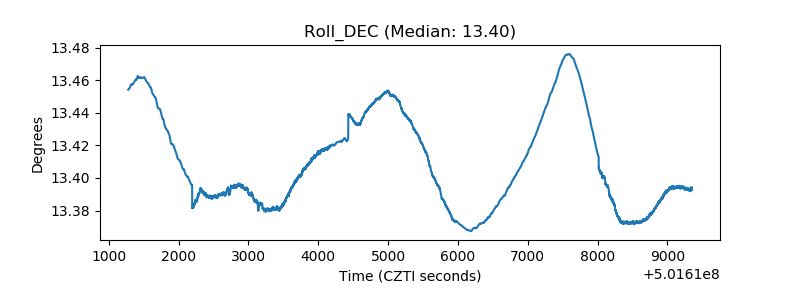 |
| _Roll_RA | 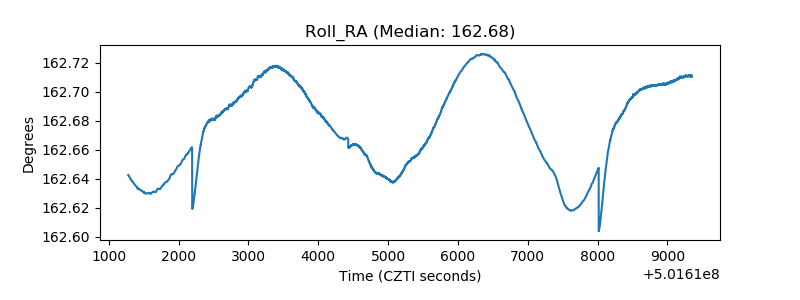 |
| Veto Counter | 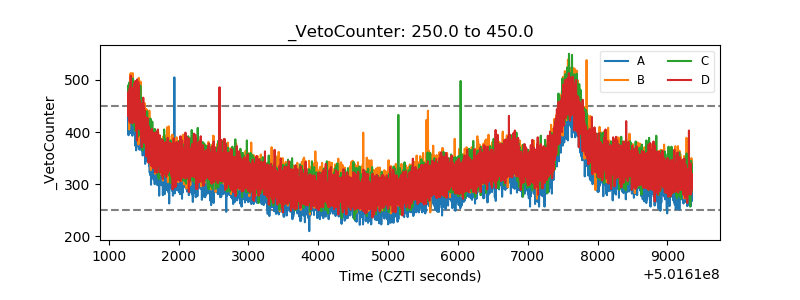 |