| Param | Original file | Final file |
|---|---|---|
| Filename | modeM0/AS1A14_014T01_9000006528_54947cztM0_level2.fits | modeM0/AS1A14_014T01_9000006528_54947cztM0_level2_quad_clean.evt |
| Size (bytes) | 1,361,574,720 | 265,469,760 |
| Size | 1.3 GB | 253.2 MB |
| Events in quadrant A | 9,671,211 | 1,751,140 |
| Events in quadrant B | 8,680,504 | 1,908,814 |
| Events in quadrant C | 11,295,499 | 1,665,868 |
| Events in quadrant D | 19,258,090 | 1,379,225 |
| Mode M0 | |||
|---|---|---|---|
| Quadrant | BADHDUFLAG | Total packets | Discarded packets |
| A | 0 | 43324 | 6 |
| B | 0 | 40851 | 18 |
| C | 0 | 47646 | 5 |
| D | 0 | 70667 | 17 |
| Mode SS | |||
|---|---|---|---|
| Quadrant | BADHDUFLAG | Total packets | Discarded packets |
| A | 0 | 396 | 0 |
| B | 0 | 396 | 0 |
| C | 0 | 396 | 0 |
| D | 0 | 396 | 0 |
| Mode M9 | |||
|---|---|---|---|
| Quadrant | BADHDUFLAG | Total packets | Discarded packets |
| A | 0 | 11 | 0 |
| B | 0 | 11 | 0 |
| C | 0 | 11 | 0 |
| D | 0 | 11 | 0 |
| Quadrant | Total seconds | Saturated seconds | Saturation percentage |
|---|---|---|---|
| A | 19333 | 413 | 2.136244% |
| B | 19323 | 274 | 1.417999% |
| C | 19333 | 638 | 3.300057% |
| D | 19328 | 2650 | 13.710679% |
Noise dominated data is calculated using 1-second bins in cleaned event files. If a bin has >2000 counts, and if more than 50% of those come from <1% of pixels, then it is considered to be noise-dominated and hence unusable.
| Quadrant | # 1 sec bins | Bins with >0 counts | Bins with >2000 counts | High rate bins dominated by noise | Noise dominated (total time) | Noise dominated (detector-on time) | Marked lightcurve |
|---|---|---|---|---|---|---|---|
| A | 20605 | 19336 | 332 | 332 | 1.61% | 1.72% | 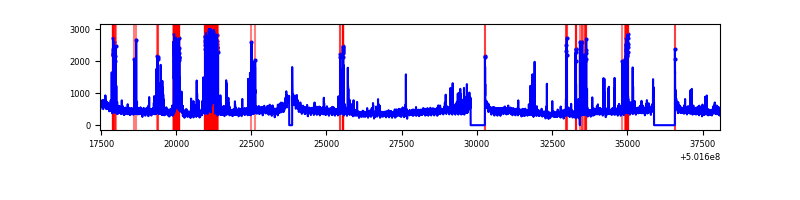 |
| B | 20604 | 19331 | 28 | 28 | 0.14% | 0.14% | 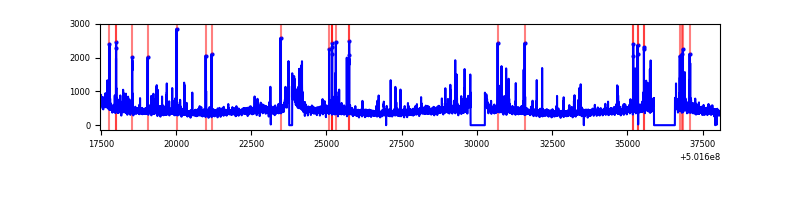 |
| C | 20604 | 19335 | 438 | 438 | 2.13% | 2.27% | 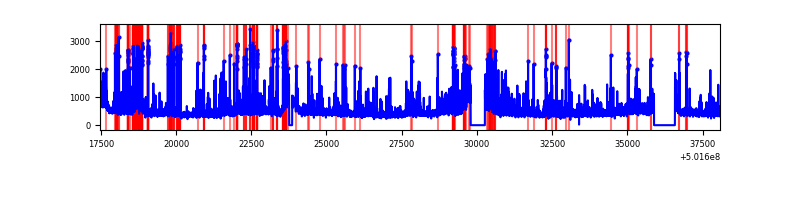 |
| D | 20604 | 19333 | 2379 | 2379 | 11.55% | 12.31% | 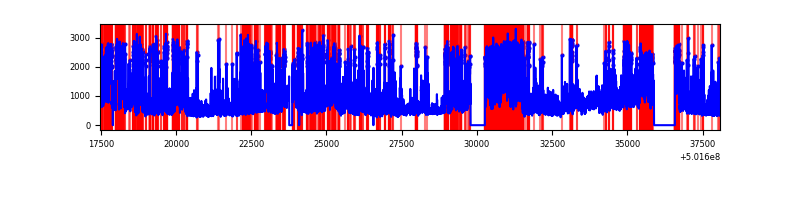 |
Top three noisy pixels from each quadrant. If the there are fewer than three noisy pixels in the level2.evt file, extra rows are filled as -1
| Pixel properties | Quadrant properties | ||||||
|---|---|---|---|---|---|---|---|
| Quadrant | DetID | PixID | Counts | Sigma | Mean | Median | Sigma |
| A | 8 | 249 | 906847 | 1765.0 | 2059 | 1999 | 512.7 |
| A | 0 | 8 | 403864 | 783.88 | 2059 | 1999 | 512.7 |
| A | 4 | 3 | 117309 | 224.92 | 2059 | 1999 | 512.7 |
| B | 5 | 185 | 184153 | 416.58 | 2043 | 1964 | 437.3 |
| B | 7 | 252 | 95311 | 213.44 | 2043 | 1964 | 437.3 |
| B | 5 | 236 | 93119 | 208.43 | 2043 | 1964 | 437.3 |
| C | 12 | 252 | 949097 | 1737.21 | 1990 | 1970 | 545.2 |
| C | 9 | 38 | 733546 | 1341.85 | 1990 | 1970 | 545.2 |
| C | 14 | 254 | 555043 | 1014.44 | 1990 | 1970 | 545.2 |
| D | 11 | 129 | 2941976 | 5475.27 | 1881 | 1801 | 537.0 |
| D | 11 | 176 | 1821664 | 3389.0 | 1881 | 1801 | 537.0 |
| D | 3 | 12 | 1497812 | 2785.91 | 1881 | 1801 | 537.0 |
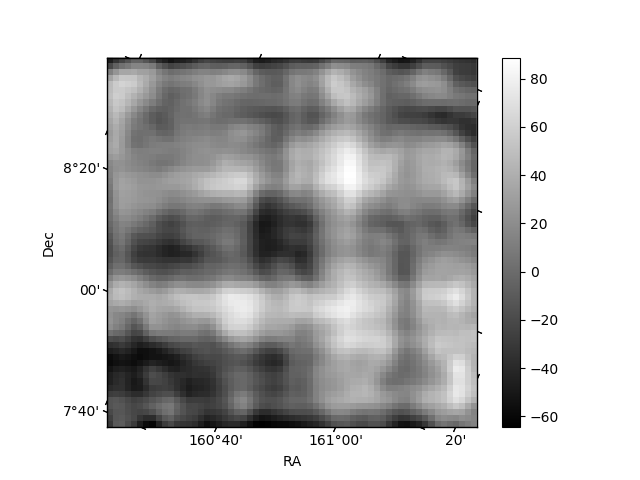
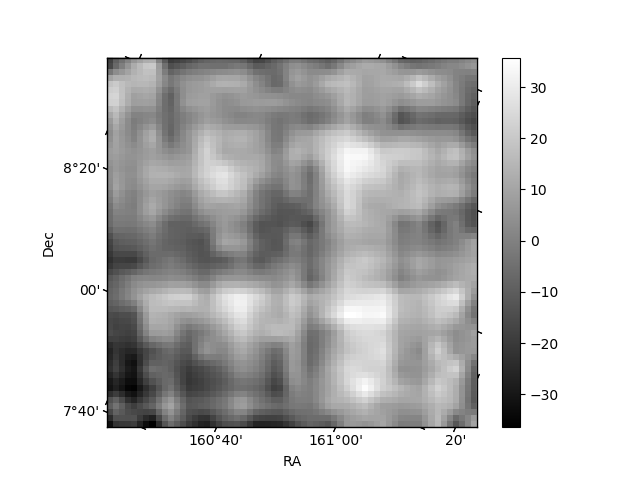
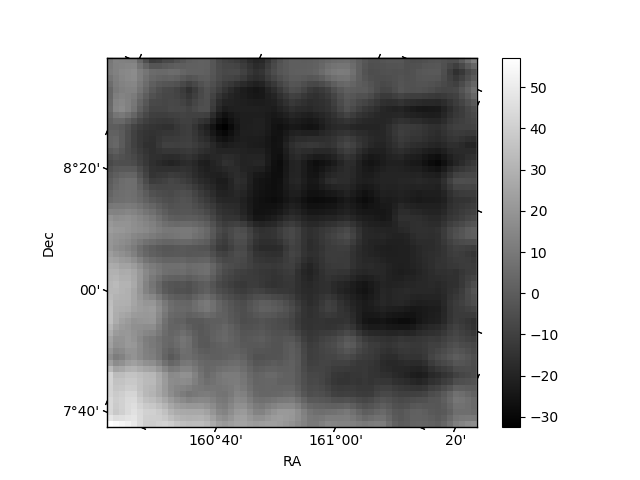
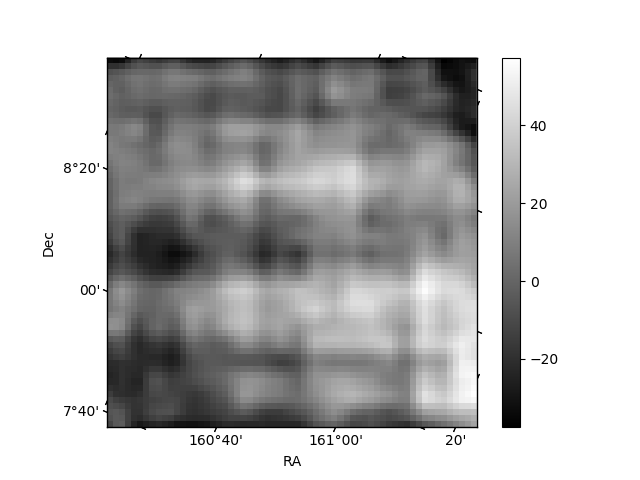
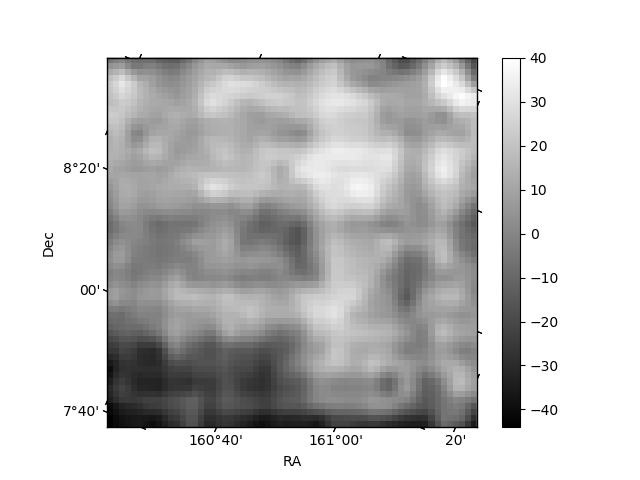
Histogram calculated using DETX and DETY for each event in the final _common_clean file
| Quadrant A | 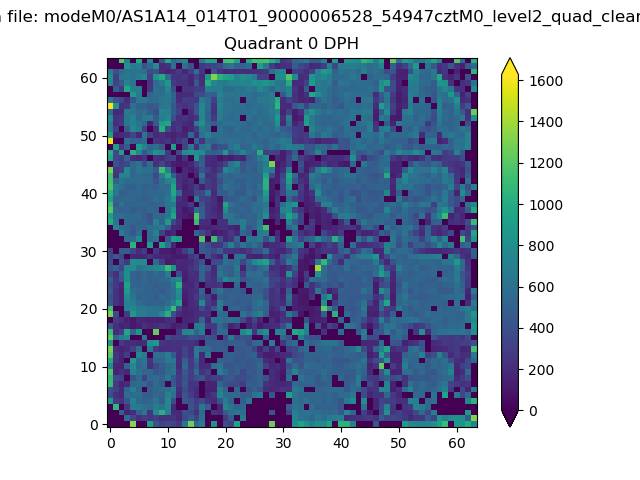 |
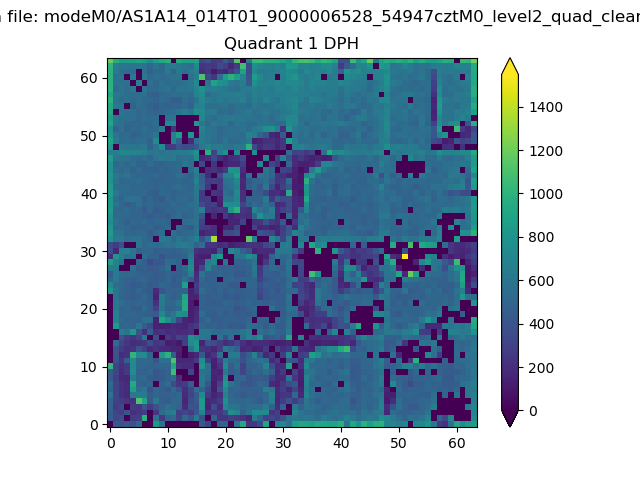 |
Quadrant B |
|---|---|---|---|
| Quadrant D | 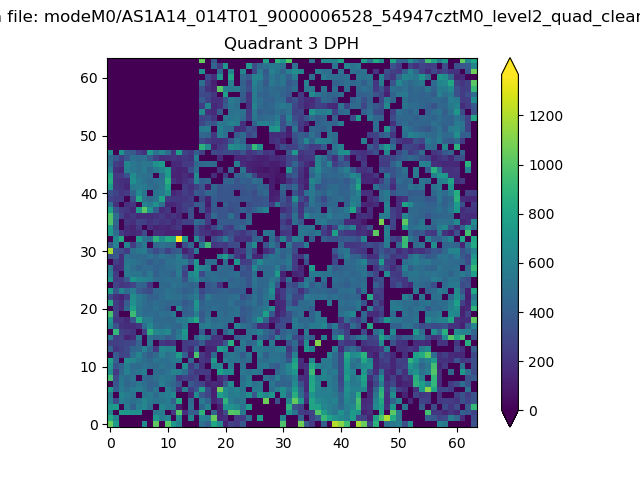 |
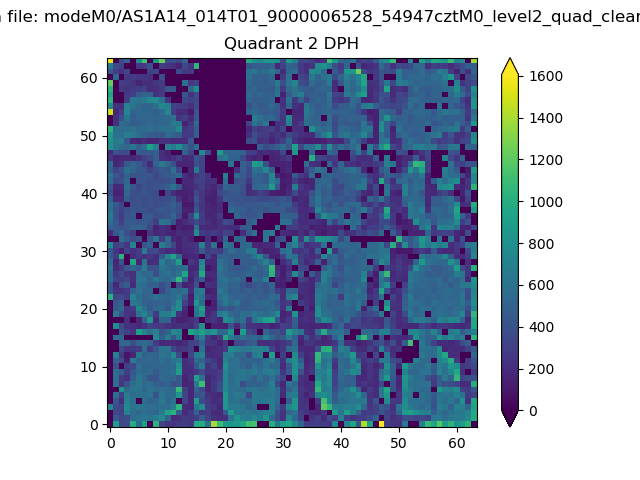 |
Quadrant C |
| Plot type | Count rate plots | Images |
|---|---|---|
| Comparison with Poisson distribution Blue bars denote a histogram of data divided into 1 sec bins. Red curve is a Poisson curve with rate = median count rate of data. |
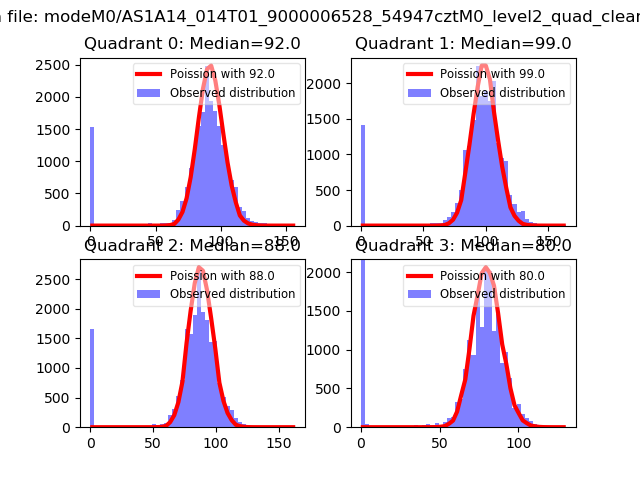 |
 |
| Quadrant-wise count rates Data is divided into 100 sec bins |
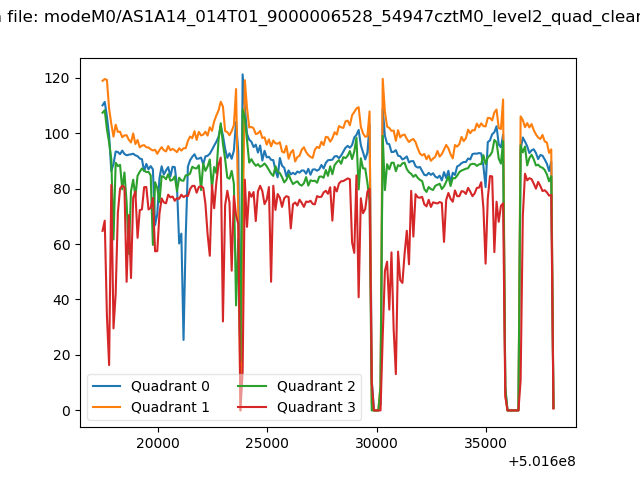 |
|
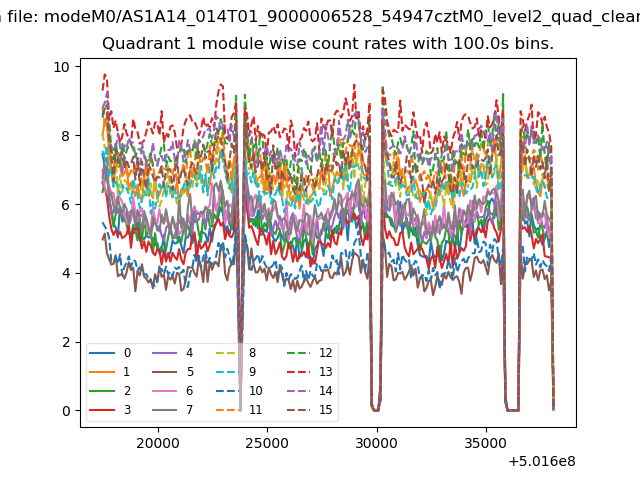
| Module-wise count rates for Quadrant A Data is divided into 100 sec bins |
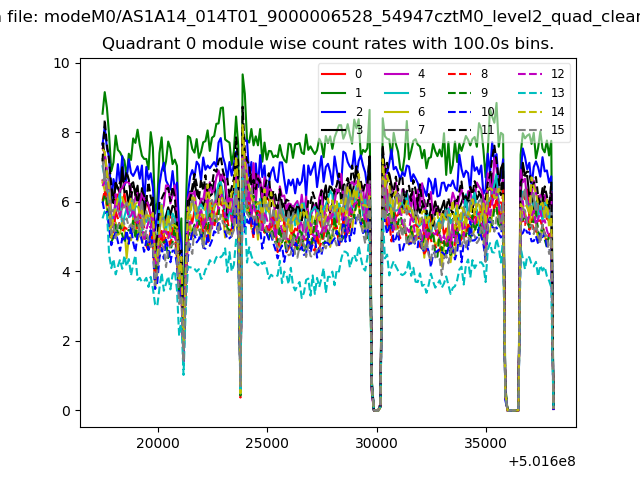 |
 |
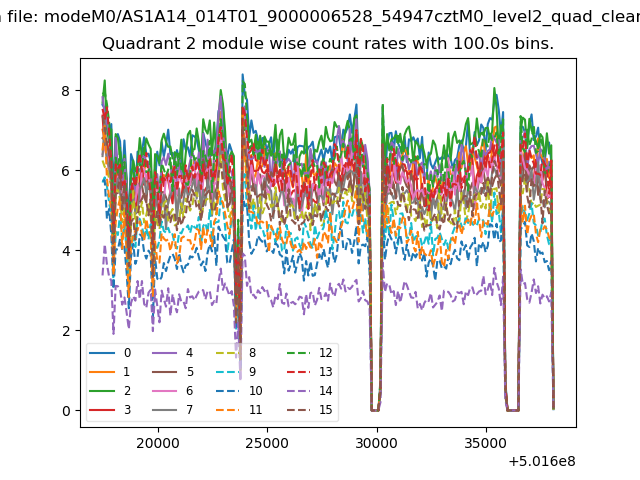
| Module-wise count rates for Quadrant B Data is divided into 100 sec bins |
 |
 |
| Module-wise count rates for Quadrant C Data is divided into 100 sec bins |
 |
 |
| Module-wise count rates for Quadrant D Data is divided into 100 sec bins |
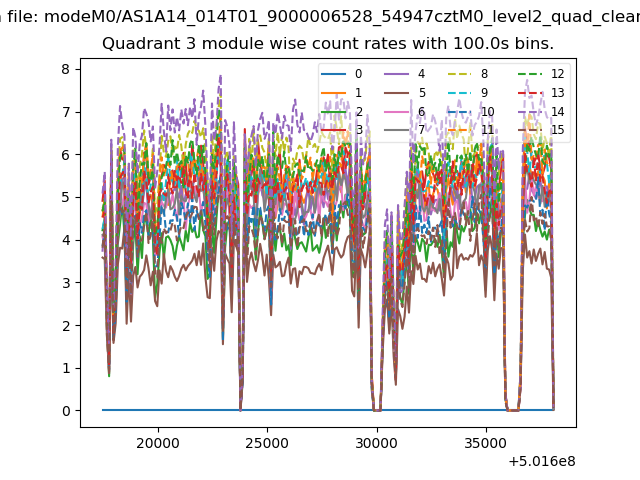 |
 |
| Parameter | Plot |
|---|---|
| CZT HV Monitor | 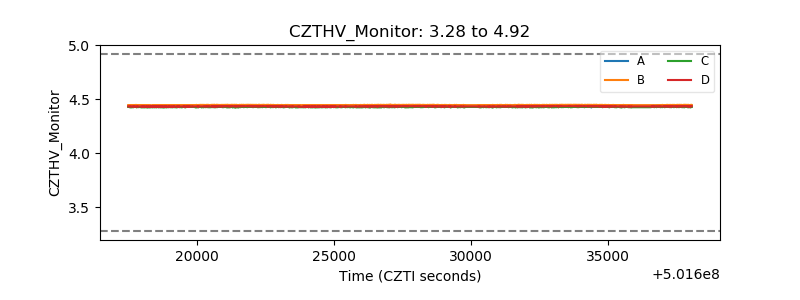 |
| D_VDD | 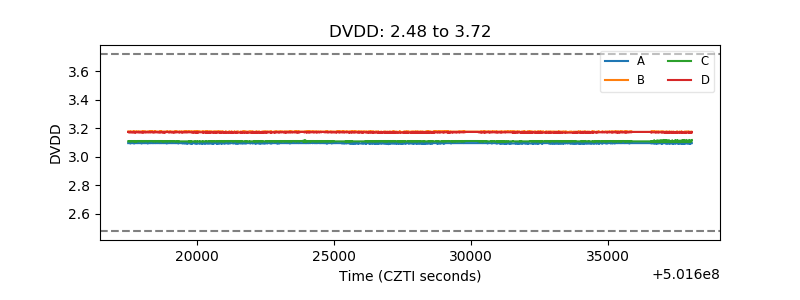 |
| Temperature 1 | 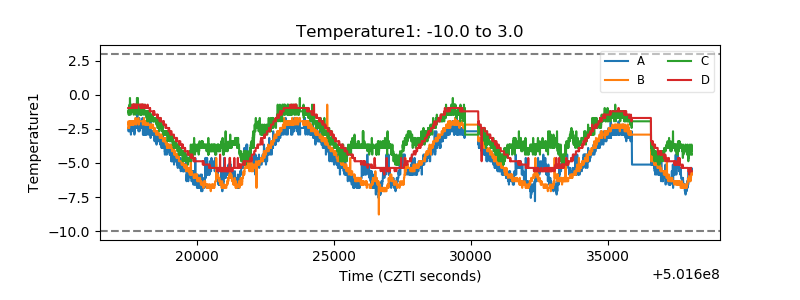 |
| Veto HV Monitor | 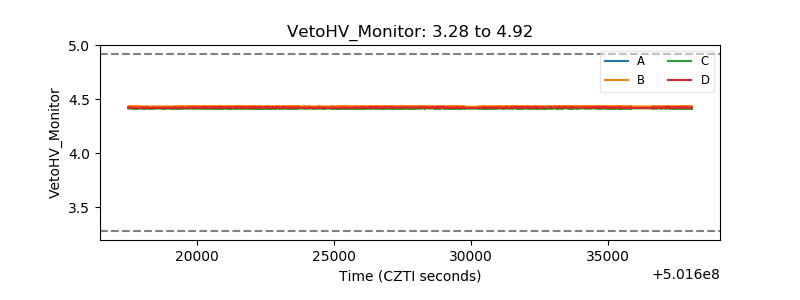 |
| Veto LLD | 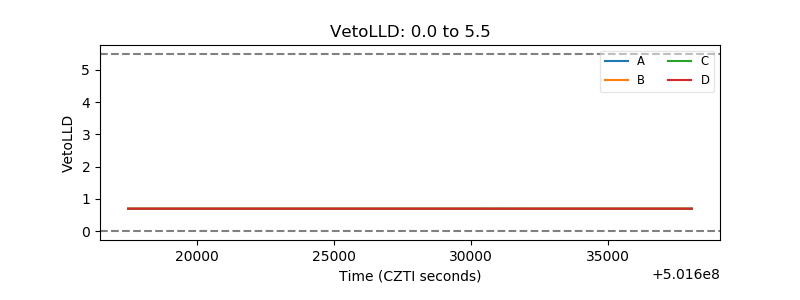 |
| Alpha Counter | 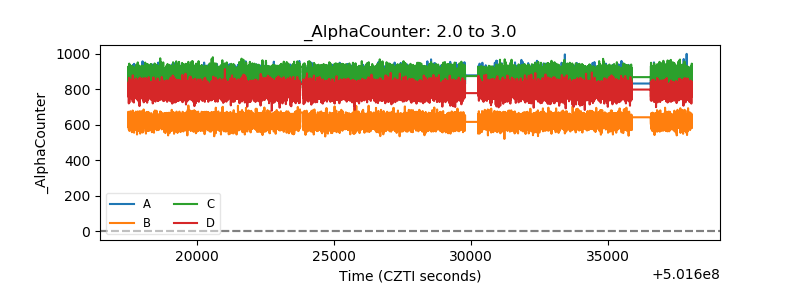 |
| _CPM_Rate | 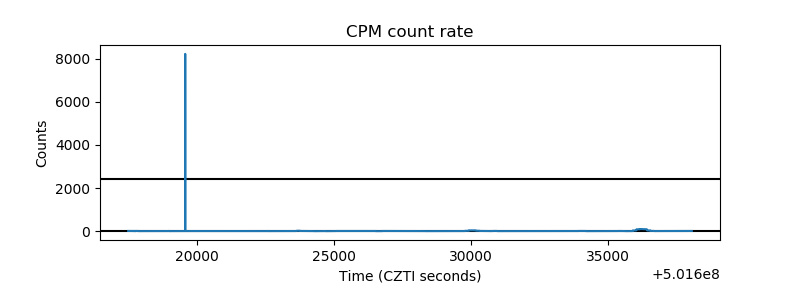 |
| CZT Counter | 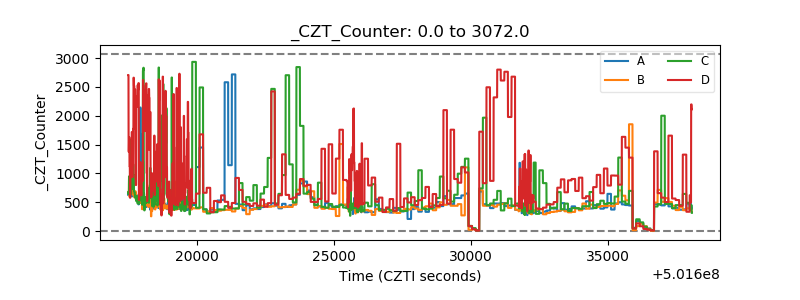 |
| +2.5 Volts monitor |  |
| +5 Volts monitor |  |
| _ROLL_ROT | 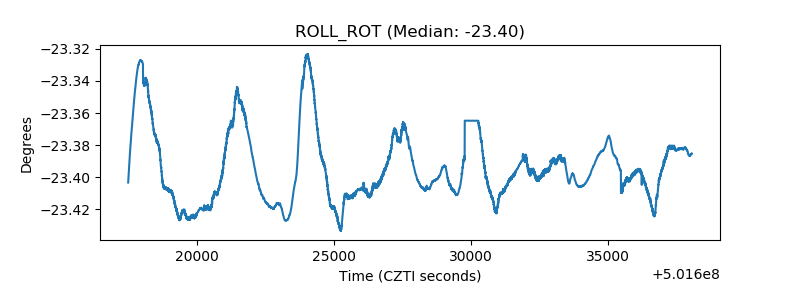 |
| _Roll_DEC | 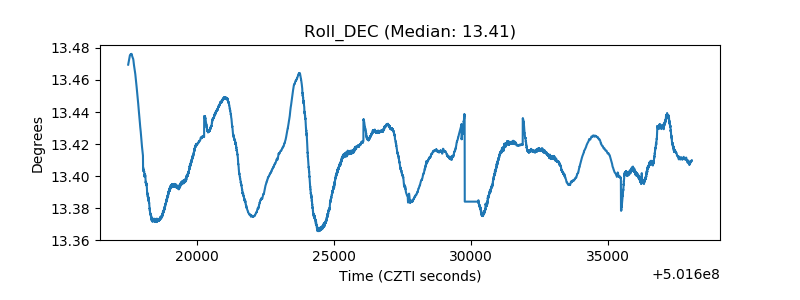 |
| _Roll_RA | 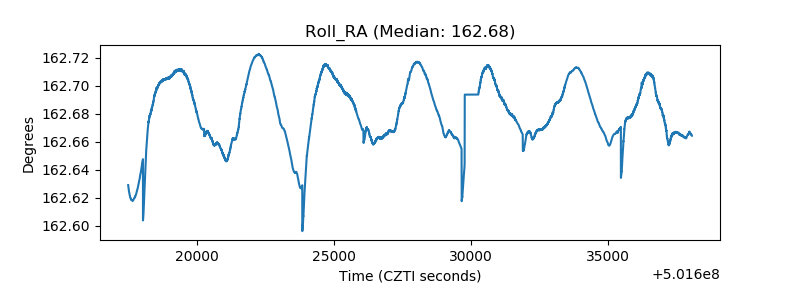 |
| Veto Counter | 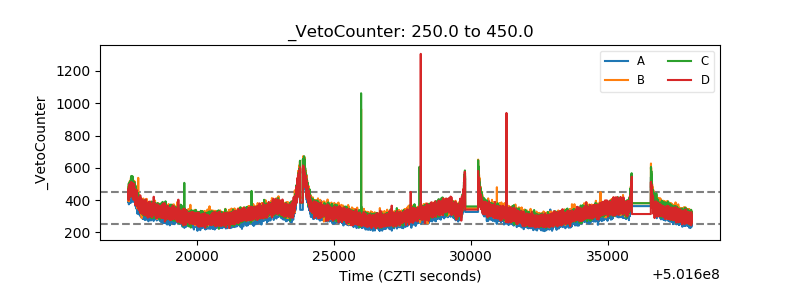 |