| Param | Original file | Final file |
|---|---|---|
| Filename | modeM0/AS1A14_014T01_9000006528_54949cztM0_level2.fits | modeM0/AS1A14_014T01_9000006528_54949cztM0_level2_quad_clean.evt |
| Size (bytes) | 1,029,827,520 | 146,185,920 |
| Size | 982.1 MB | 139.4 MB |
| Events in quadrant A | 6,258,690 | 1,032,518 |
| Events in quadrant B | 4,808,900 | 1,159,947 |
| Events in quadrant C | 5,937,259 | 1,008,268 |
| Events in quadrant D | 20,216,281 | 423,901 |
| Mode M0 | |||
|---|---|---|---|
| Quadrant | BADHDUFLAG | Total packets | Discarded packets |
| A | 0 | 27340 | 3 |
| B | 0 | 23585 | 2 |
| C | 0 | 26485 | 2 |
| D | 0 | 68175 | 2 |
| Mode SS | |||
|---|---|---|---|
| Quadrant | BADHDUFLAG | Total packets | Discarded packets |
| A | 0 | 234 | 0 |
| B | 0 | 234 | 0 |
| C | 0 | 234 | 0 |
| D | 0 | 234 | 0 |
| Mode M9 | |||
|---|---|---|---|
| Quadrant | BADHDUFLAG | Total packets | Discarded packets |
| A | 0 | 19 | 0 |
| B | 0 | 19 | 0 |
| C | 0 | 19 | 0 |
| D | 0 | 19 | 0 |
| Quadrant | Total seconds | Saturated seconds | Saturation percentage |
|---|---|---|---|
| A | 11589 | 425 | 3.667271% |
| B | 11590 | 40 | 0.345125% |
| C | 11590 | 191 | 1.647972% |
| D | 11590 | 6654 | 57.411562% |
Noise dominated data is calculated using 1-second bins in cleaned event files. If a bin has >2000 counts, and if more than 50% of those come from <1% of pixels, then it is considered to be noise-dominated and hence unusable.
| Quadrant | # 1 sec bins | Bins with >0 counts | Bins with >2000 counts | High rate bins dominated by noise | Noise dominated (total time) | Noise dominated (detector-on time) | Marked lightcurve |
|---|---|---|---|---|---|---|---|
| A | 13439 | 11589 | 407 | 407 | 3.03% | 3.51% | 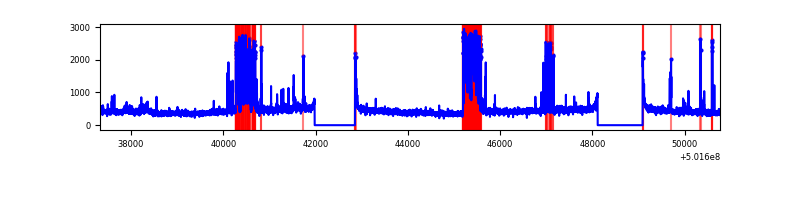 |
| B | 13440 | 11590 | 2 | 2 | 0.01% | 0.02% | 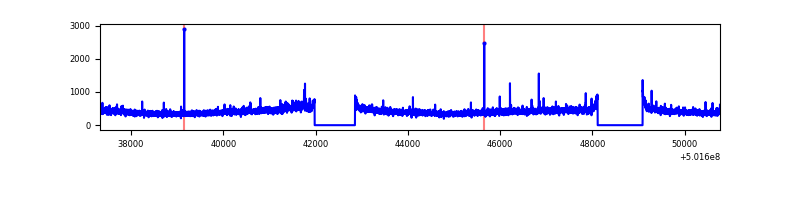 |
| C | 13440 | 11592 | 194 | 194 | 1.44% | 1.67% | 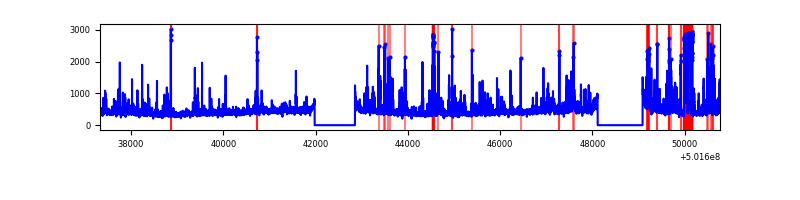 |
| D | 13439 | 11589 | 6434 | 6434 | 47.88% | 55.52% | 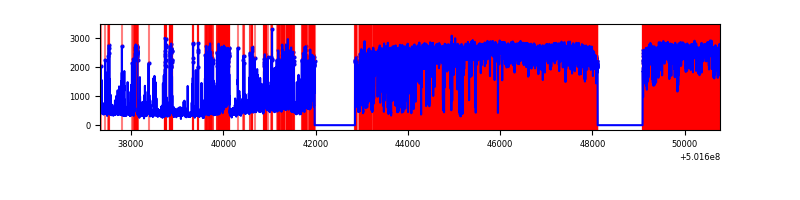 |
Top three noisy pixels from each quadrant. If the there are fewer than three noisy pixels in the level2.evt file, extra rows are filled as -1
| Pixel properties | Quadrant properties | ||||||
|---|---|---|---|---|---|---|---|
| Quadrant | DetID | PixID | Counts | Sigma | Mean | Median | Sigma |
| A | 15 | 32 | 1236956 | 4181.29 | 1180 | 1149 | 295.6 |
| A | 3 | 14 | 177922 | 598.1 | 1180 | 1149 | 295.6 |
| A | 0 | 8 | 93376 | 312.05 | 1180 | 1149 | 295.6 |
| B | 7 | 0 | 46344 | 176.52 | 1187 | 1143 | 256.1 |
| B | 12 | 111 | 31422 | 118.24 | 1187 | 1143 | 256.1 |
| B | 11 | 111 | 29028 | 108.89 | 1187 | 1143 | 256.1 |
| C | 6 | 223 | 561692 | 1754.81 | 1153 | 1141 | 319.4 |
| C | 12 | 252 | 372868 | 1163.69 | 1153 | 1141 | 319.4 |
| C | 14 | 254 | 213288 | 664.13 | 1153 | 1141 | 319.4 |
| D | 15 | 94 | 11596734 | 53169.96 | 759 | 724 | 218.1 |
| D | 15 | 93 | 1947654 | 8927.05 | 759 | 724 | 218.1 |
| D | 15 | 110 | 1559505 | 7147.31 | 759 | 724 | 218.1 |
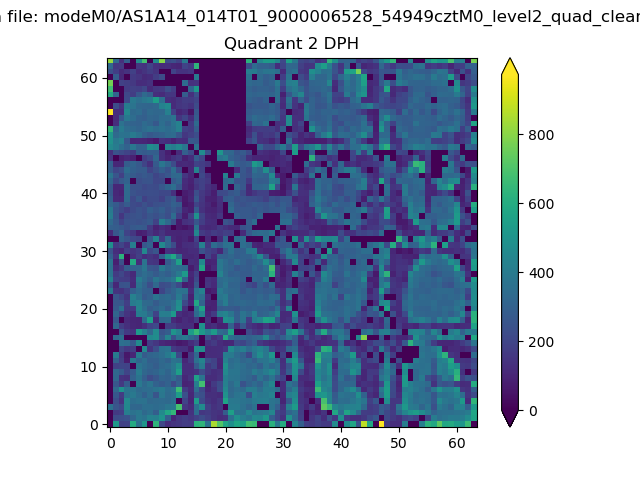
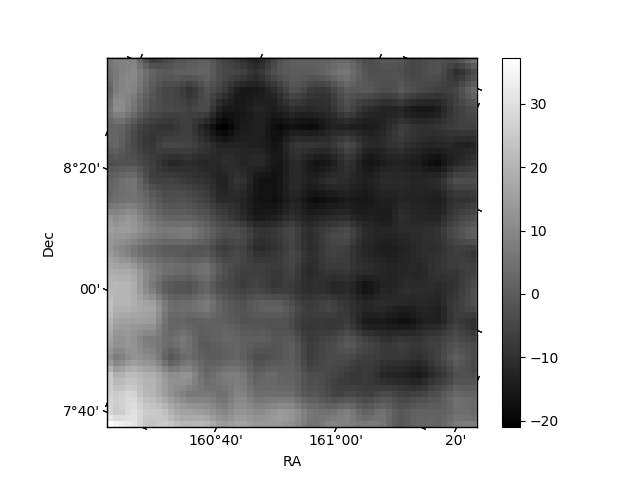
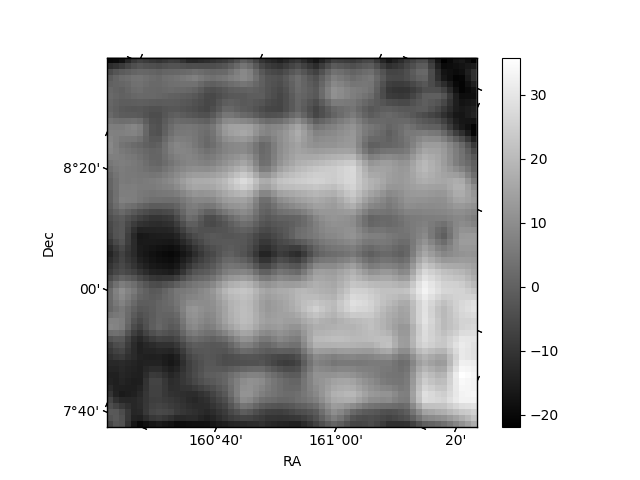
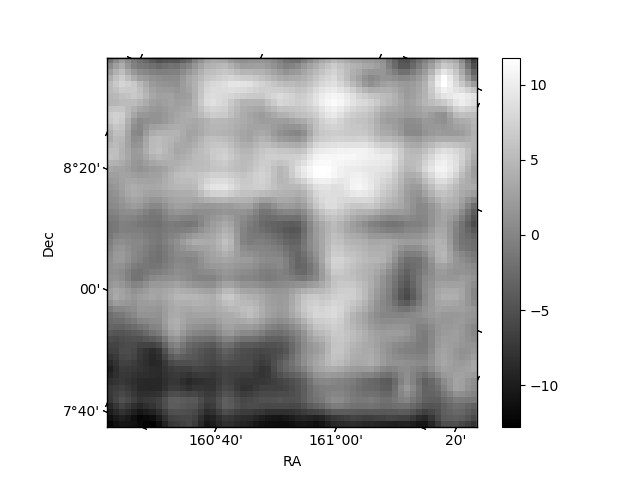
Histogram calculated using DETX and DETY for each event in the final _common_clean file
| Quadrant A |  |
 |
Quadrant B |
|---|---|---|---|
| Quadrant D |  |
 |
Quadrant C |
| Plot type | Count rate plots | Images |
|---|---|---|
| Comparison with Poisson distribution Blue bars denote a histogram of data divided into 1 sec bins. Red curve is a Poisson curve with rate = median count rate of data. |
 |
 |
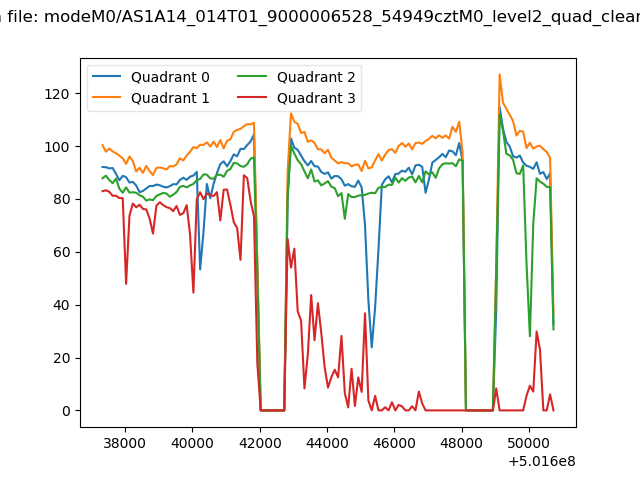
| Quadrant-wise count rates Data is divided into 100 sec bins |
 |
|
| Module-wise count rates for Quadrant A Data is divided into 100 sec bins |
 |
 |
| Module-wise count rates for Quadrant B Data is divided into 100 sec bins |
 |
 |
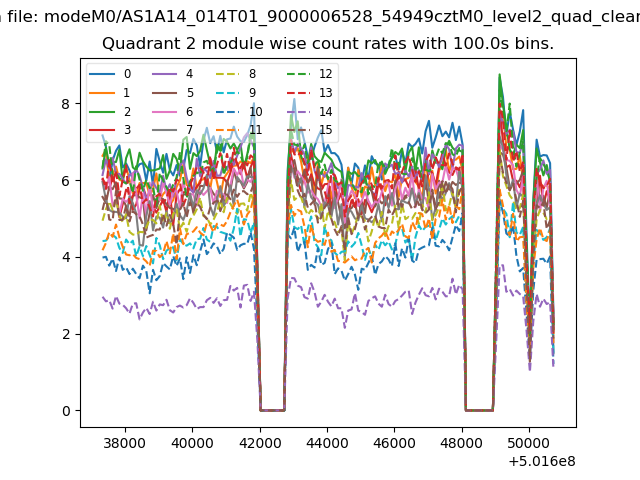
| Module-wise count rates for Quadrant C Data is divided into 100 sec bins |
 |
 |
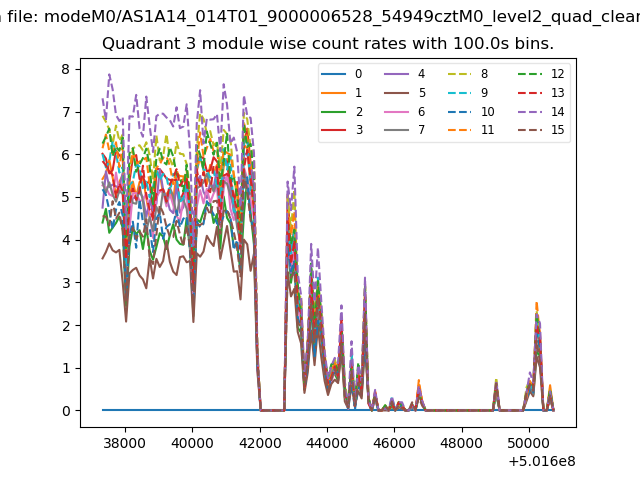
| Module-wise count rates for Quadrant D Data is divided into 100 sec bins |
 |
 |
| Parameter | Plot |
|---|---|
| CZT HV Monitor | 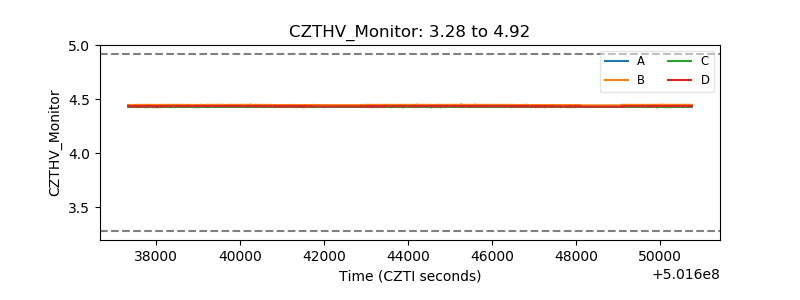 |
| D_VDD | 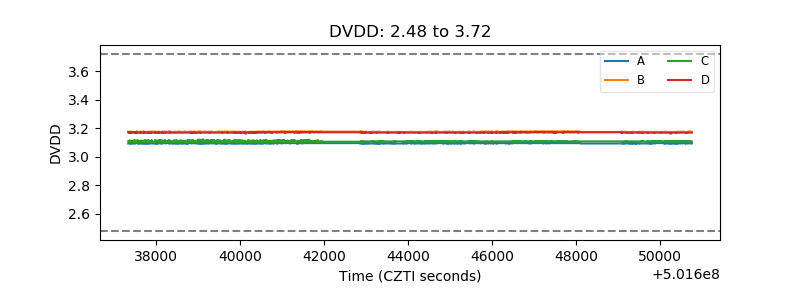 |
| Temperature 1 | 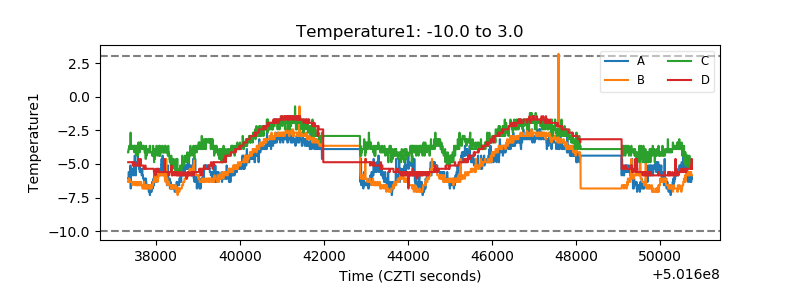 |
| Veto HV Monitor |  |
| Veto LLD | 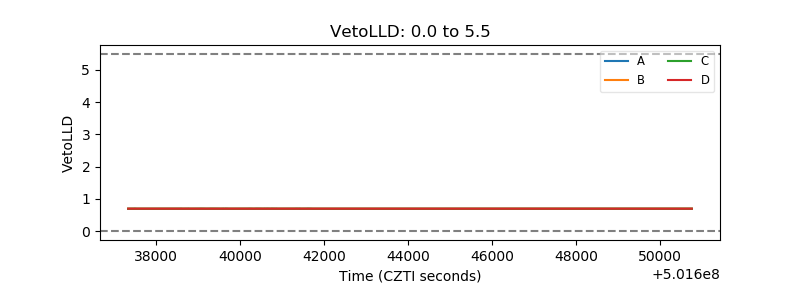 |
| Alpha Counter | 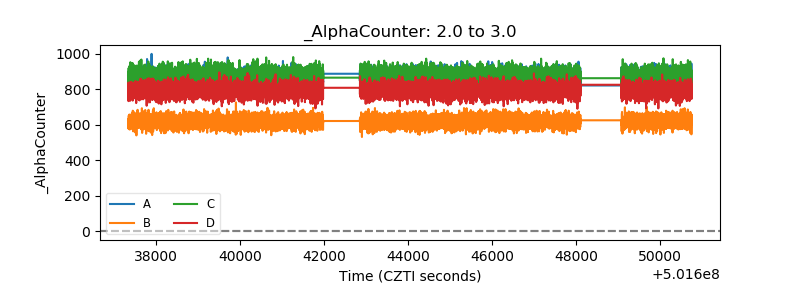 |
| _CPM_Rate | 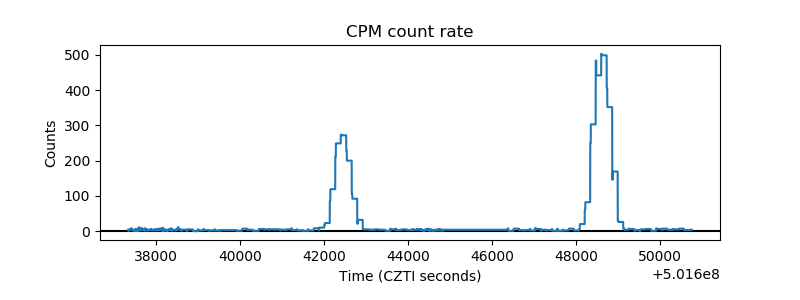 |
| CZT Counter | 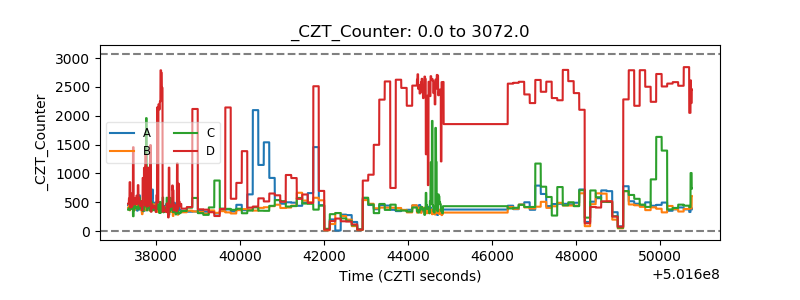 |
| +2.5 Volts monitor |  |
| +5 Volts monitor |  |
| _ROLL_ROT | 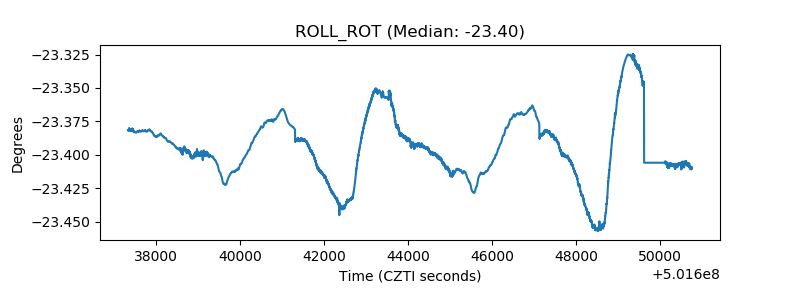 |
| _Roll_DEC | 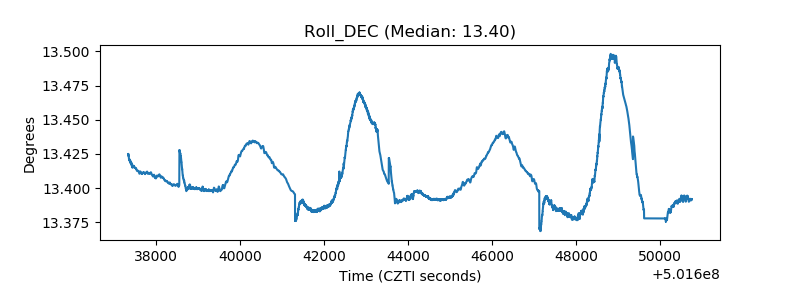 |
| _Roll_RA | 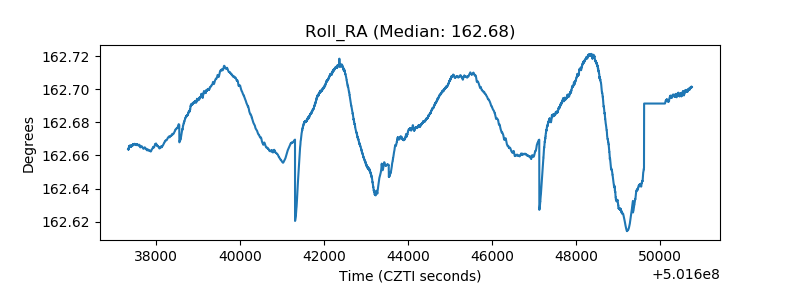 |
| Veto Counter | 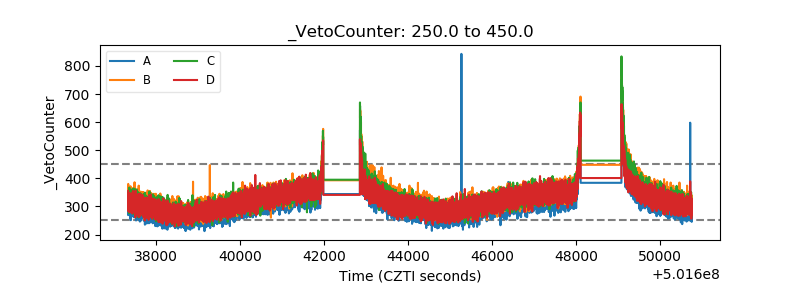 |