| Param | Original file | Final file |
|---|---|---|
| Filename | modeM0/AS1A14_014T01_9000006528_54950cztM0_level2.fits | modeM0/AS1A14_014T01_9000006528_54950cztM0_level2_quad_clean.evt |
| Size (bytes) | 699,235,200 | 77,207,040 |
| Size | 666.8 MB | 73.6 MB |
| Events in quadrant A | 3,780,266 | 600,802 |
| Events in quadrant B | 2,777,644 | 677,720 |
| Events in quadrant C | 3,686,413 | 585,171 |
| Events in quadrant D | 15,128,098 | 17,208 |
| Mode M0 | |||
|---|---|---|---|
| Quadrant | BADHDUFLAG | Total packets | Discarded packets |
| A | 0 | 16032 | 1 |
| B | 0 | 13375 | 1 |
| C | 0 | 15820 | 1 |
| D | 0 | 49460 | 1 |
| Mode SS | |||
|---|---|---|---|
| Quadrant | BADHDUFLAG | Total packets | Discarded packets |
| A | 0 | 132 | 0 |
| B | 0 | 132 | 0 |
| C | 0 | 132 | 0 |
| D | 0 | 132 | 0 |
| Mode M9 | |||
|---|---|---|---|
| Quadrant | BADHDUFLAG | Total packets | Discarded packets |
| A | 0 | 11 | 0 |
| B | 0 | 11 | 0 |
| C | 0 | 11 | 0 |
| D | 0 | 11 | 0 |
| Quadrant | Total seconds | Saturated seconds | Saturation percentage |
|---|---|---|---|
| A | 6551 | 346 | 5.281636% |
| B | 6551 | 49 | 0.747977% |
| C | 6551 | 218 | 3.327736% |
| D | 6551 | 6392 | 97.572890% |
Noise dominated data is calculated using 1-second bins in cleaned event files. If a bin has >2000 counts, and if more than 50% of those come from <1% of pixels, then it is considered to be noise-dominated and hence unusable.
| Quadrant | # 1 sec bins | Bins with >0 counts | Bins with >2000 counts | High rate bins dominated by noise | Noise dominated (total time) | Noise dominated (detector-on time) | Marked lightcurve |
|---|---|---|---|---|---|---|---|
| A | 7605 | 6550 | 269 | 269 | 3.54% | 4.11% | 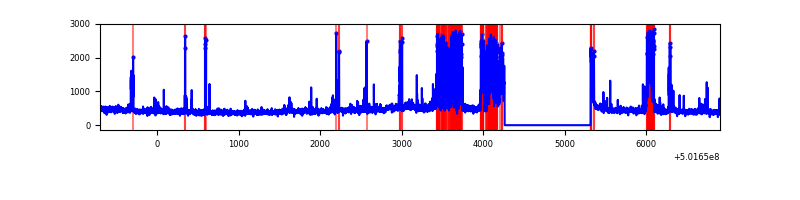 |
| B | 7605 | 6550 | 3 | 3 | 0.04% | 0.05% | 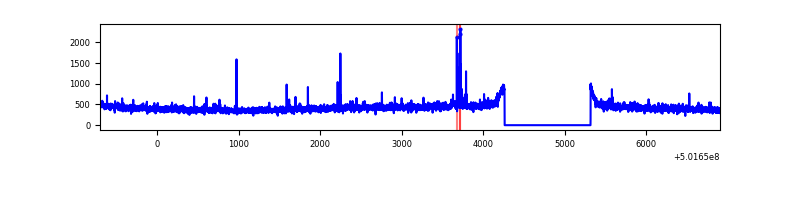 |
| C | 7605 | 6550 | 208 | 208 | 2.74% | 3.18% | 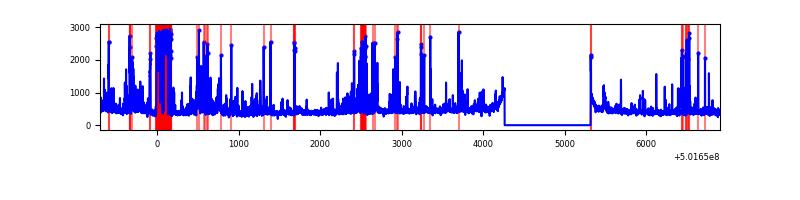 |
| D | 7605 | 6550 | 5118 | 5118 | 67.30% | 78.14% | 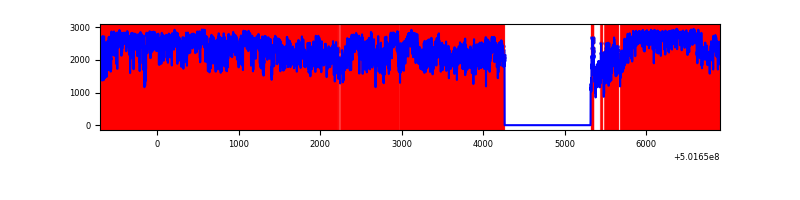 |
Top three noisy pixels from each quadrant. If the there are fewer than three noisy pixels in the level2.evt file, extra rows are filled as -1
| Pixel properties | Quadrant properties | ||||||
|---|---|---|---|---|---|---|---|
| Quadrant | DetID | PixID | Counts | Sigma | Mean | Median | Sigma |
| A | 0 | 8 | 465372 | 2785.49 | 674 | 658 | 166.8 |
| A | 3 | 45 | 281849 | 1685.46 | 674 | 658 | 166.8 |
| A | 15 | 32 | 211470 | 1263.61 | 674 | 658 | 166.8 |
| B | 7 | 252 | 26844 | 175.53 | 687 | 662 | 149.2 |
| B | 12 | 111 | 17913 | 115.65 | 687 | 662 | 149.2 |
| B | 11 | 111 | 16671 | 107.33 | 687 | 662 | 149.2 |
| C | 6 | 223 | 444486 | 2438.07 | 660 | 655 | 182.0 |
| C | 4 | 5 | 225243 | 1233.72 | 660 | 655 | 182.0 |
| C | 12 | 252 | 172670 | 944.92 | 660 | 655 | 182.0 |
| D | 15 | 94 | 12053025 | 213293.9 | 190 | 181 | 56.5 |
| D | 15 | 93 | 898164 | 15891.21 | 190 | 181 | 56.5 |
| D | 15 | 110 | 665597 | 11775.58 | 190 | 181 | 56.5 |
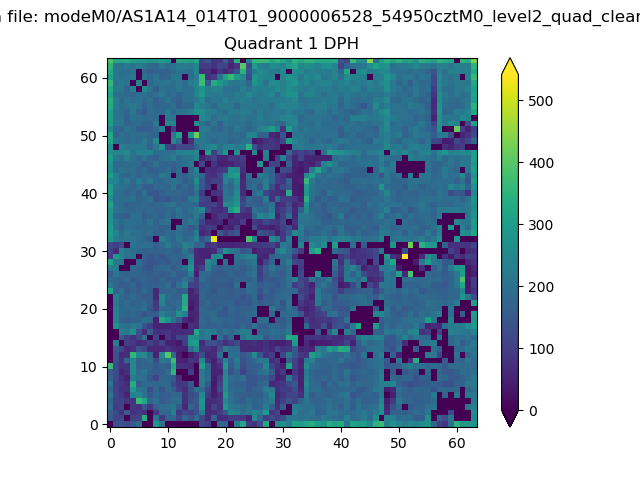
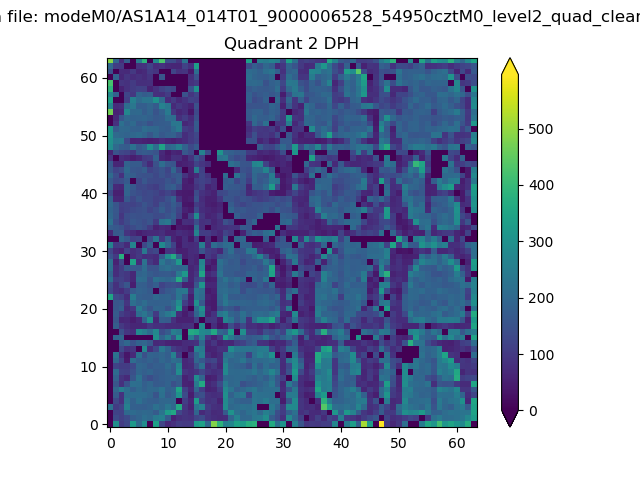
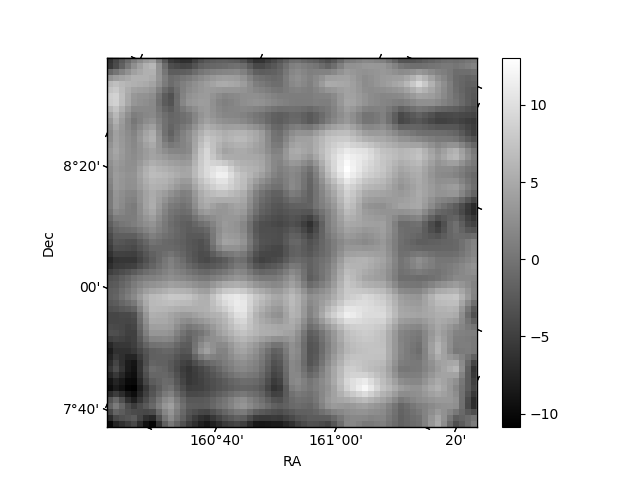
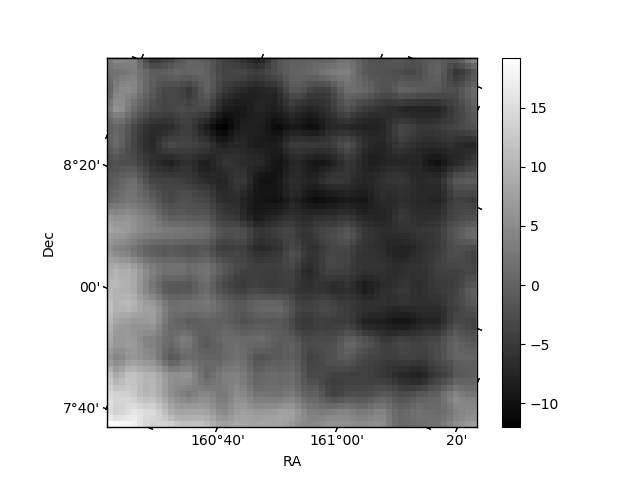
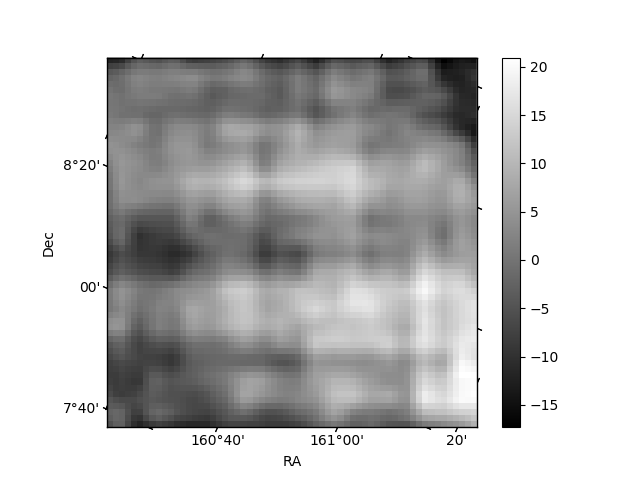
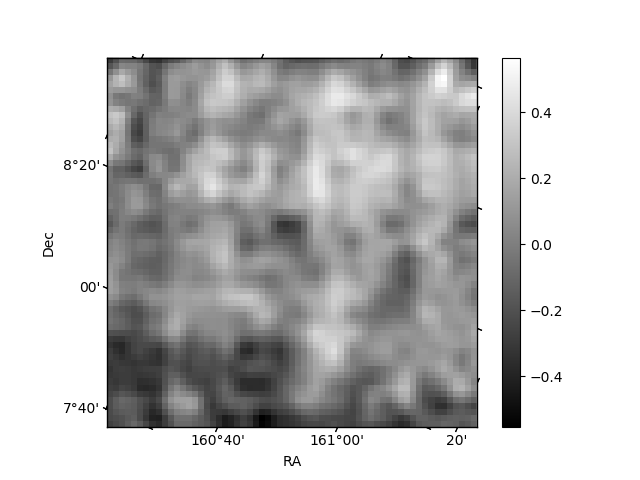
Histogram calculated using DETX and DETY for each event in the final _common_clean file
| Quadrant A |  |
 |
Quadrant B |
|---|---|---|---|
| Quadrant D | 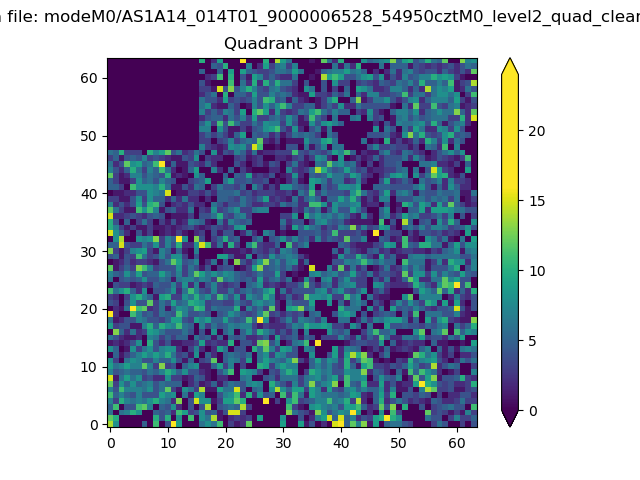 |
 |
Quadrant C |
| Plot type | Count rate plots | Images |
|---|---|---|
| Comparison with Poisson distribution Blue bars denote a histogram of data divided into 1 sec bins. Red curve is a Poisson curve with rate = median count rate of data. |
 |
 |
| Quadrant-wise count rates Data is divided into 100 sec bins |
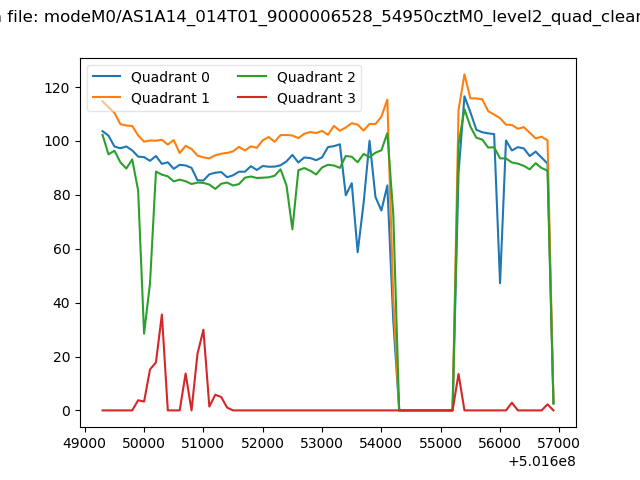 |
|
| Module-wise count rates for Quadrant A Data is divided into 100 sec bins |
 |
 |
| Module-wise count rates for Quadrant B Data is divided into 100 sec bins |
 |
 |
| Module-wise count rates for Quadrant C Data is divided into 100 sec bins |
 |
 |
| Module-wise count rates for Quadrant D Data is divided into 100 sec bins |
 |
 |
| Parameter | Plot |
|---|---|
| CZT HV Monitor |  |
| D_VDD | 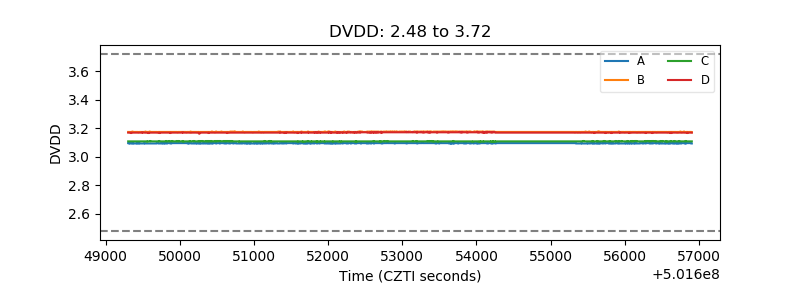 |
| Temperature 1 | 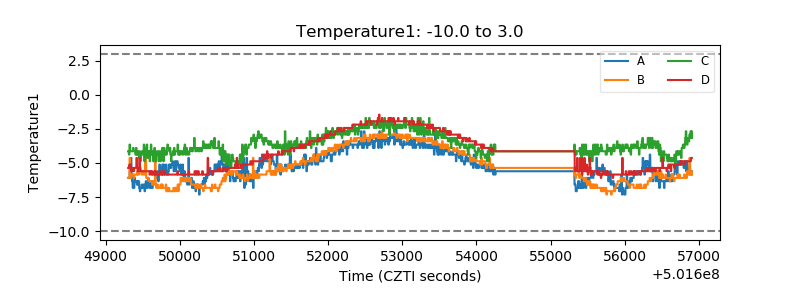 |
| Veto HV Monitor | 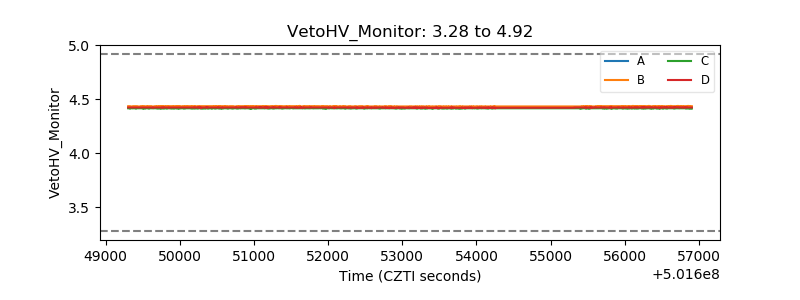 |
| Veto LLD | 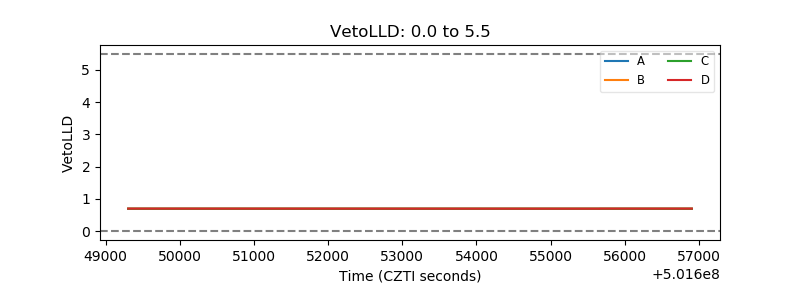 |
| Alpha Counter | 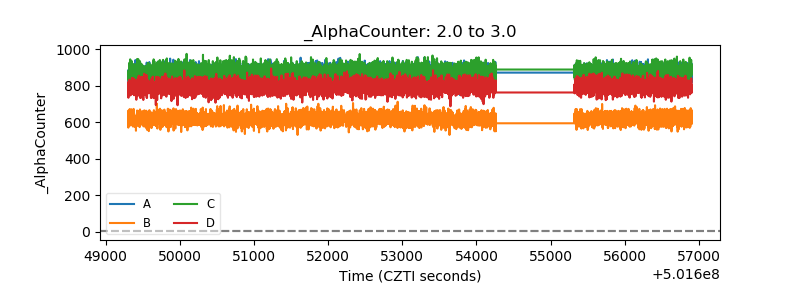 |
| _CPM_Rate | 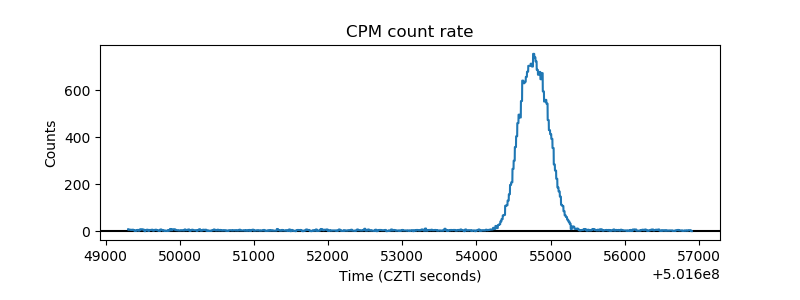 |
| CZT Counter | 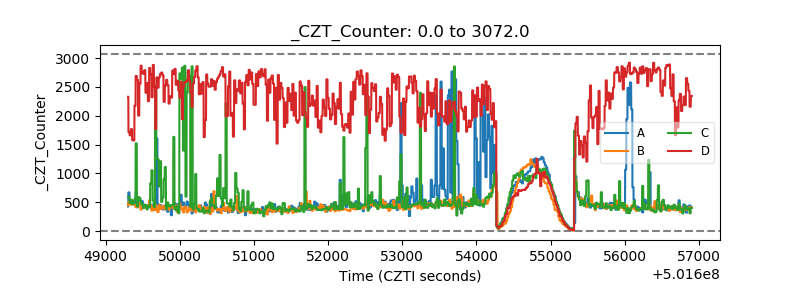 |
| +2.5 Volts monitor |  |
| +5 Volts monitor |  |
| _ROLL_ROT | 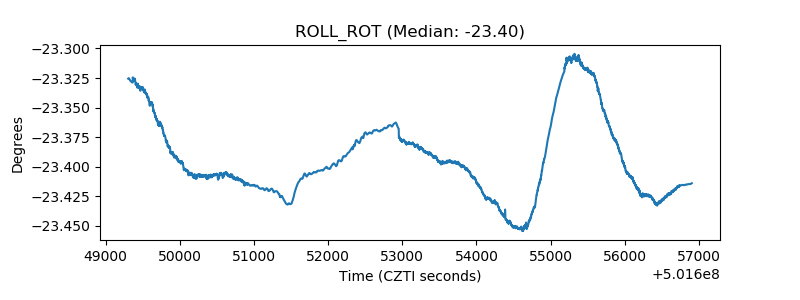 |
| _Roll_DEC | 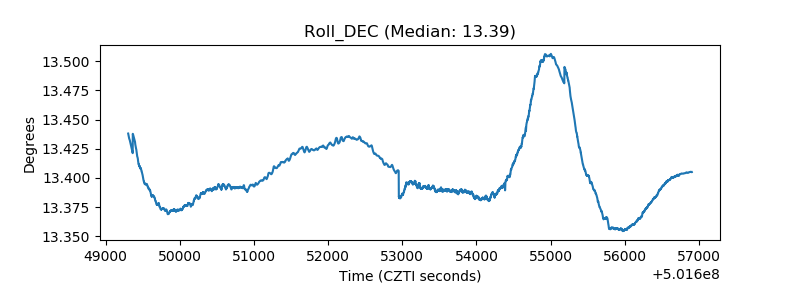 |
| _Roll_RA | 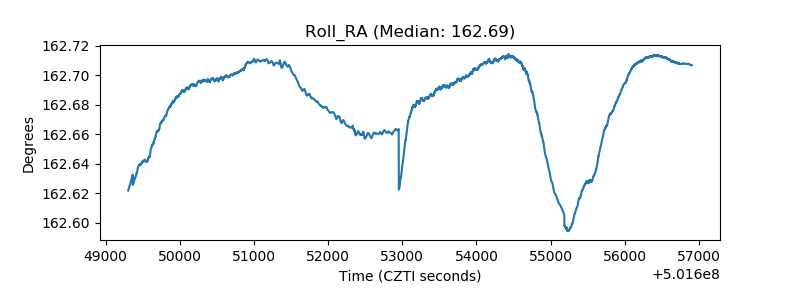 |
| Veto Counter | 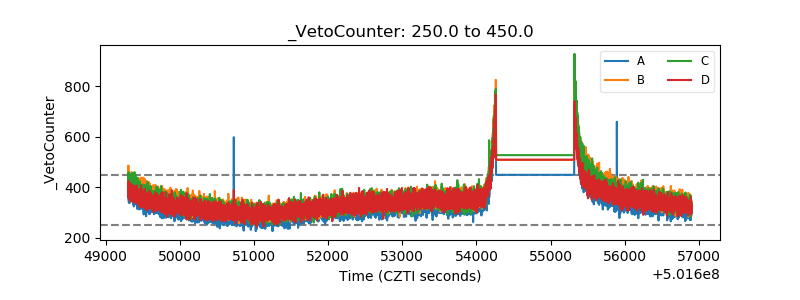 |