| Param | Original file | Final file |
|---|---|---|
| Filename | modeM0/AS1A14_014T01_9000006528_54951cztM0_level2.fits | modeM0/AS1A14_014T01_9000006528_54951cztM0_level2_quad_clean.evt |
| Size (bytes) | 663,287,040 | 71,703,360 |
| Size | 632.6 MB | 68.4 MB |
| Events in quadrant A | 3,994,112 | 543,043 |
| Events in quadrant B | 2,630,960 | 641,799 |
| Events in quadrant C | 3,191,477 | 557,886 |
| Events in quadrant D | 14,263,048 | 4,897 |
| Mode M0 | |||
|---|---|---|---|
| Quadrant | BADHDUFLAG | Total packets | Discarded packets |
| A | 0 | 16242 | 1 |
| B | 0 | 12492 | 1 |
| C | 0 | 14050 | 1 |
| D | 0 | 46540 | 1 |
| Mode SS | |||
|---|---|---|---|
| Quadrant | BADHDUFLAG | Total packets | Discarded packets |
| A | 0 | 124 | 0 |
| B | 0 | 124 | 0 |
| C | 0 | 124 | 0 |
| D | 0 | 124 | 0 |
| Mode M9 | |||
|---|---|---|---|
| Quadrant | BADHDUFLAG | Total packets | Discarded packets |
| A | 0 | 11 | 0 |
| B | 0 | 11 | 0 |
| C | 0 | 11 | 0 |
| D | 0 | 11 | 0 |
| Quadrant | Total seconds | Saturated seconds | Saturation percentage |
|---|---|---|---|
| A | 6061 | 499 | 8.232965% |
| B | 6061 | 66 | 1.088929% |
| C | 6061 | 137 | 2.260353% |
| D | 6062 | 6029 | 99.455625% |
Noise dominated data is calculated using 1-second bins in cleaned event files. If a bin has >2000 counts, and if more than 50% of those come from <1% of pixels, then it is considered to be noise-dominated and hence unusable.
| Quadrant | # 1 sec bins | Bins with >0 counts | Bins with >2000 counts | High rate bins dominated by noise | Noise dominated (total time) | Noise dominated (detector-on time) | Marked lightcurve |
|---|---|---|---|---|---|---|---|
| A | 7160 | 6061 | 445 | 445 | 6.22% | 7.34% | 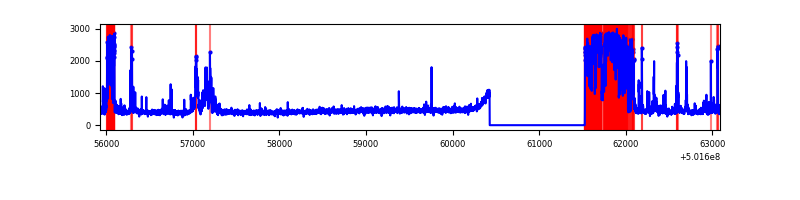 |
| B | 7160 | 6061 | 2 | 2 | 0.03% | 0.03% | 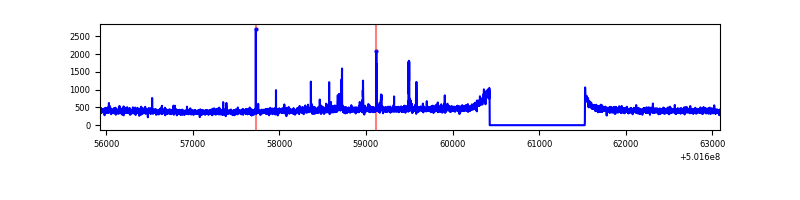 |
| C | 7160 | 6061 | 102 | 102 | 1.42% | 1.68% | 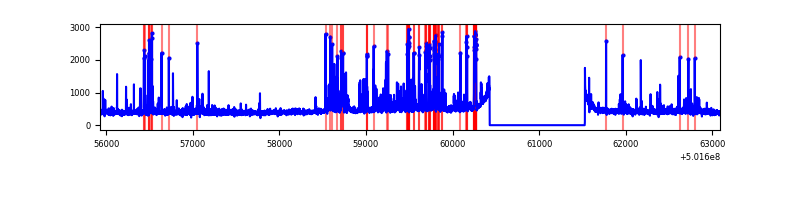 |
| D | 7161 | 6062 | 4985 | 4985 | 69.61% | 82.23% | 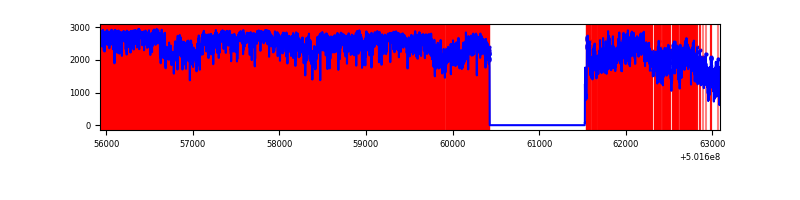 |
Top three noisy pixels from each quadrant. If the there are fewer than three noisy pixels in the level2.evt file, extra rows are filled as -1
| Pixel properties | Quadrant properties | ||||||
|---|---|---|---|---|---|---|---|
| Quadrant | DetID | PixID | Counts | Sigma | Mean | Median | Sigma |
| A | 15 | 32 | 1504813 | 9755.71 | 622 | 605 | 154.2 |
| A | 3 | 14 | 28030 | 177.87 | 622 | 605 | 154.2 |
| A | 0 | 8 | 25116 | 158.97 | 622 | 605 | 154.2 |
| B | 2 | 249 | 35392 | 248.65 | 647 | 625 | 139.8 |
| B | 7 | 252 | 25007 | 174.38 | 647 | 625 | 139.8 |
| B | 12 | 111 | 16660 | 114.68 | 647 | 625 | 139.8 |
| C | 4 | 5 | 250010 | 1416.43 | 632 | 626 | 176.1 |
| C | 14 | 254 | 166547 | 942.38 | 632 | 626 | 176.1 |
| C | 12 | 252 | 95476 | 538.72 | 632 | 626 | 176.1 |
| D | 15 | 94 | 12767809 | 324573.16 | 129 | 122 | 39.3 |
| D | 11 | 129 | 824902 | 20967.11 | 129 | 122 | 39.3 |
| D | 3 | 12 | 53547 | 1358.14 | 129 | 122 | 39.3 |
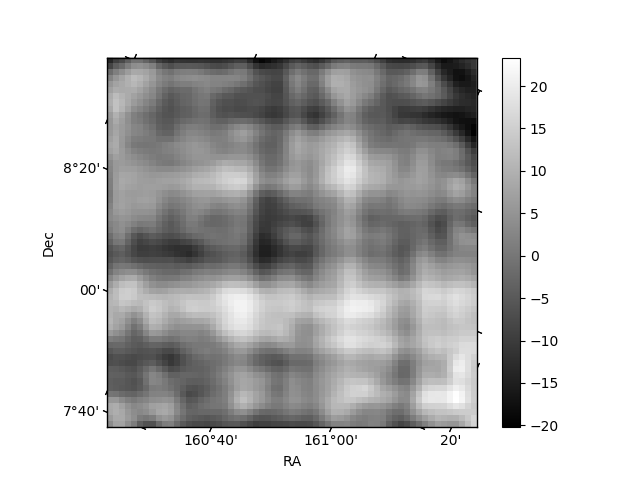
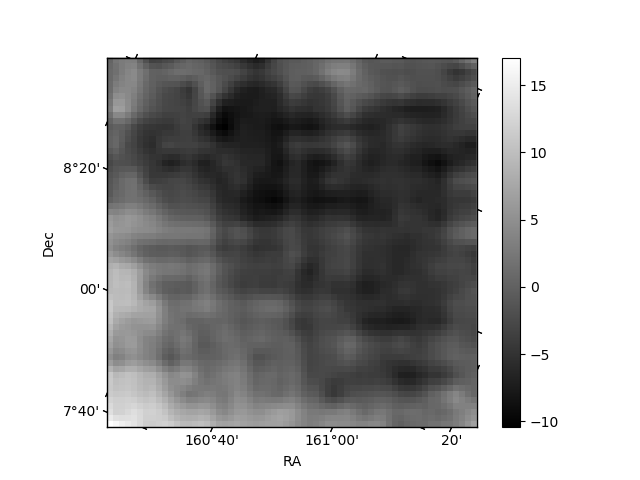
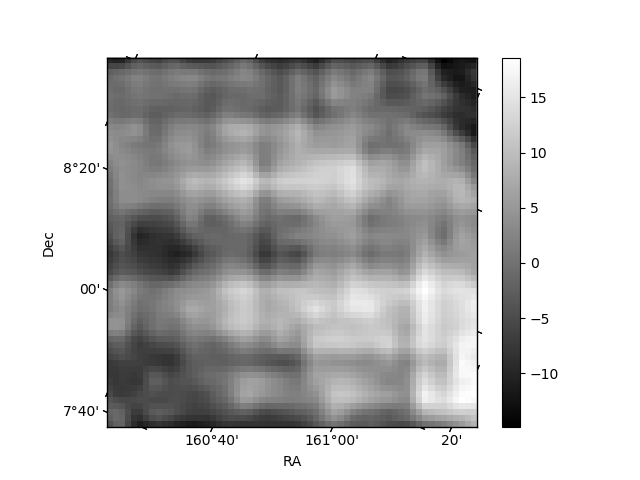
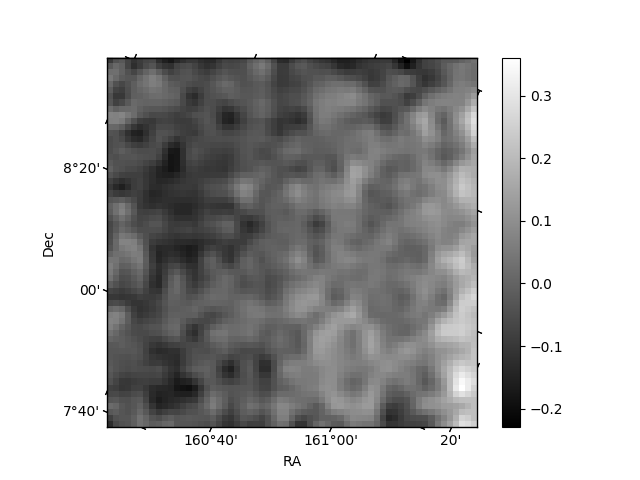
Histogram calculated using DETX and DETY for each event in the final _common_clean file
| Quadrant A | 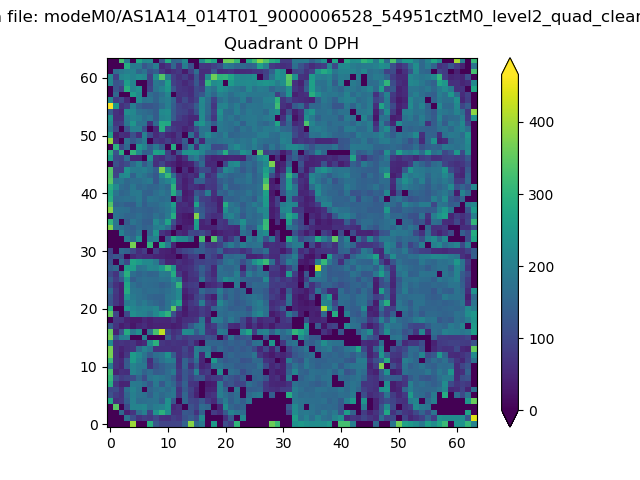 |
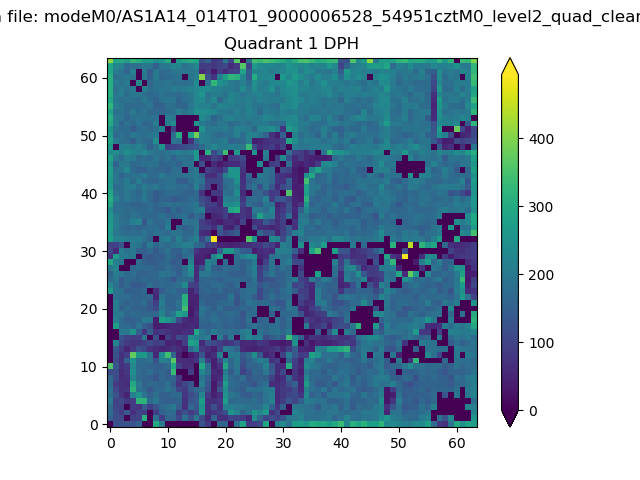 |
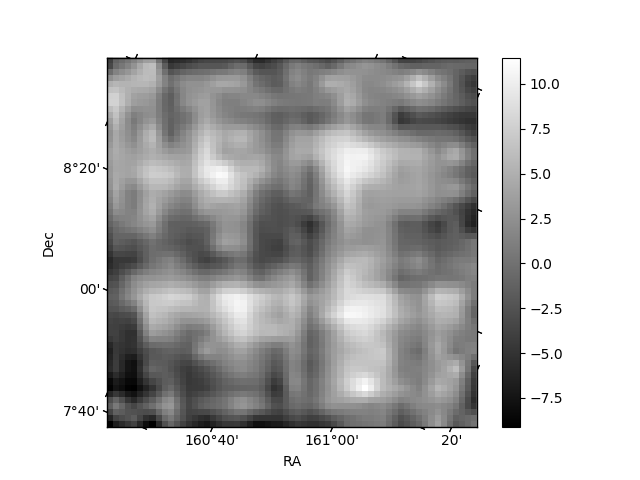
Quadrant B |
|---|---|---|---|
| Quadrant D | 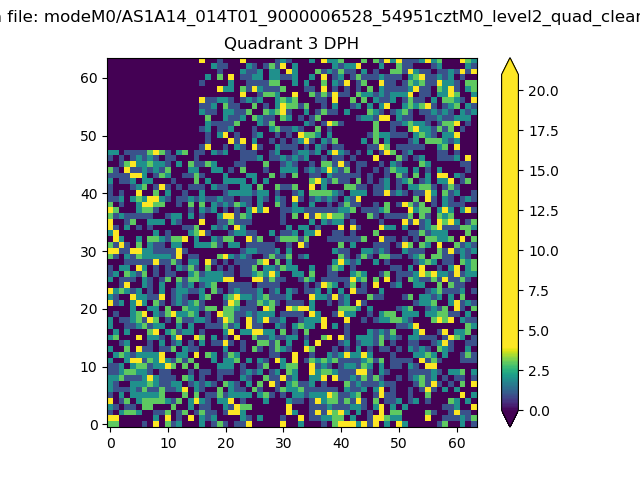 |
 |
Quadrant C |
| Plot type | Count rate plots | Images |
|---|---|---|
| Comparison with Poisson distribution Blue bars denote a histogram of data divided into 1 sec bins. Red curve is a Poisson curve with rate = median count rate of data. |
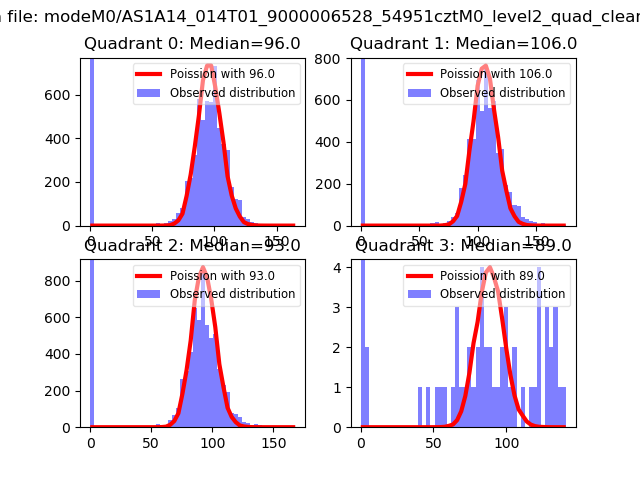 |
 |
| Quadrant-wise count rates Data is divided into 100 sec bins |
 |
|
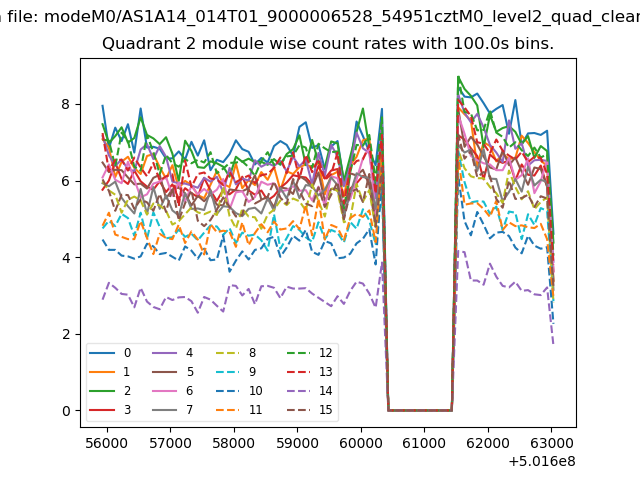
| Module-wise count rates for Quadrant A Data is divided into 100 sec bins |
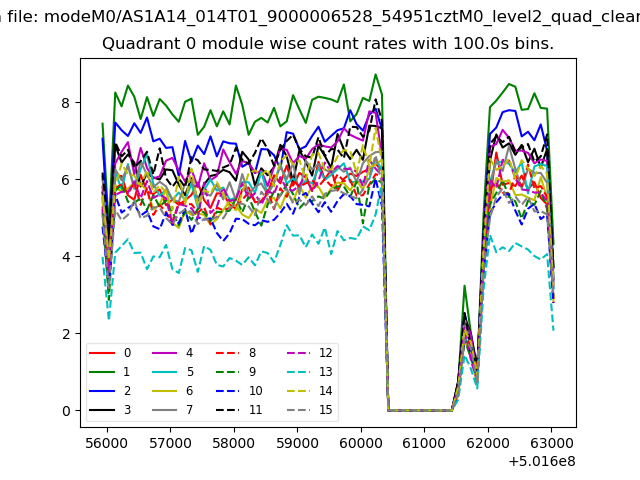 |
 |
| Module-wise count rates for Quadrant B Data is divided into 100 sec bins |
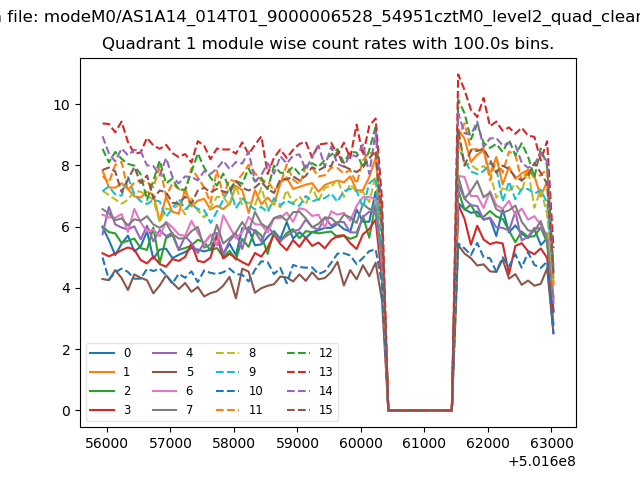 |
 |
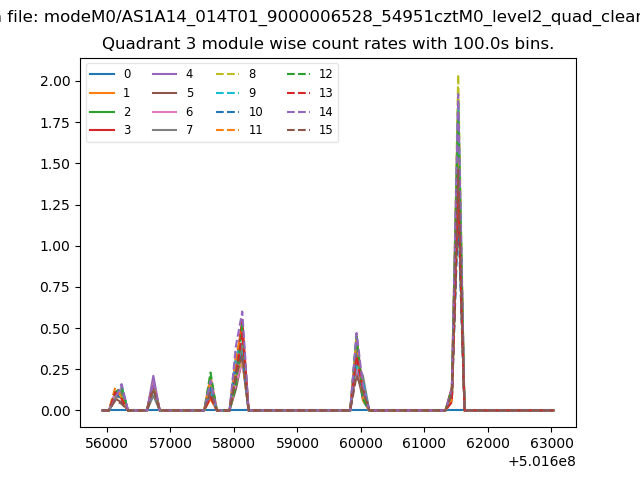
| Module-wise count rates for Quadrant C Data is divided into 100 sec bins |
 |
 |
| Module-wise count rates for Quadrant D Data is divided into 100 sec bins |
 |
 |
| Parameter | Plot |
|---|---|
| CZT HV Monitor | 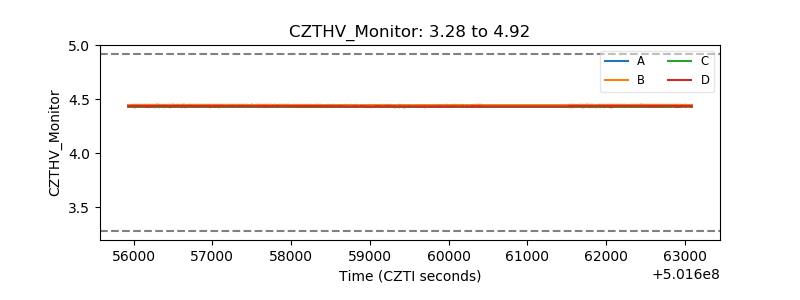 |
| D_VDD | 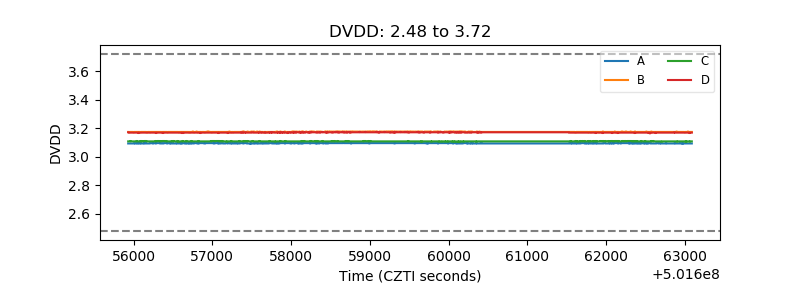 |
| Temperature 1 | 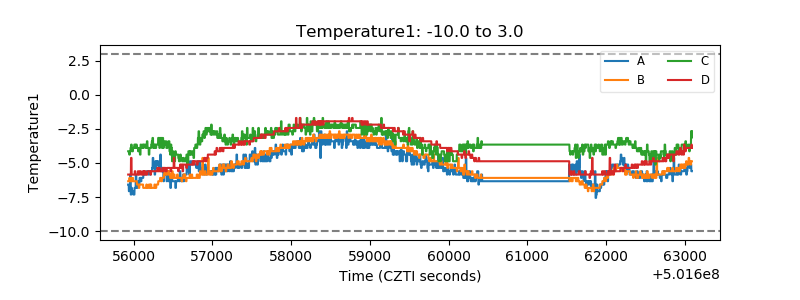 |
| Veto HV Monitor | 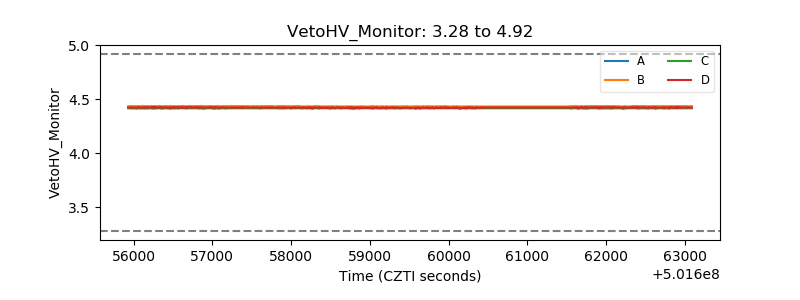 |
| Veto LLD | 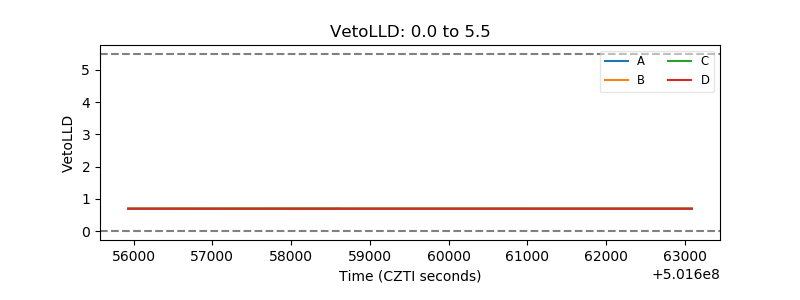 |
| Alpha Counter | 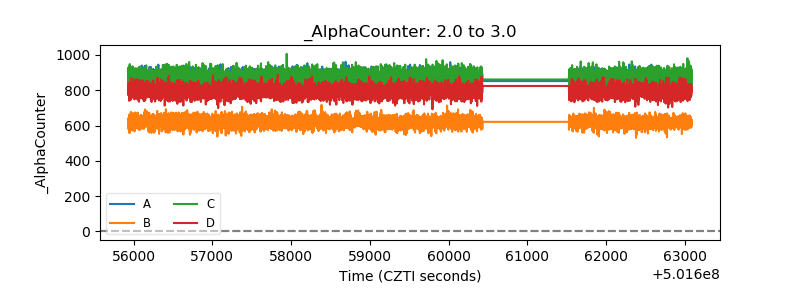 |
| _CPM_Rate | 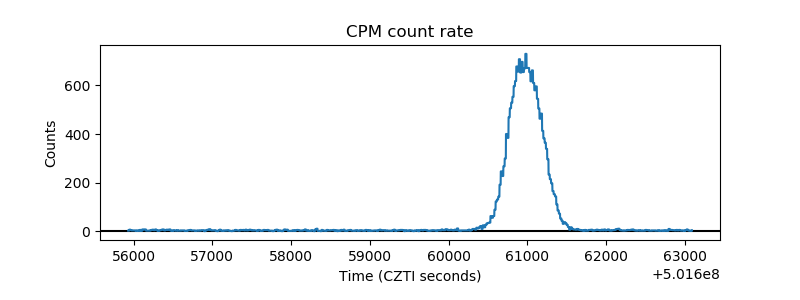 |
| CZT Counter | 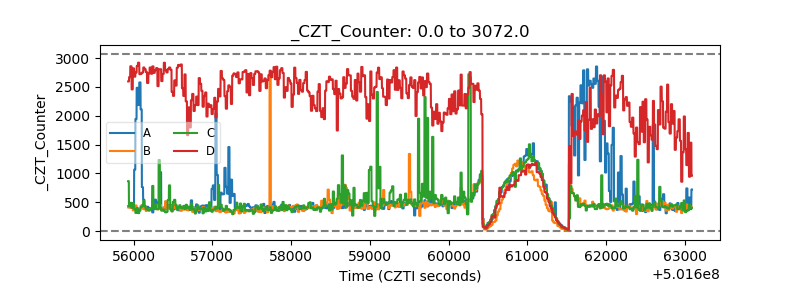 |
| +2.5 Volts monitor |  |
| +5 Volts monitor |  |
| _ROLL_ROT | 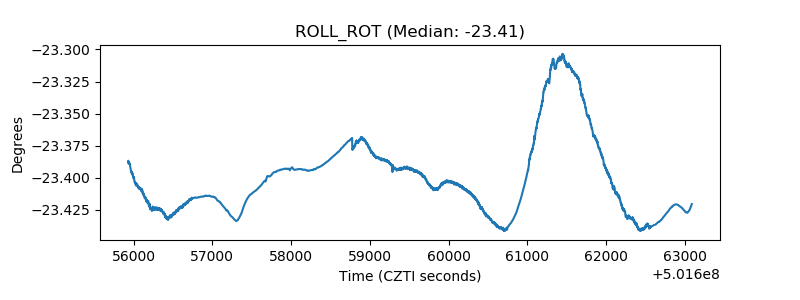 |
| _Roll_DEC | 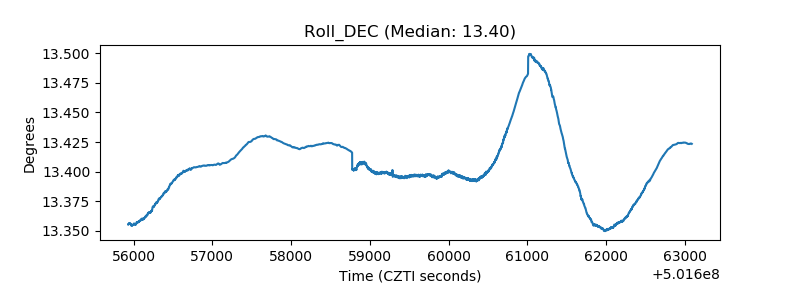 |
| _Roll_RA | 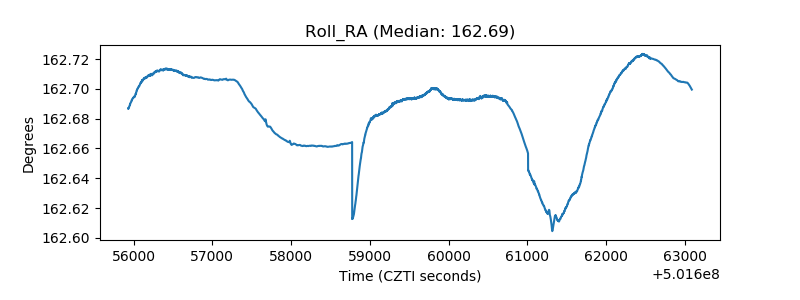 |
| Veto Counter | 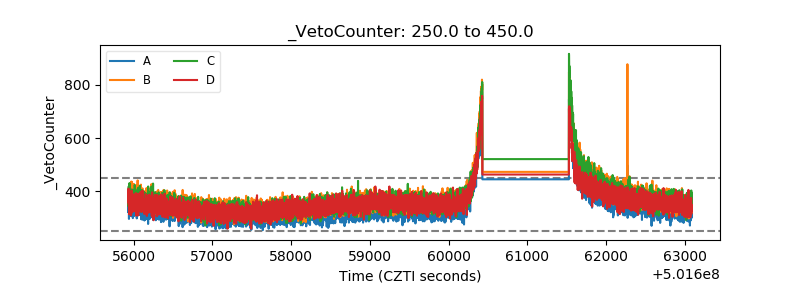 |