| Param | Original file | Final file |
|---|---|---|
| Filename | modeM0/AS1A14_014T01_9000006528_54952cztM0_level2.fits | modeM0/AS1A14_014T01_9000006528_54952cztM0_level2_quad_clean.evt |
| Size (bytes) | 681,819,840 | 78,433,920 |
| Size | 650.2 MB | 74.8 MB |
| Events in quadrant A | 4,454,899 | 594,074 |
| Events in quadrant B | 2,862,419 | 703,908 |
| Events in quadrant C | 3,270,265 | 615,925 |
| Events in quadrant D | 14,142,752 | 6,375 |
| Mode M0 | |||
|---|---|---|---|
| Quadrant | BADHDUFLAG | Total packets | Discarded packets |
| A | 0 | 17908 | 2 |
| B | 0 | 13388 | 2 |
| C | 0 | 14527 | 2 |
| D | 0 | 46468 | 2 |
| Mode SS | |||
|---|---|---|---|
| Quadrant | BADHDUFLAG | Total packets | Discarded packets |
| A | 0 | 134 | 0 |
| B | 0 | 134 | 0 |
| C | 0 | 134 | 0 |
| D | 0 | 134 | 0 |
| Mode M9 | |||
|---|---|---|---|
| Quadrant | BADHDUFLAG | Total packets | Discarded packets |
| A | 0 | 14 | 0 |
| B | 0 | 14 | 0 |
| C | 0 | 15 | 0 |
| D | 0 | 15 | 0 |
| Quadrant | Total seconds | Saturated seconds | Saturation percentage |
|---|---|---|---|
| A | 6513 | 559 | 8.582834% |
| B | 6513 | 54 | 0.829111% |
| C | 6513 | 101 | 1.550745% |
| D | 6513 | 6465 | 99.263012% |
Noise dominated data is calculated using 1-second bins in cleaned event files. If a bin has >2000 counts, and if more than 50% of those come from <1% of pixels, then it is considered to be noise-dominated and hence unusable.
| Quadrant | # 1 sec bins | Bins with >0 counts | Bins with >2000 counts | High rate bins dominated by noise | Noise dominated (total time) | Noise dominated (detector-on time) | Marked lightcurve |
|---|---|---|---|---|---|---|---|
| A | 7658 | 6514 | 465 | 465 | 6.07% | 7.14% | 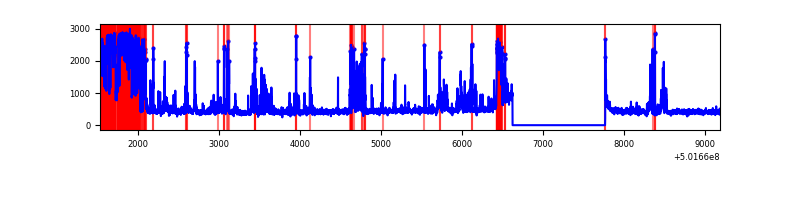 |
| B | 7658 | 6514 | 1 | 1 | 0.01% | 0.02% | 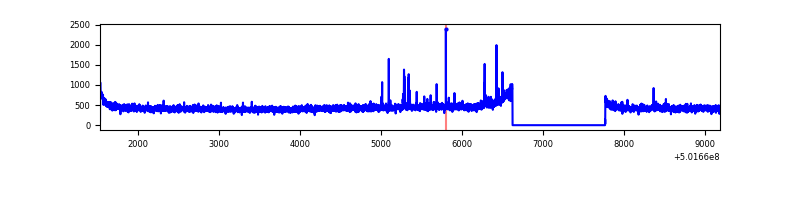 |
| C | 7658 | 6514 | 72 | 72 | 0.94% | 1.11% | 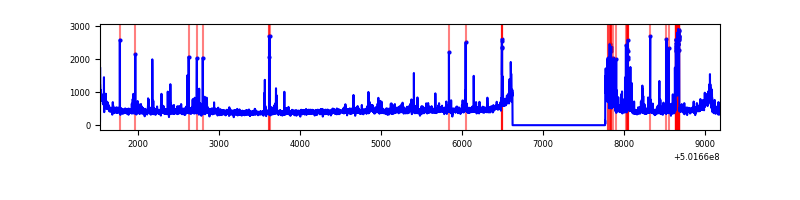 |
| D | 7658 | 6514 | 4636 | 4636 | 60.54% | 71.17% | 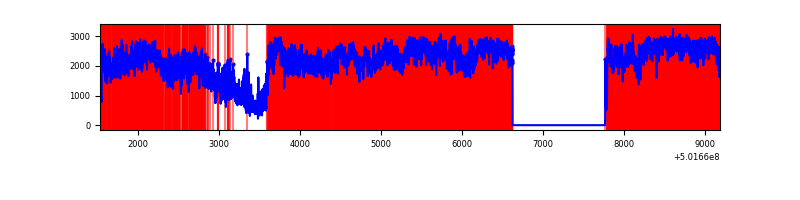 |
Top three noisy pixels from each quadrant. If the there are fewer than three noisy pixels in the level2.evt file, extra rows are filled as -1
| Pixel properties | Quadrant properties | ||||||
|---|---|---|---|---|---|---|---|
| Quadrant | DetID | PixID | Counts | Sigma | Mean | Median | Sigma |
| A | 15 | 32 | 1445724 | 8534.32 | 682 | 664 | 169.3 |
| A | 0 | 8 | 289429 | 1705.4 | 682 | 664 | 169.3 |
| A | 8 | 6 | 25135 | 144.52 | 682 | 664 | 169.3 |
| B | 10 | 247 | 24319 | 152.54 | 709 | 681 | 155.0 |
| B | 7 | 252 | 20606 | 128.58 | 709 | 681 | 155.0 |
| B | 12 | 111 | 17893 | 111.07 | 709 | 681 | 155.0 |
| C | 4 | 5 | 367822 | 1902.08 | 695 | 688 | 193.0 |
| C | 6 | 223 | 59034 | 302.28 | 695 | 688 | 193.0 |
| C | 12 | 250 | 32570 | 165.18 | 695 | 688 | 193.0 |
| D | 15 | 94 | 12226108 | 348967.08 | 118 | 113 | 35.0 |
| D | 11 | 129 | 1185121 | 33823.73 | 118 | 113 | 35.0 |
| D | 3 | 12 | 84673 | 2413.6 | 118 | 113 | 35.0 |
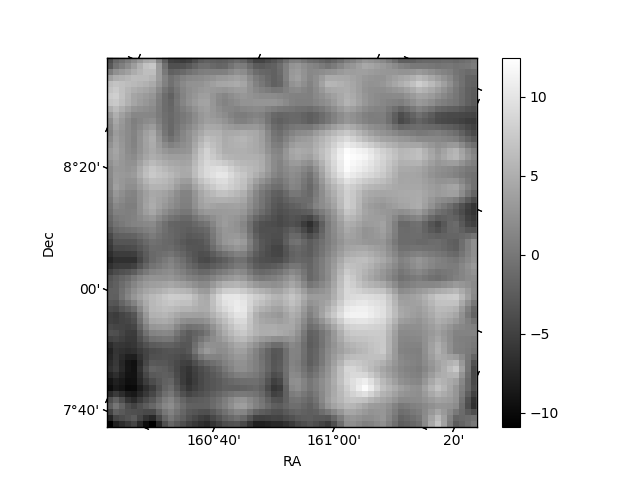
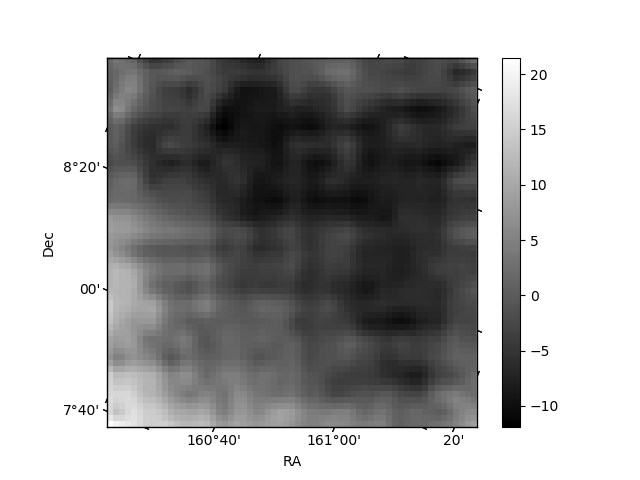
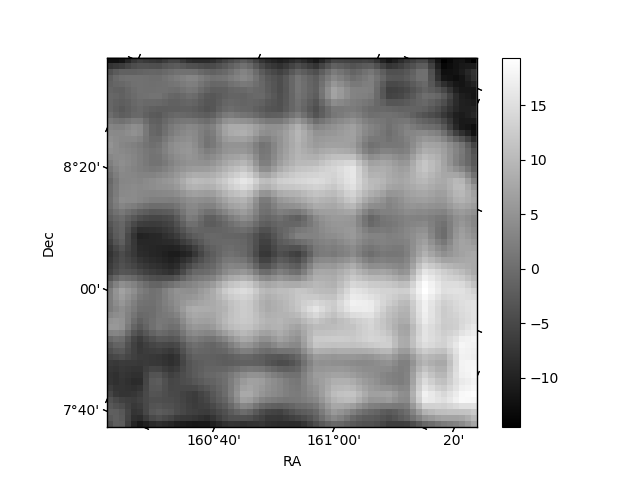
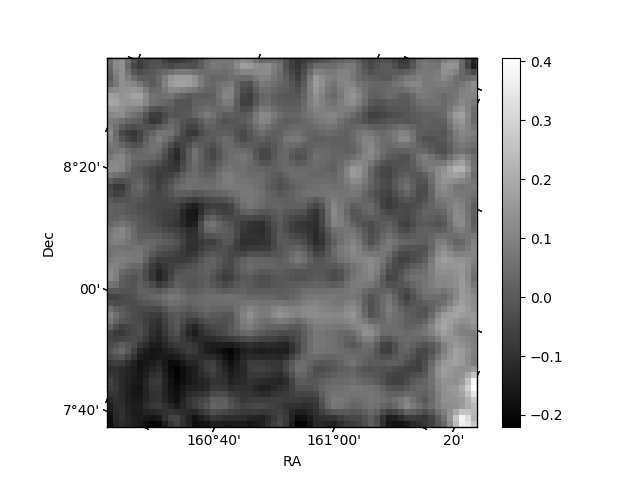
Histogram calculated using DETX and DETY for each event in the final _common_clean file
| Quadrant A | 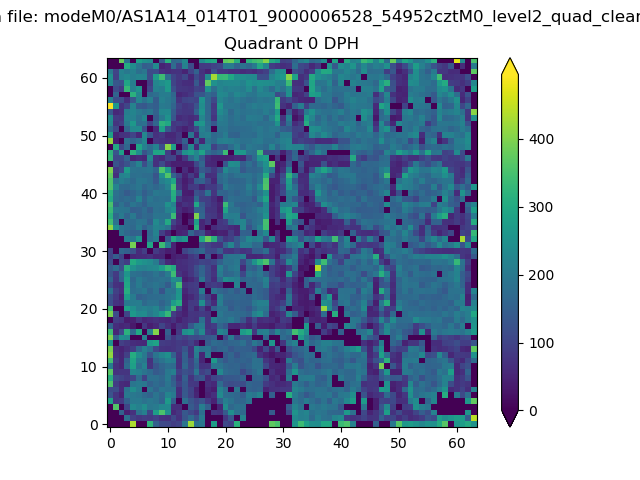 |
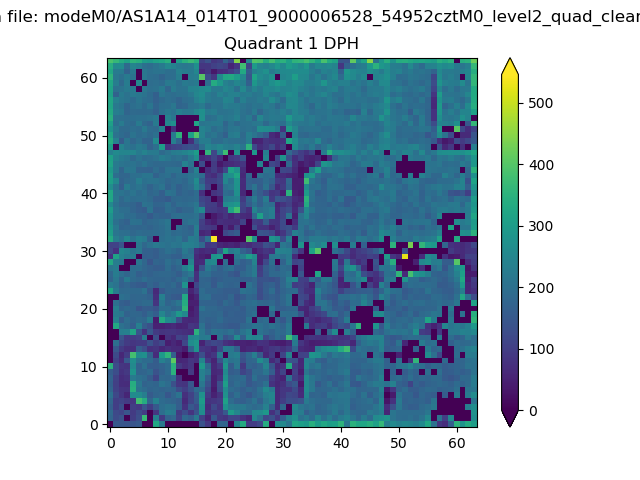 |
Quadrant B |
|---|---|---|---|
| Quadrant D | 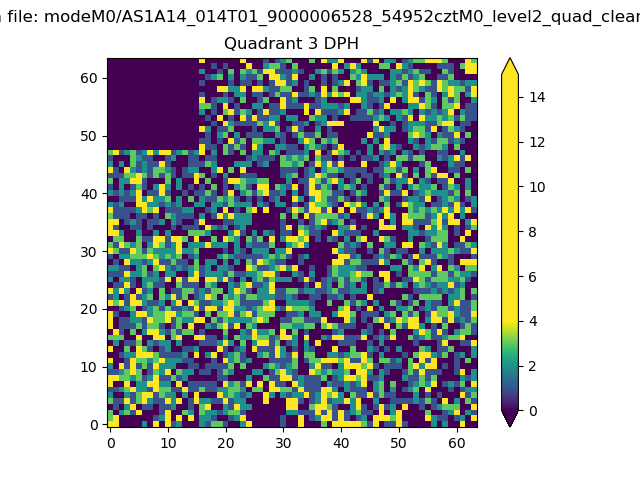 |
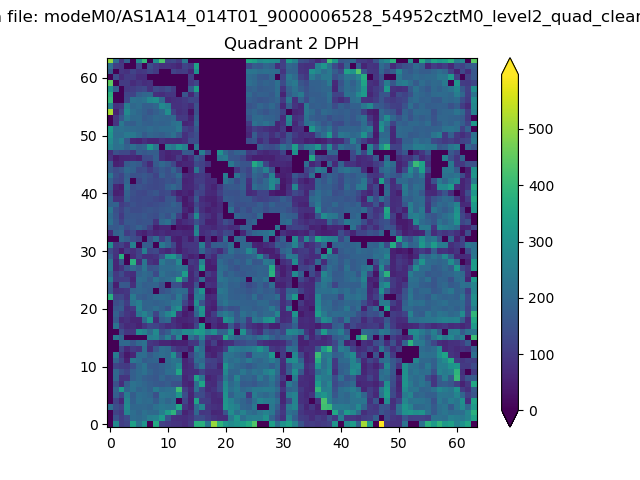 |
Quadrant C |
| Plot type | Count rate plots | Images |
|---|---|---|
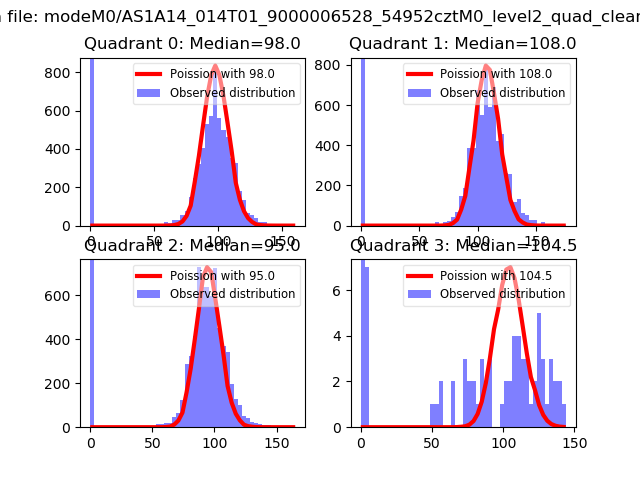
| Comparison with Poisson distribution Blue bars denote a histogram of data divided into 1 sec bins. Red curve is a Poisson curve with rate = median count rate of data. |
 |
 |
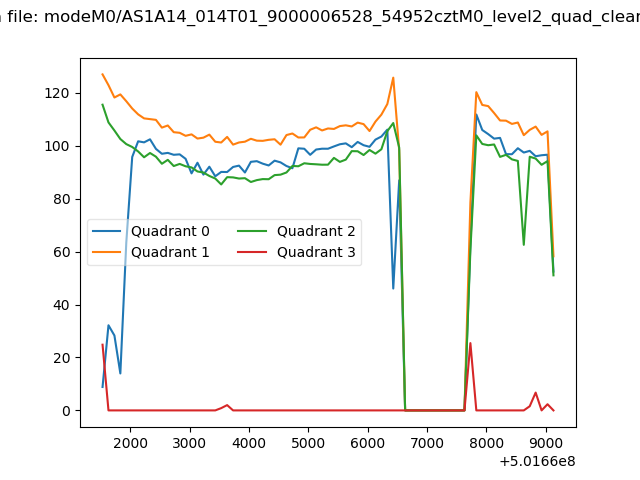
| Quadrant-wise count rates Data is divided into 100 sec bins |
 |
|
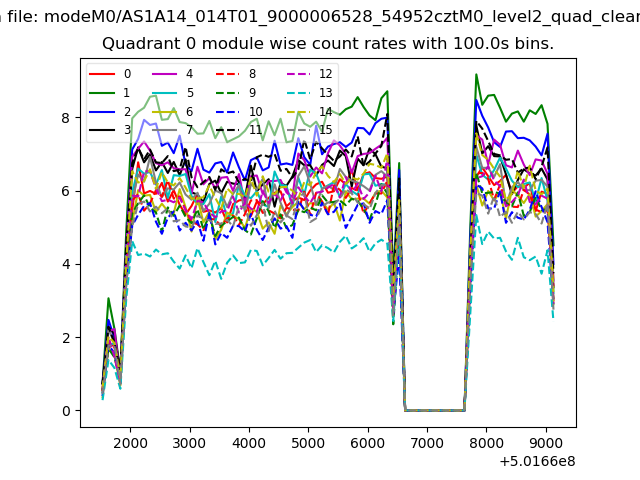
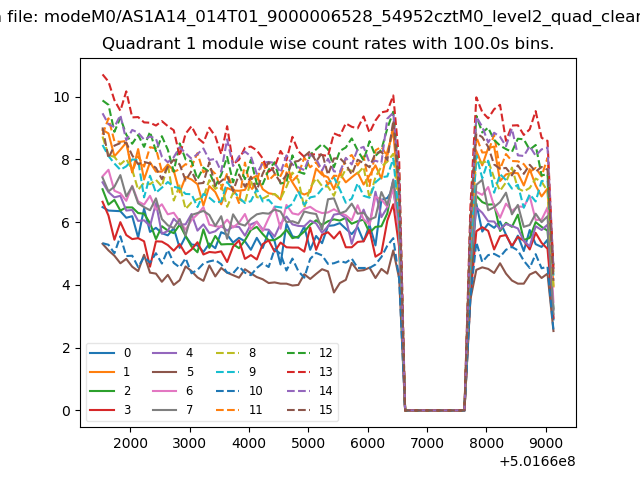
| Module-wise count rates for Quadrant A Data is divided into 100 sec bins |
 |
 |
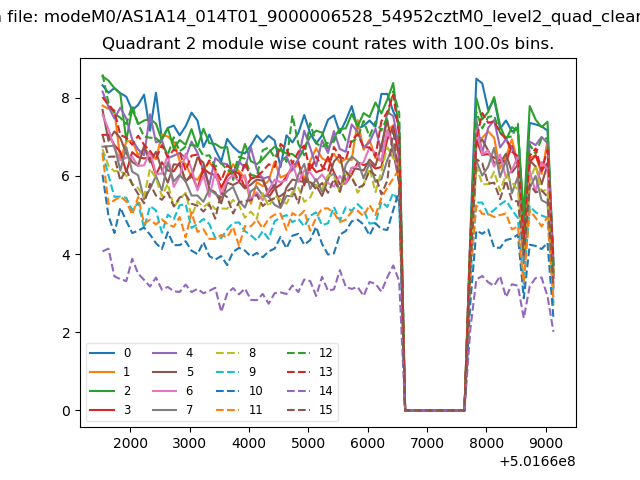
| Module-wise count rates for Quadrant B Data is divided into 100 sec bins |
 |
 |
| Module-wise count rates for Quadrant C Data is divided into 100 sec bins |
 |
 |
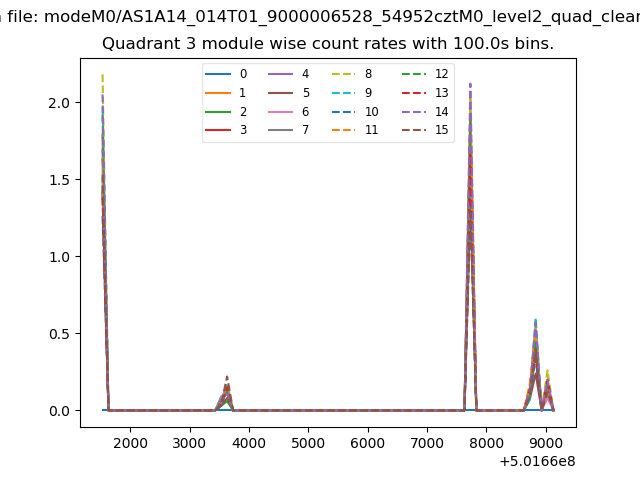
| Module-wise count rates for Quadrant D Data is divided into 100 sec bins |
 |
 |
| Parameter | Plot |
|---|---|
| CZT HV Monitor |  |
| D_VDD | 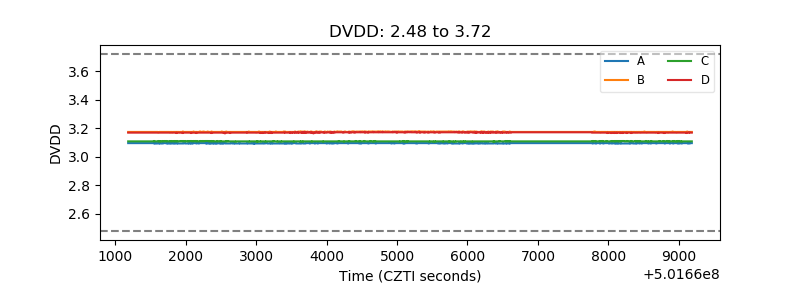 |
| Temperature 1 | 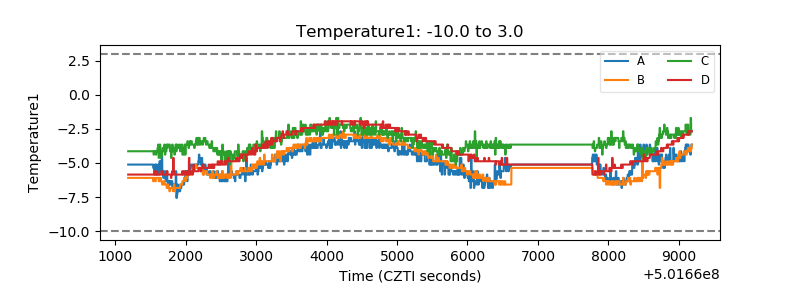 |
| Veto HV Monitor | 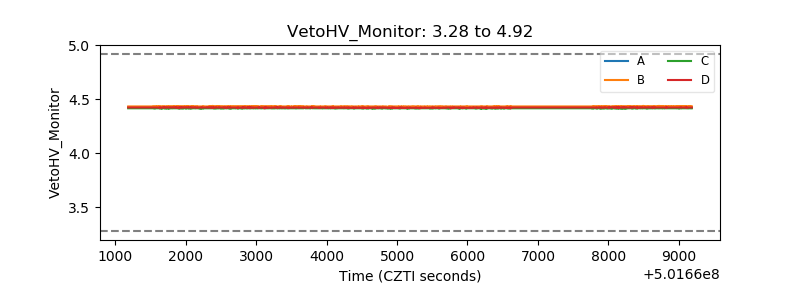 |
| Veto LLD | 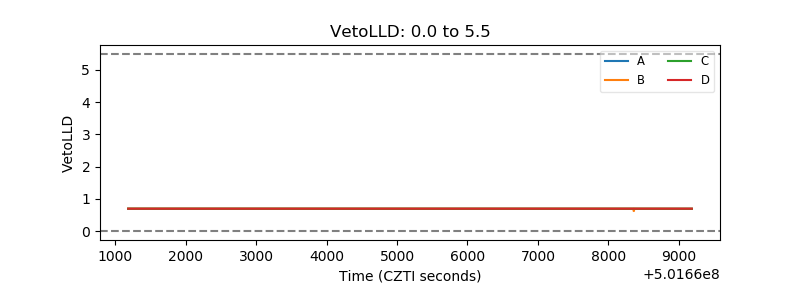 |
| Alpha Counter | 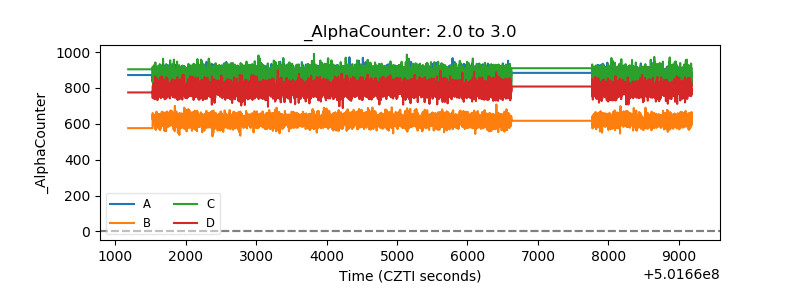 |
| _CPM_Rate | 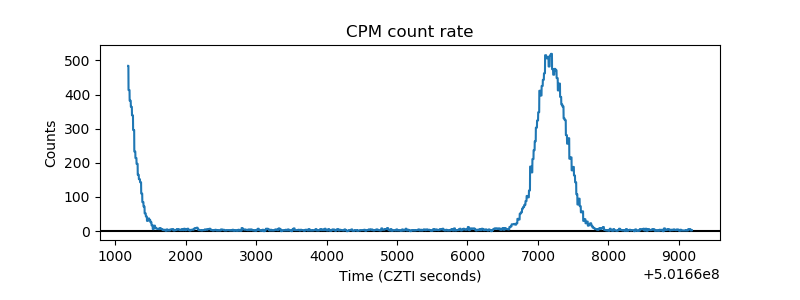 |
| CZT Counter | 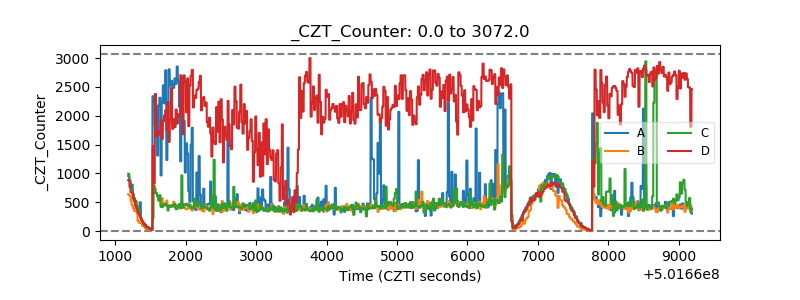 |
| +2.5 Volts monitor |  |
| +5 Volts monitor |  |
| _ROLL_ROT | 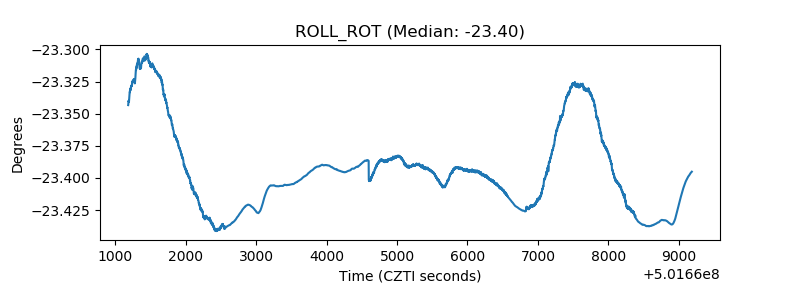 |
| _Roll_DEC | 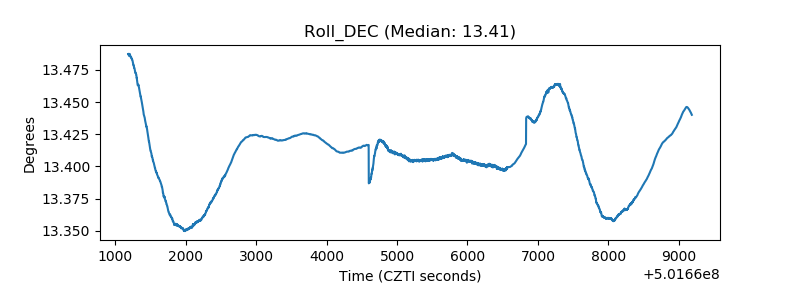 |
| _Roll_RA | 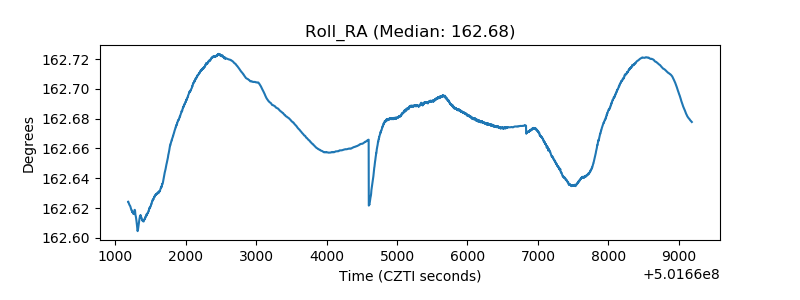 |
| Veto Counter | 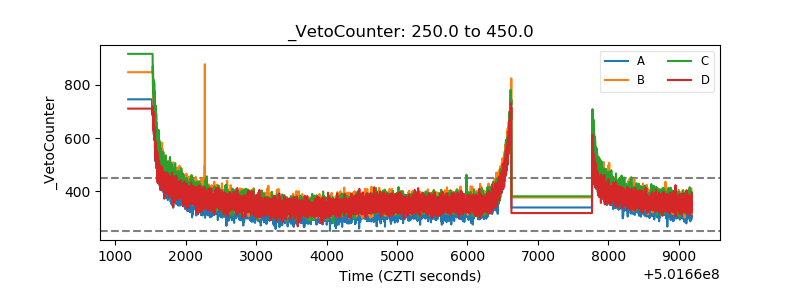 |