| Param | Original file | Final file |
|---|---|---|
| Filename | modeM0/AS1A14_014T01_9000006528_54953cztM0_level2.fits | modeM0/AS1A14_014T01_9000006528_54953cztM0_level2_quad_clean.evt |
| Size (bytes) | 648,892,800 | 76,841,280 |
| Size | 618.8 MB | 73.3 MB |
| Events in quadrant A | 3,449,081 | 579,097 |
| Events in quadrant B | 2,921,634 | 638,176 |
| Events in quadrant C | 3,074,342 | 565,578 |
| Events in quadrant D | 14,098,831 | 116,469 |
| Mode M0 | |||
|---|---|---|---|
| Quadrant | BADHDUFLAG | Total packets | Discarded packets |
| A | 0 | 14624 | 1 |
| B | 0 | 12974 | 1 |
| C | 0 | 13628 | 1 |
| D | 0 | 46155 | 1 |
| Mode SS | |||
|---|---|---|---|
| Quadrant | BADHDUFLAG | Total packets | Discarded packets |
| A | 0 | 126 | 0 |
| B | 0 | 126 | 0 |
| C | 0 | 126 | 0 |
| D | 0 | 126 | 0 |
| Mode M9 | |||
|---|---|---|---|
| Quadrant | BADHDUFLAG | Total packets | Discarded packets |
| A | 0 | 10 | 0 |
| B | 0 | 10 | 0 |
| C | 0 | 10 | 0 |
| D | 0 | 10 | 0 |
| Quadrant | Total seconds | Saturated seconds | Saturation percentage |
|---|---|---|---|
| A | 6115 | 191 | 3.123467% |
| B | 6115 | 60 | 0.981194% |
| C | 6116 | 71 | 1.160889% |
| D | 6116 | 4865 | 79.545455% |
Noise dominated data is calculated using 1-second bins in cleaned event files. If a bin has >2000 counts, and if more than 50% of those come from <1% of pixels, then it is considered to be noise-dominated and hence unusable.
| Quadrant | # 1 sec bins | Bins with >0 counts | Bins with >2000 counts | High rate bins dominated by noise | Noise dominated (total time) | Noise dominated (detector-on time) | Marked lightcurve |
|---|---|---|---|---|---|---|---|
| A | 7195 | 6116 | 150 | 150 | 2.08% | 2.45% | 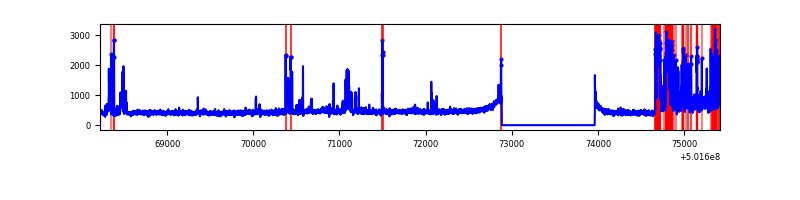 |
| B | 7195 | 6116 | 10 | 10 | 0.14% | 0.16% | 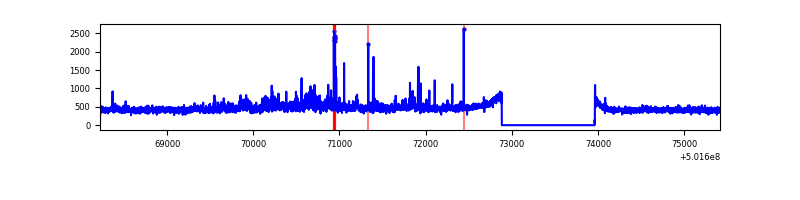 |
| C | 7196 | 6117 | 62 | 62 | 0.86% | 1.01% | 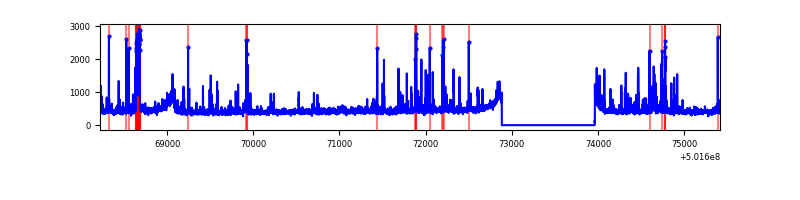 |
| D | 7196 | 6117 | 4810 | 4810 | 66.84% | 78.63% | 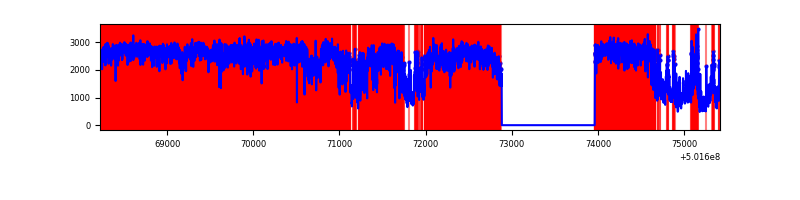 |
Top three noisy pixels from each quadrant. If the there are fewer than three noisy pixels in the level2.evt file, extra rows are filled as -1
| Pixel properties | Quadrant properties | ||||||
|---|---|---|---|---|---|---|---|
| Quadrant | DetID | PixID | Counts | Sigma | Mean | Median | Sigma |
| A | 15 | 32 | 636399 | 3902.97 | 659 | 642 | 162.9 |
| A | 0 | 8 | 149389 | 913.17 | 659 | 642 | 162.9 |
| A | 4 | 3 | 49920 | 302.52 | 659 | 642 | 162.9 |
| B | 4 | 81 | 234055 | 1641.95 | 654 | 631 | 142.2 |
| B | 0 | 182 | 48616 | 337.54 | 654 | 631 | 142.2 |
| B | 7 | 252 | 28309 | 194.69 | 654 | 631 | 142.2 |
| C | 4 | 5 | 306659 | 1728.0 | 644 | 638 | 177.1 |
| C | 14 | 254 | 84243 | 472.09 | 644 | 638 | 177.1 |
| C | 12 | 252 | 70315 | 393.44 | 644 | 638 | 177.1 |
| D | 15 | 94 | 11360834 | 134243.87 | 290 | 277 | 84.6 |
| D | 2 | 249 | 600420 | 7091.69 | 290 | 277 | 84.6 |
| D | 11 | 129 | 465806 | 5501.0 | 290 | 277 | 84.6 |
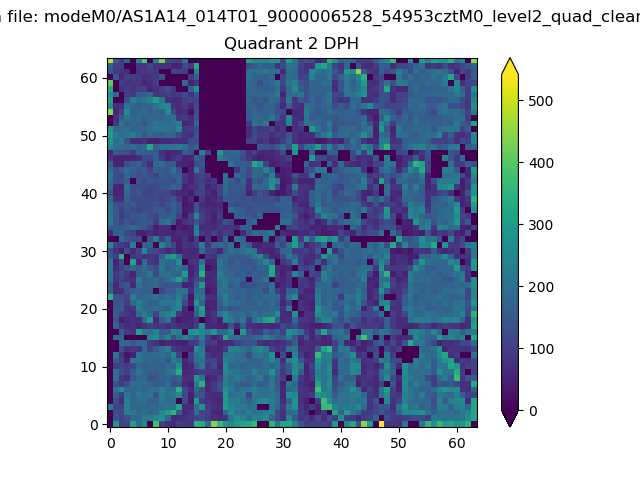
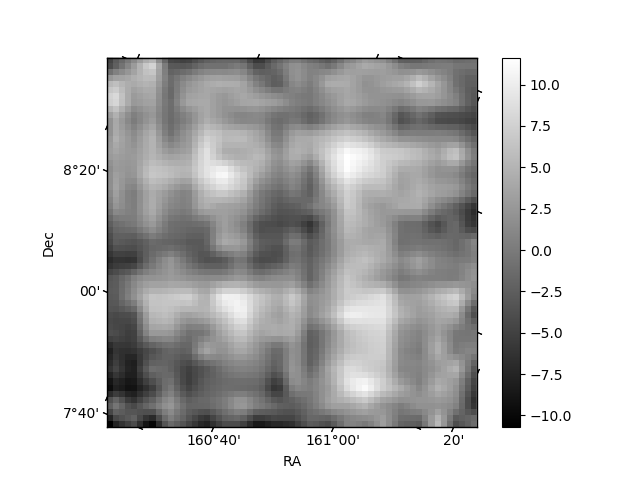
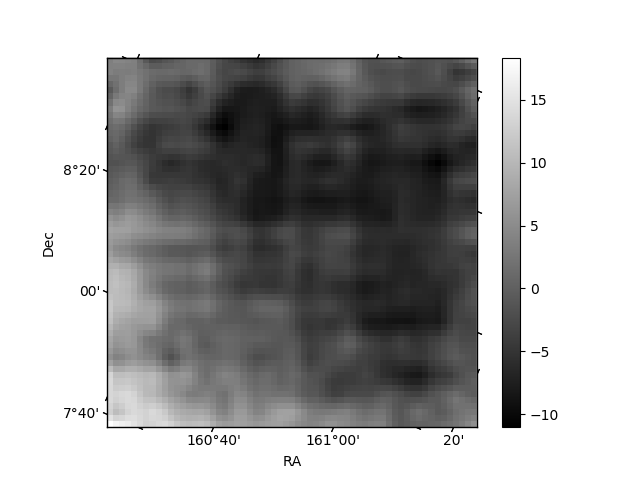
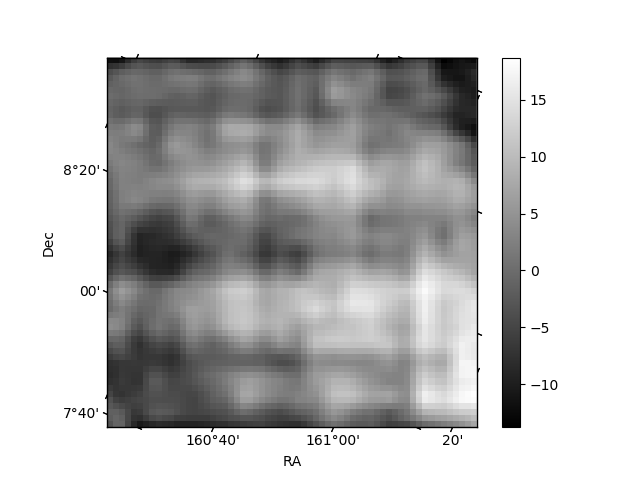
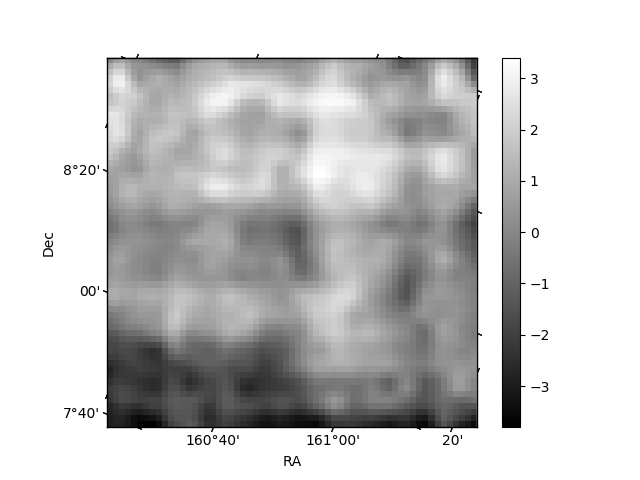
Histogram calculated using DETX and DETY for each event in the final _common_clean file
| Quadrant A | 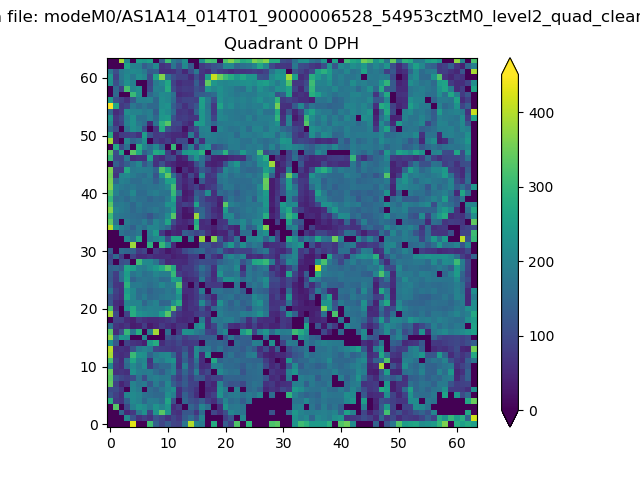 |
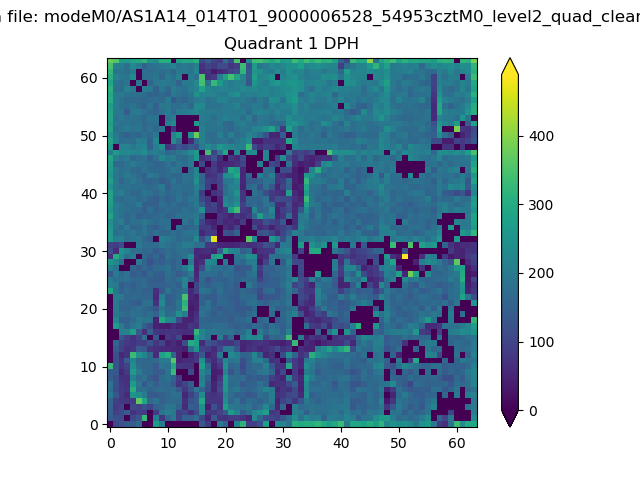 |
Quadrant B |
|---|---|---|---|
| Quadrant D | 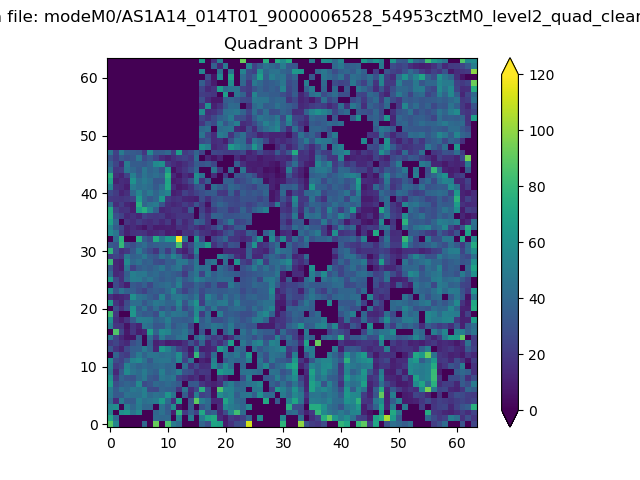 |
 |
Quadrant C |
| Plot type | Count rate plots | Images |
|---|---|---|
| Comparison with Poisson distribution Blue bars denote a histogram of data divided into 1 sec bins. Red curve is a Poisson curve with rate = median count rate of data. |
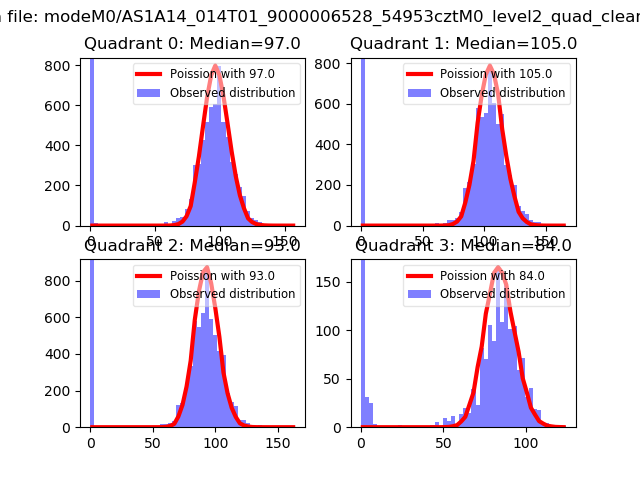 |
 |
| Quadrant-wise count rates Data is divided into 100 sec bins |
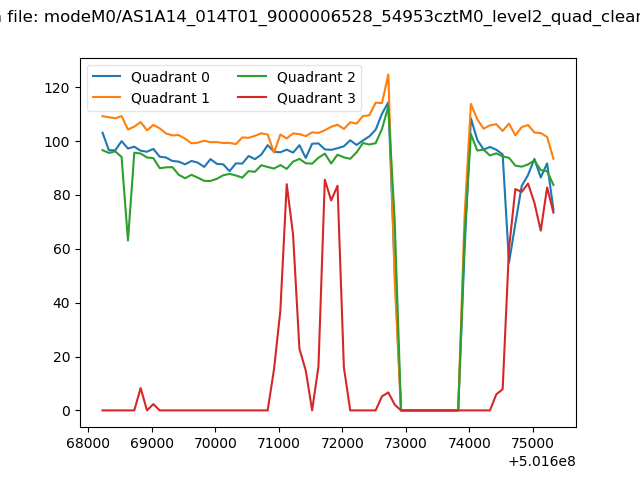 |
|
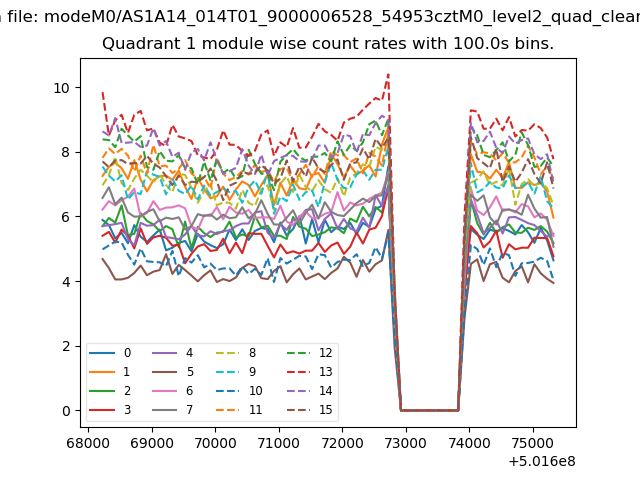
| Module-wise count rates for Quadrant A Data is divided into 100 sec bins |
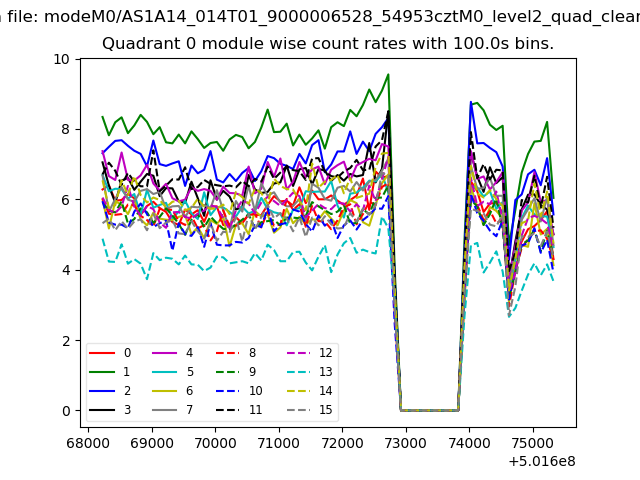 |
 |
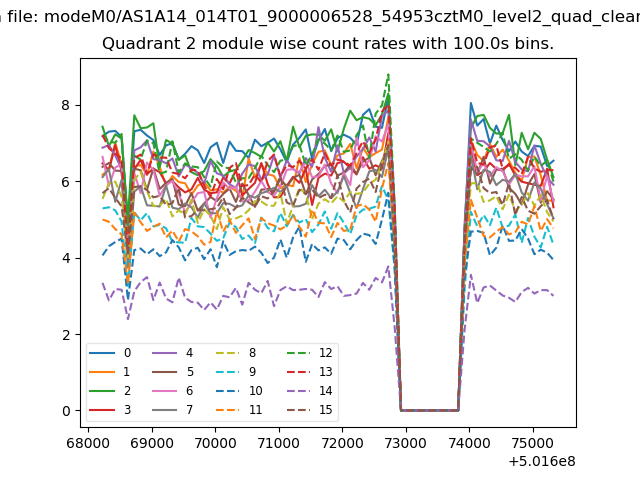
| Module-wise count rates for Quadrant B Data is divided into 100 sec bins |
 |
 |
| Module-wise count rates for Quadrant C Data is divided into 100 sec bins |
 |
 |
| Module-wise count rates for Quadrant D Data is divided into 100 sec bins |
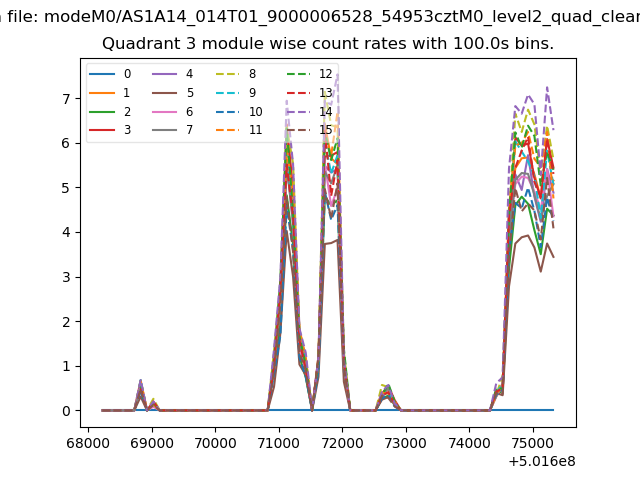 |
 |
| Parameter | Plot |
|---|---|
| CZT HV Monitor | 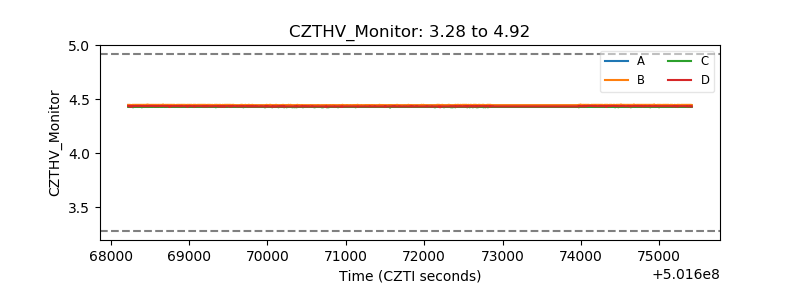 |
| D_VDD | 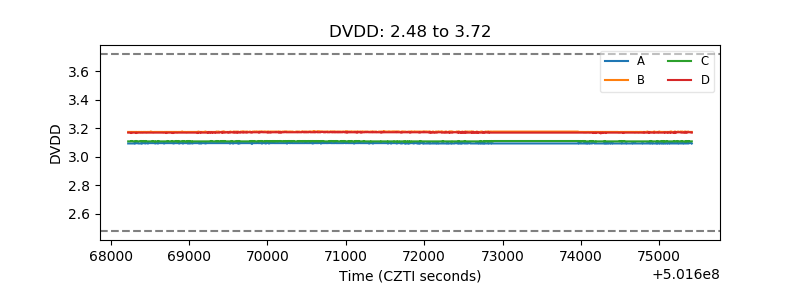 |
| Temperature 1 |  |
| Veto HV Monitor |  |
| Veto LLD | 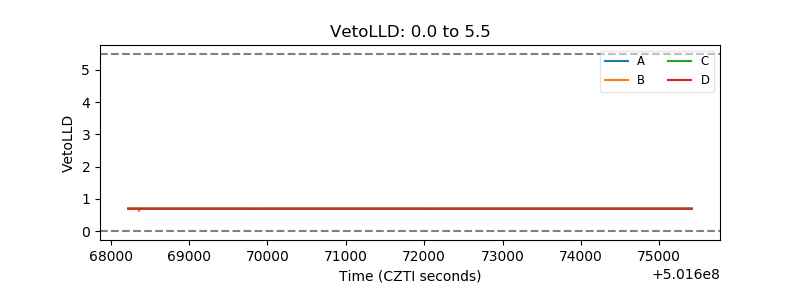 |
| Alpha Counter | 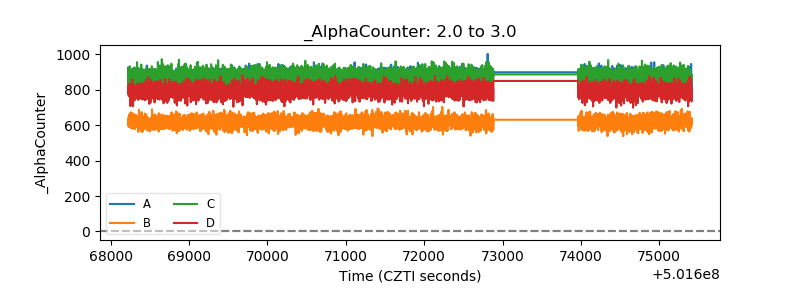 |
| _CPM_Rate |  |
| CZT Counter |  |
| +2.5 Volts monitor |  |
| +5 Volts monitor |  |
| _ROLL_ROT | 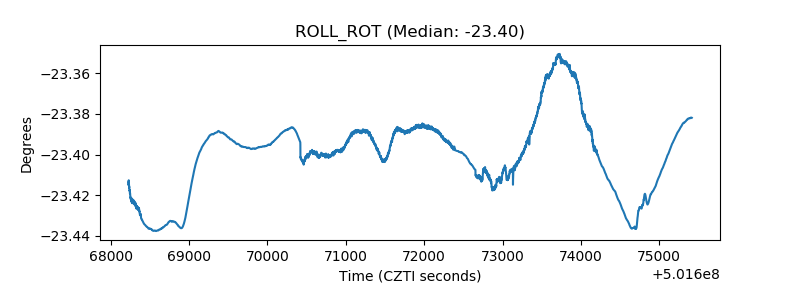 |
| _Roll_DEC | 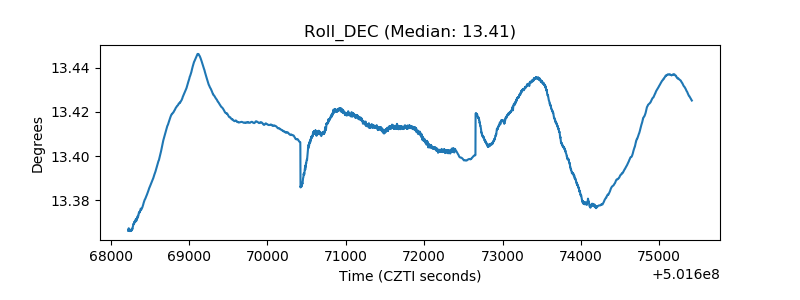 |
| _Roll_RA |  |
| Veto Counter | 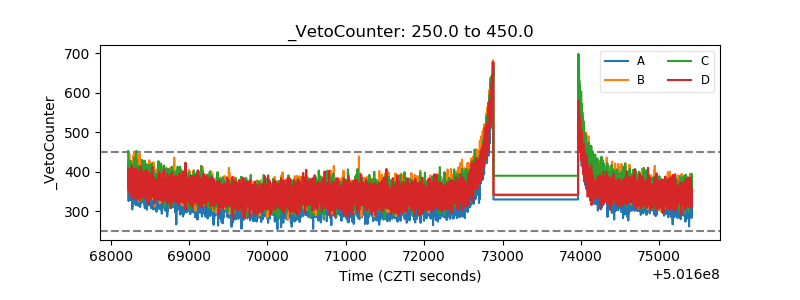 |