| Param | Original file | Final file |
|---|---|---|
| Filename | modeM0/AS1A14_014T01_9000006528_54954cztM0_level2.fits | modeM0/AS1A14_014T01_9000006528_54954cztM0_level2_quad_clean.evt |
| Size (bytes) | 634,138,560 | 76,216,320 |
| Size | 604.8 MB | 72.7 MB |
| Events in quadrant A | 4,856,452 | 514,510 |
| Events in quadrant B | 2,732,432 | 615,140 |
| Events in quadrant C | 2,849,938 | 546,798 |
| Events in quadrant D | 12,561,298 | 205,920 |
| Mode M0 | |||
|---|---|---|---|
| Quadrant | BADHDUFLAG | Total packets | Discarded packets |
| A | 0 | 18696 | 1 |
| B | 0 | 12678 | 1 |
| C | 0 | 12991 | 1 |
| D | 0 | 41549 | 1 |
| Mode SS | |||
|---|---|---|---|
| Quadrant | BADHDUFLAG | Total packets | Discarded packets |
| A | 0 | 124 | 0 |
| B | 0 | 124 | 0 |
| C | 0 | 124 | 0 |
| D | 0 | 124 | 0 |
| Mode M9 | |||
|---|---|---|---|
| Quadrant | BADHDUFLAG | Total packets | Discarded packets |
| A | 0 | 8 | 0 |
| B | 0 | 8 | 0 |
| C | 0 | 8 | 0 |
| D | 0 | 8 | 0 |
| Quadrant | Total seconds | Saturated seconds | Saturation percentage |
|---|---|---|---|
| A | 6090 | 725 | 11.904762% |
| B | 6090 | 134 | 2.200328% |
| C | 6091 | 113 | 1.855196% |
| D | 6091 | 3803 | 62.436382% |
Noise dominated data is calculated using 1-second bins in cleaned event files. If a bin has >2000 counts, and if more than 50% of those come from <1% of pixels, then it is considered to be noise-dominated and hence unusable.
| Quadrant | # 1 sec bins | Bins with >0 counts | Bins with >2000 counts | High rate bins dominated by noise | Noise dominated (total time) | Noise dominated (detector-on time) | Marked lightcurve |
|---|---|---|---|---|---|---|---|
| A | 6905 | 6091 | 594 | 594 | 8.60% | 9.75% | 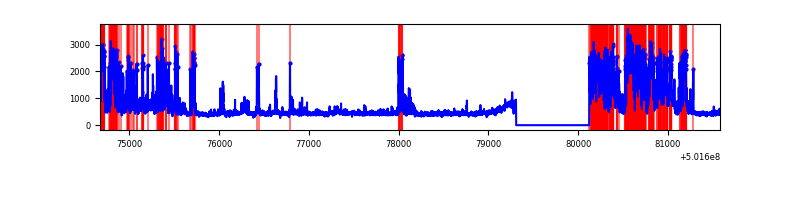 |
| B | 6905 | 6091 | 8 | 8 | 0.12% | 0.13% | 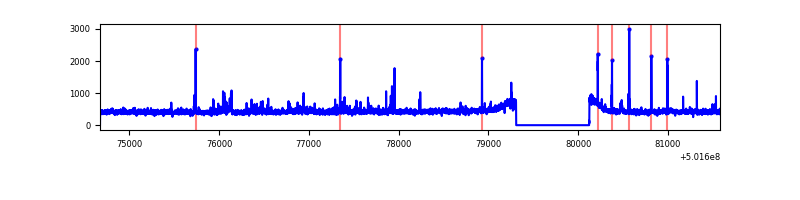 |
| C | 6906 | 6092 | 29 | 29 | 0.42% | 0.48% | 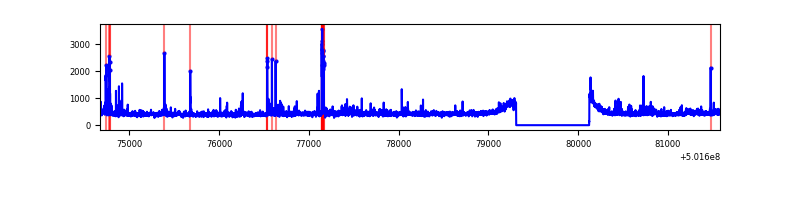 |
| D | 6906 | 6092 | 3726 | 3726 | 53.95% | 61.16% | 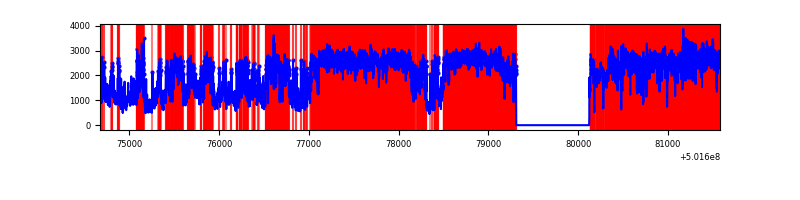 |
Top three noisy pixels from each quadrant. If the there are fewer than three noisy pixels in the level2.evt file, extra rows are filled as -1
| Pixel properties | Quadrant properties | ||||||
|---|---|---|---|---|---|---|---|
| Quadrant | DetID | PixID | Counts | Sigma | Mean | Median | Sigma |
| A | 15 | 32 | 1982000 | 12774.4 | 634 | 616 | 155.1 |
| A | 0 | 8 | 256946 | 1652.61 | 634 | 616 | 155.1 |
| A | 3 | 14 | 70979 | 453.64 | 634 | 616 | 155.1 |
| B | 2 | 249 | 43799 | 306.7 | 655 | 629 | 140.8 |
| B | 5 | 185 | 25377 | 175.82 | 655 | 629 | 140.8 |
| B | 0 | 182 | 19479 | 133.92 | 655 | 629 | 140.8 |
| C | 14 | 254 | 71226 | 398.44 | 649 | 643 | 177.2 |
| C | 6 | 223 | 65064 | 363.65 | 649 | 643 | 177.2 |
| C | 12 | 252 | 60477 | 337.76 | 649 | 643 | 177.2 |
| D | 15 | 94 | 9583914 | 86109.72 | 387 | 370 | 111.3 |
| D | 2 | 249 | 542851 | 4874.28 | 387 | 370 | 111.3 |
| D | 11 | 129 | 160713 | 1440.71 | 387 | 370 | 111.3 |
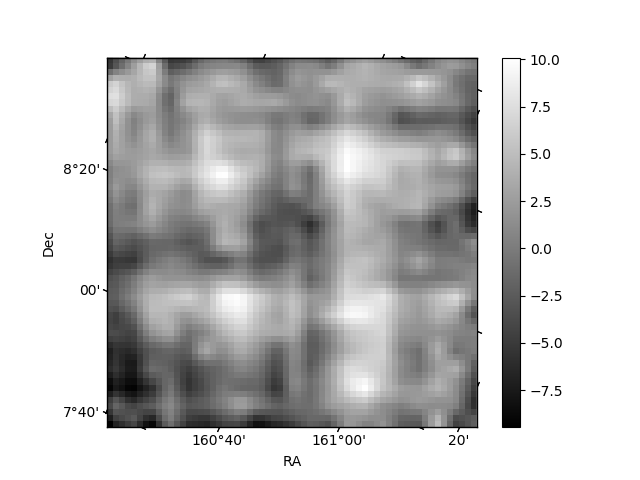
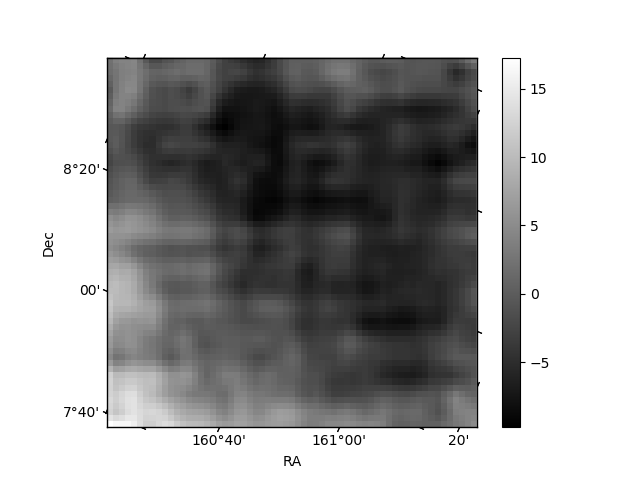
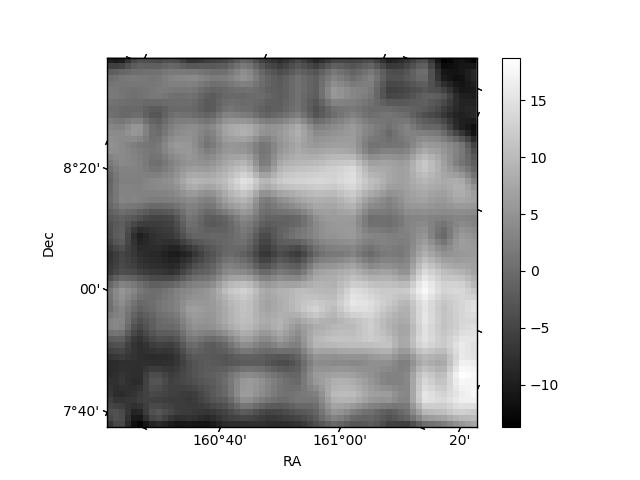
Histogram calculated using DETX and DETY for each event in the final _common_clean file
| Quadrant A | 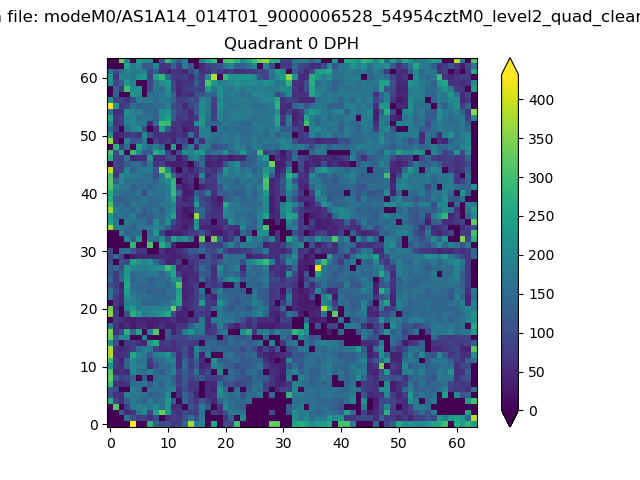 |
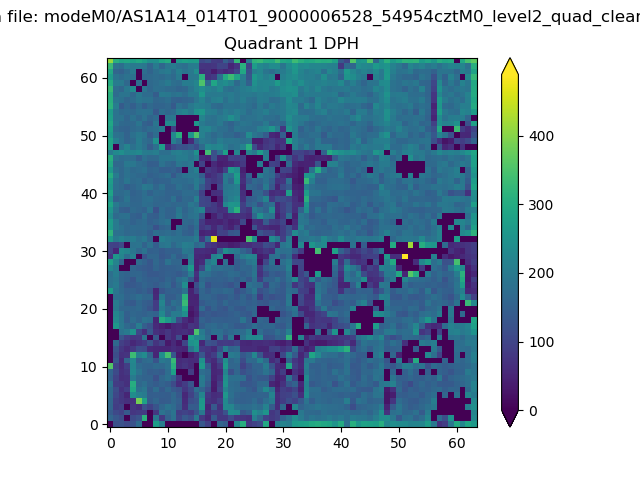 |
Quadrant B |
|---|---|---|---|
| Quadrant D | 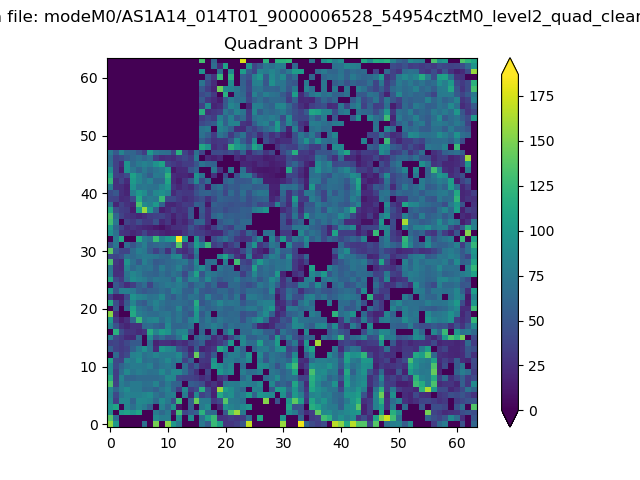 |
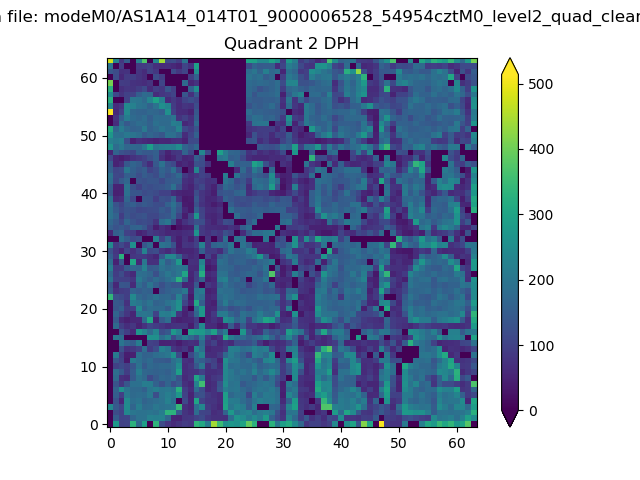 |
Quadrant C |
| Plot type | Count rate plots | Images |
|---|---|---|
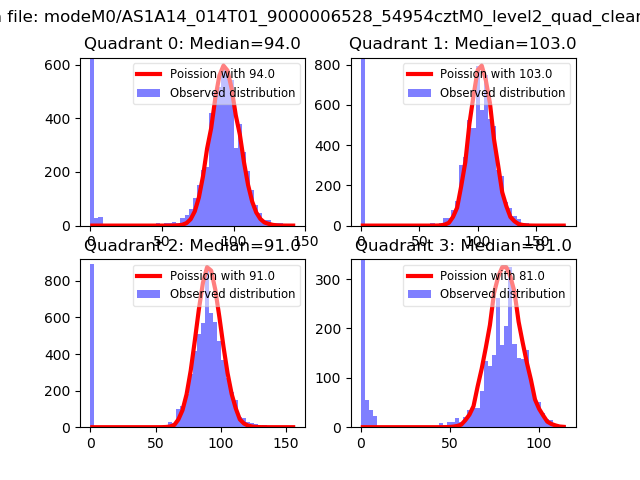
| Comparison with Poisson distribution Blue bars denote a histogram of data divided into 1 sec bins. Red curve is a Poisson curve with rate = median count rate of data. |
 |
 |
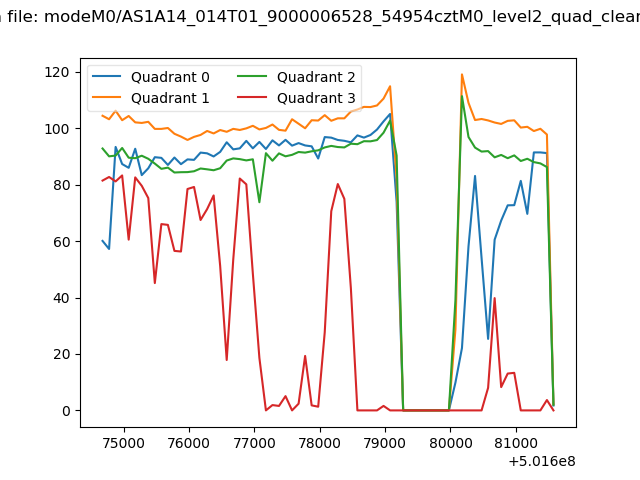
| Quadrant-wise count rates Data is divided into 100 sec bins |
 |
|
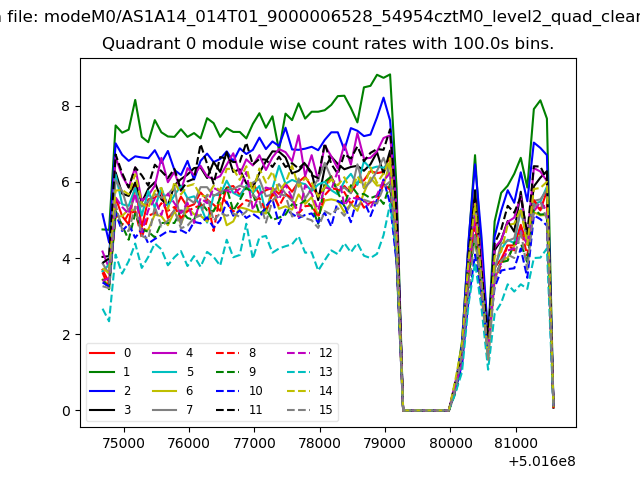
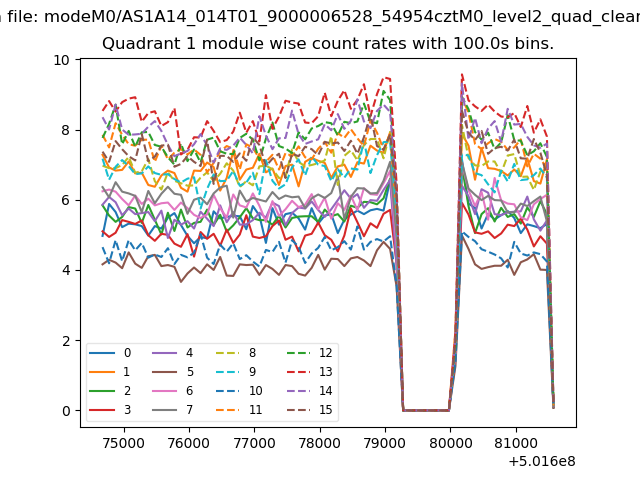
| Module-wise count rates for Quadrant A Data is divided into 100 sec bins |
 |
 |
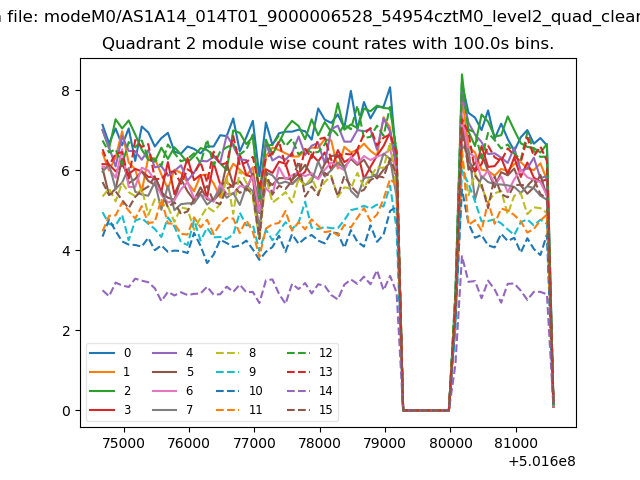
| Module-wise count rates for Quadrant B Data is divided into 100 sec bins |
 |
 |
| Module-wise count rates for Quadrant C Data is divided into 100 sec bins |
 |
 |
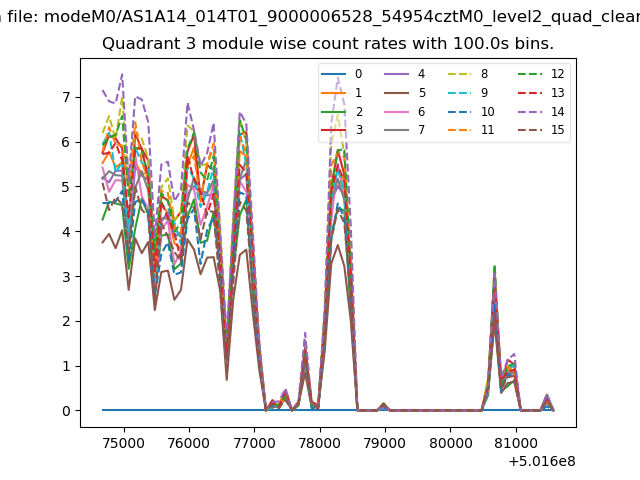
| Module-wise count rates for Quadrant D Data is divided into 100 sec bins |
 |
 |
| Parameter | Plot |
|---|---|
| CZT HV Monitor | 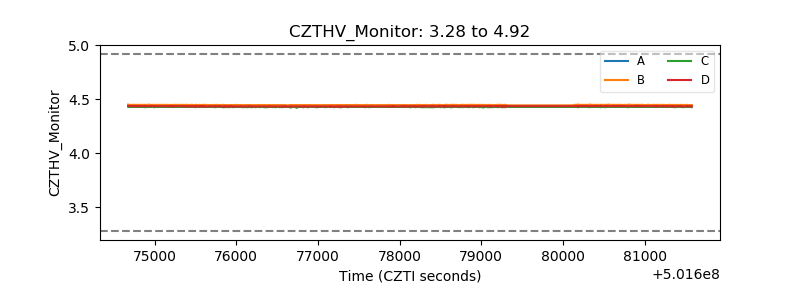 |
| D_VDD | 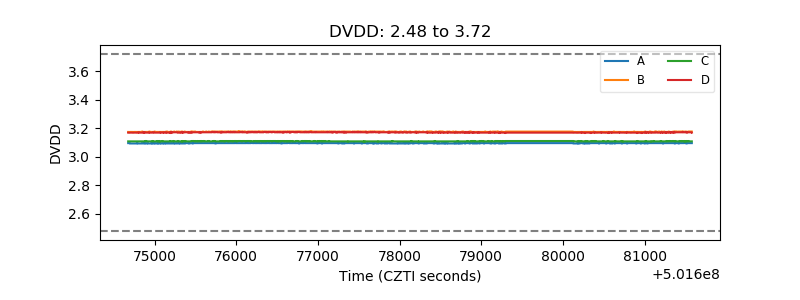 |
| Temperature 1 | 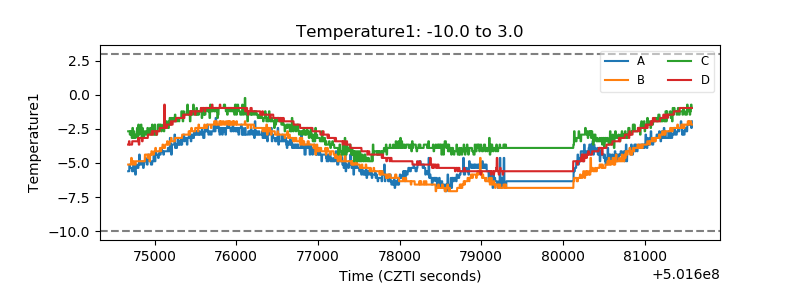 |
| Veto HV Monitor | 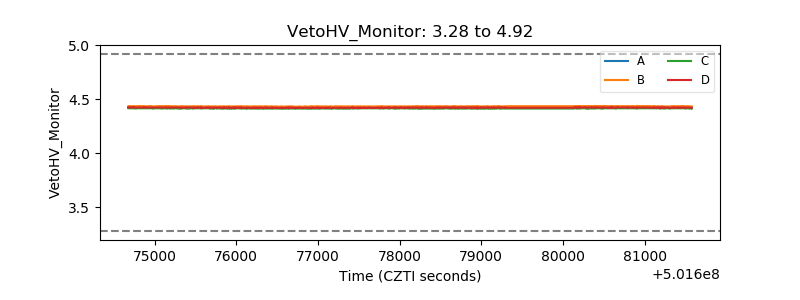 |
| Veto LLD | 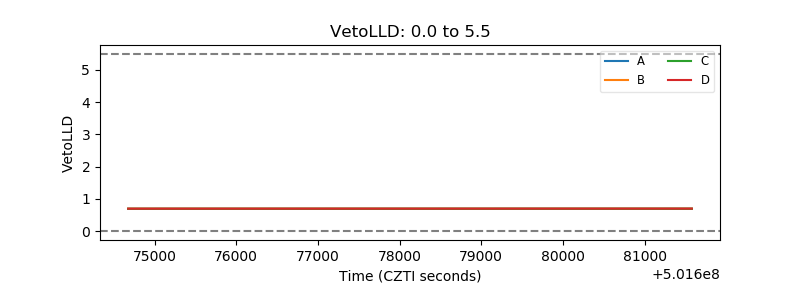 |
| Alpha Counter | 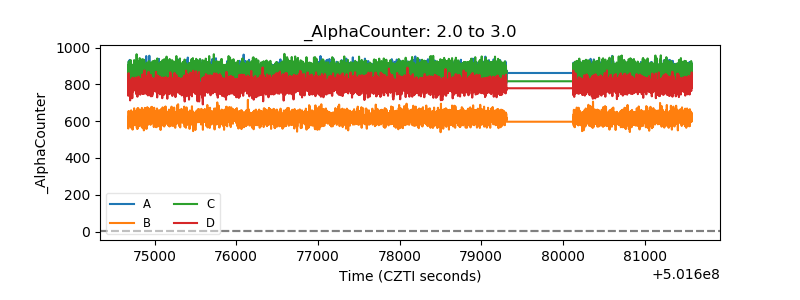 |
| _CPM_Rate | 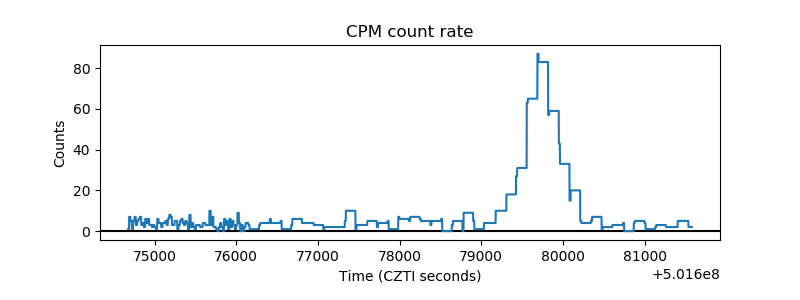 |
| CZT Counter | 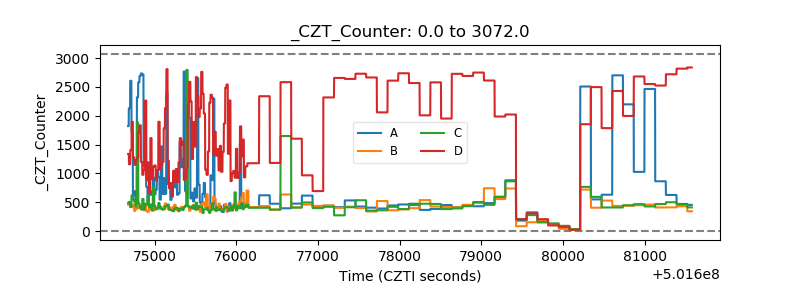 |
| +2.5 Volts monitor |  |
| +5 Volts monitor |  |
| _ROLL_ROT | 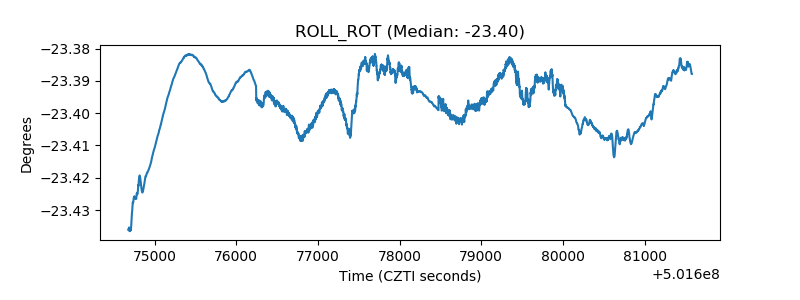 |
| _Roll_DEC | 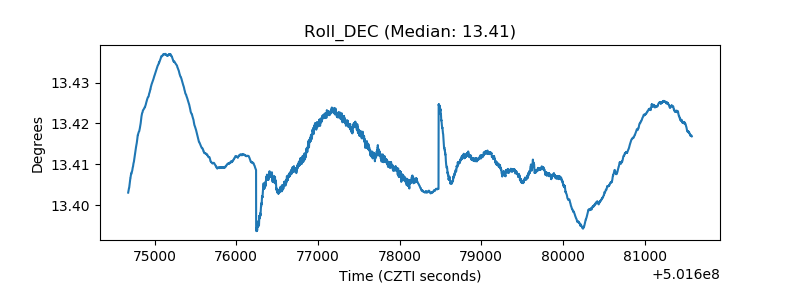 |
| _Roll_RA | 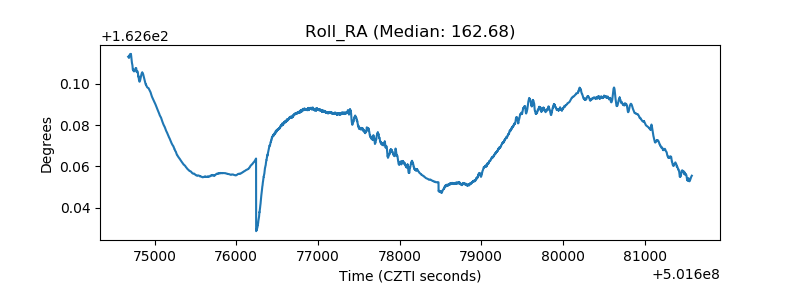 |
| Veto Counter | 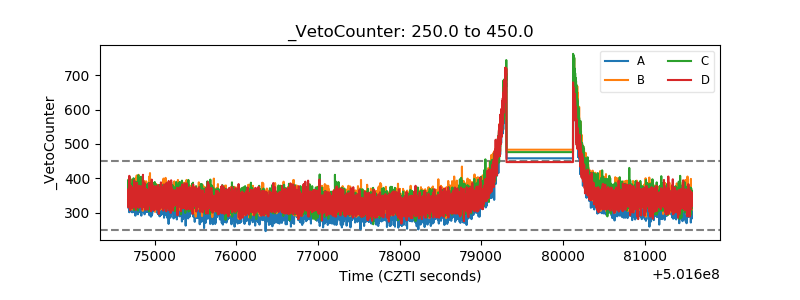 |