| Param | Original file | Final file |
|---|---|---|
| Filename | modeM0/AS1A14_014T01_9000006528_54955cztM0_level2.fits | modeM0/AS1A14_014T01_9000006528_54955cztM0_level2_quad_clean.evt |
| Size (bytes) | 757,560,960 | 83,672,640 |
| Size | 722.5 MB | 79.8 MB |
| Events in quadrant A | 4,254,607 | 628,268 |
| Events in quadrant B | 3,138,787 | 702,052 |
| Events in quadrant C | 3,328,116 | 625,659 |
| Events in quadrant D | 16,774,755 | 88,792 |
| Mode M0 | |||
|---|---|---|---|
| Quadrant | BADHDUFLAG | Total packets | Discarded packets |
| A | 0 | 17584 | 1 |
| B | 0 | 14662 | 1 |
| C | 0 | 15074 | 1 |
| D | 0 | 54674 | 1 |
| Mode SS | |||
|---|---|---|---|
| Quadrant | BADHDUFLAG | Total packets | Discarded packets |
| A | 0 | 142 | 0 |
| B | 0 | 142 | 0 |
| C | 0 | 142 | 0 |
| D | 0 | 142 | 0 |
| Mode M9 | |||
|---|---|---|---|
| Quadrant | BADHDUFLAG | Total packets | Discarded packets |
| A | 0 | 4 | 0 |
| B | 0 | 4 | 0 |
| C | 0 | 4 | 0 |
| D | 0 | 4 | 0 |
| Quadrant | Total seconds | Saturated seconds | Saturation percentage |
|---|---|---|---|
| A | 7015 | 460 | 6.557377% |
| B | 7016 | 183 | 2.608324% |
| C | 7016 | 151 | 2.152223% |
| D | 7016 | 6129 | 87.357469% |
Noise dominated data is calculated using 1-second bins in cleaned event files. If a bin has >2000 counts, and if more than 50% of those come from <1% of pixels, then it is considered to be noise-dominated and hence unusable.
| Quadrant | # 1 sec bins | Bins with >0 counts | Bins with >2000 counts | High rate bins dominated by noise | Noise dominated (total time) | Noise dominated (detector-on time) | Marked lightcurve |
|---|---|---|---|---|---|---|---|
| A | 7400 | 7016 | 314 | 314 | 4.24% | 4.48% | 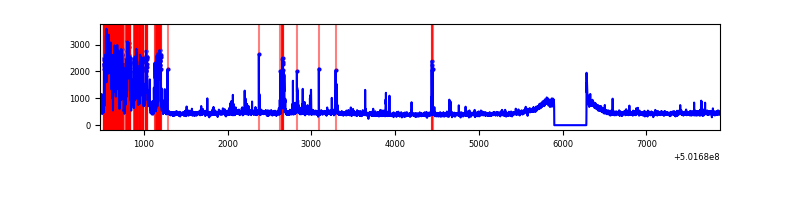 |
| B | 7401 | 7017 | 11 | 11 | 0.15% | 0.16% | 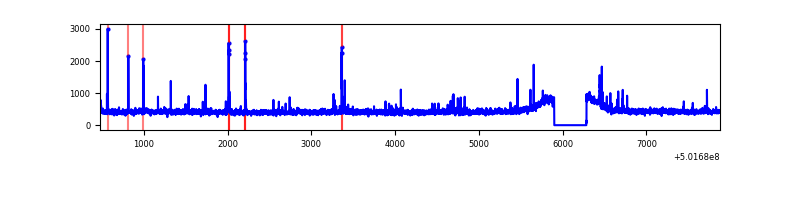 |
| C | 7401 | 7017 | 12 | 12 | 0.16% | 0.17% | 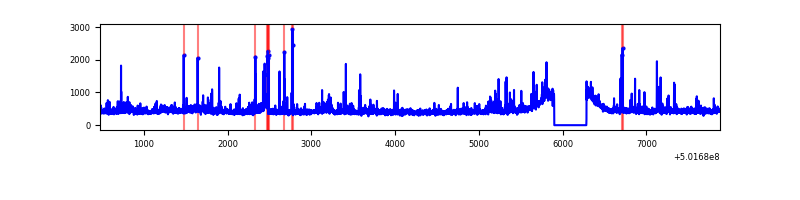 |
| D | 7401 | 7017 | 5940 | 5940 | 80.26% | 84.65% | 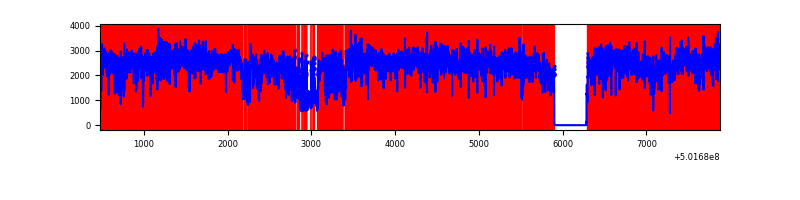 |
Top three noisy pixels from each quadrant. If the there are fewer than three noisy pixels in the level2.evt file, extra rows are filled as -1
| Pixel properties | Quadrant properties | ||||||
|---|---|---|---|---|---|---|---|
| Quadrant | DetID | PixID | Counts | Sigma | Mean | Median | Sigma |
| A | 15 | 32 | 936636 | 4958.93 | 763 | 741 | 188.7 |
| A | 0 | 8 | 103044 | 542.06 | 763 | 741 | 188.7 |
| A | 4 | 3 | 84351 | 443.01 | 763 | 741 | 188.7 |
| B | 5 | 185 | 36728 | 217.69 | 762 | 733 | 165.3 |
| B | 12 | 111 | 20315 | 118.42 | 762 | 733 | 165.3 |
| B | 7 | 252 | 19867 | 115.72 | 762 | 733 | 165.3 |
| C | 14 | 254 | 120694 | 579.67 | 757 | 749 | 206.9 |
| C | 1 | 16 | 77598 | 371.39 | 757 | 749 | 206.9 |
| C | 6 | 223 | 45973 | 218.56 | 757 | 749 | 206.9 |
| D | 15 | 94 | 13995219 | 155762.84 | 309 | 293 | 89.8 |
| D | 8 | 240 | 752787 | 8375.22 | 309 | 293 | 89.8 |
| D | 14 | 52 | 300208 | 3338.04 | 309 | 293 | 89.8 |
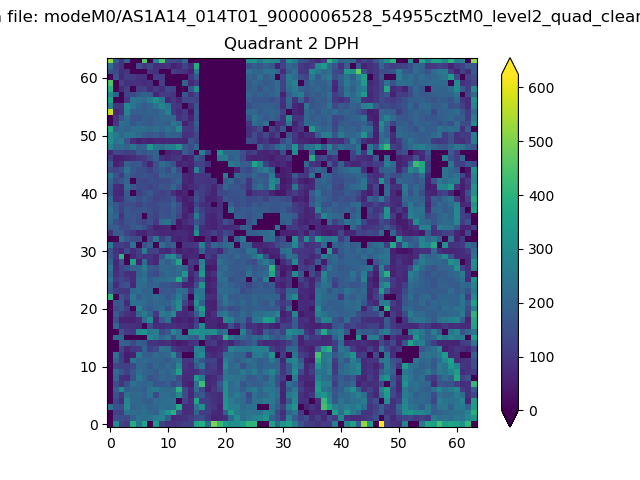
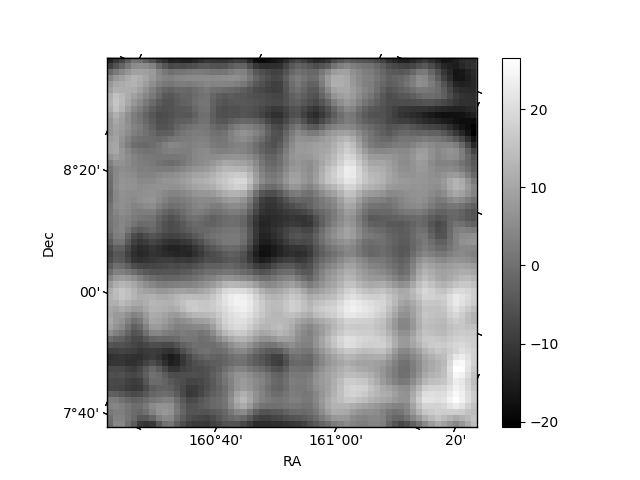
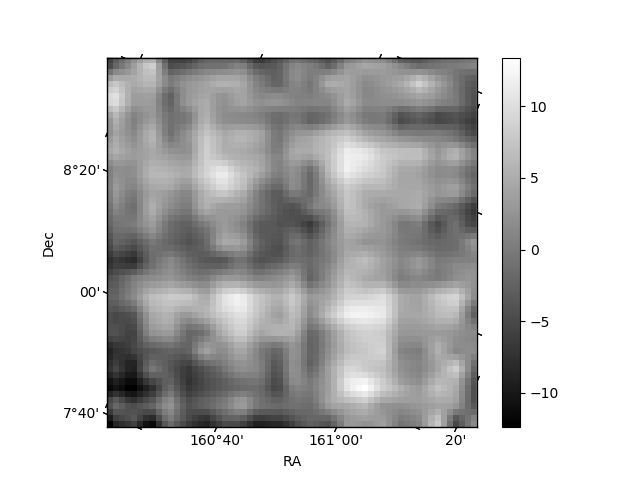
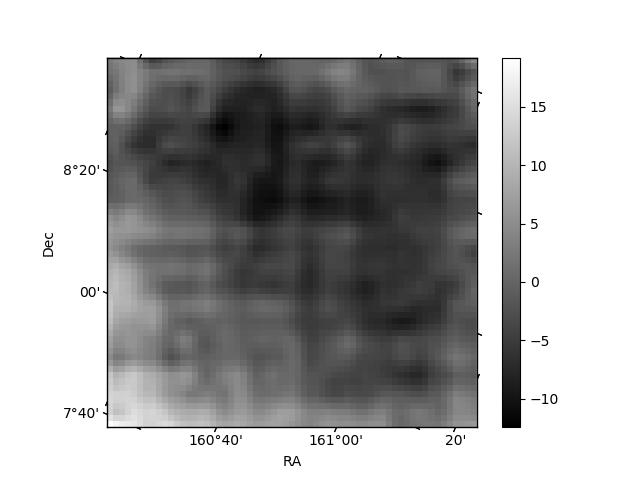
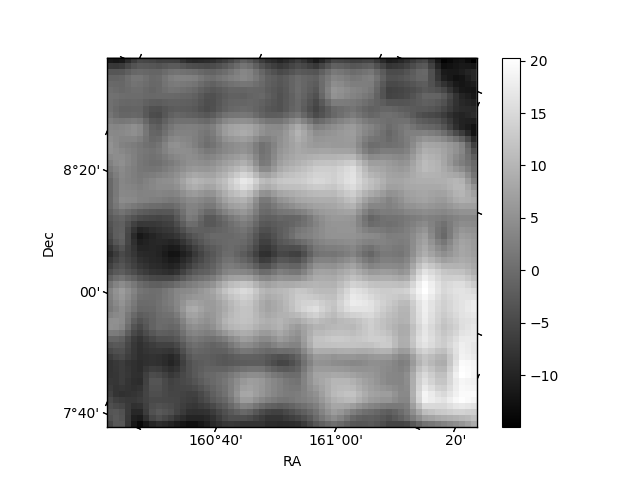
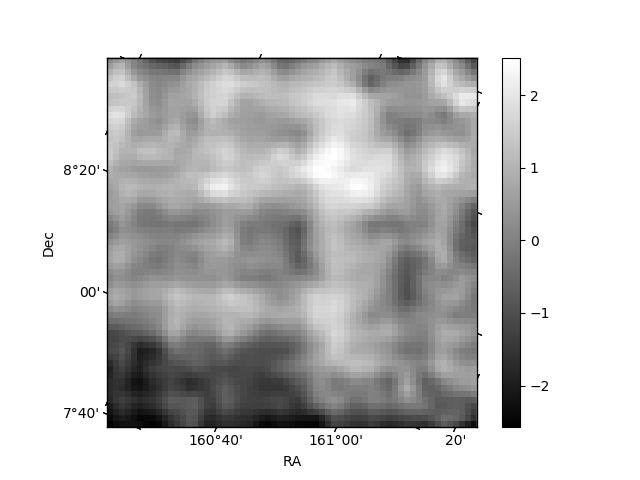
Histogram calculated using DETX and DETY for each event in the final _common_clean file
| Quadrant A | 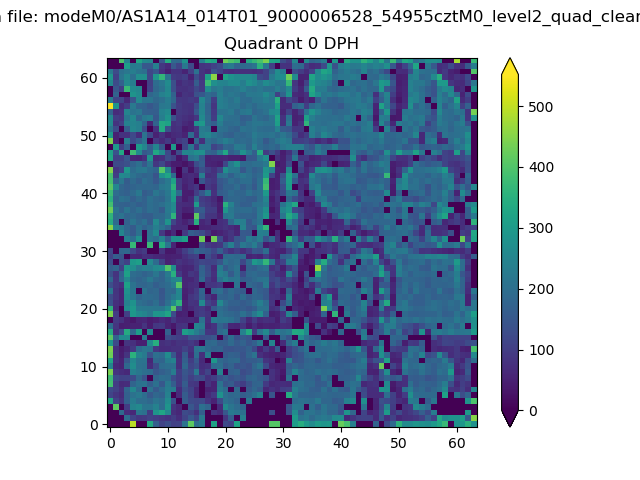 |
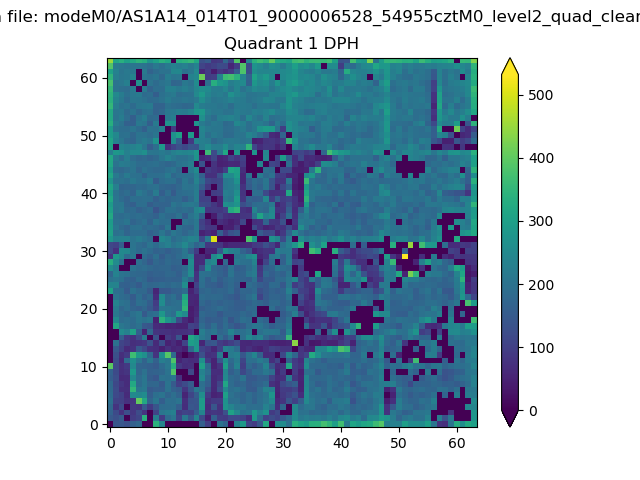 |
Quadrant B |
|---|---|---|---|
| Quadrant D | 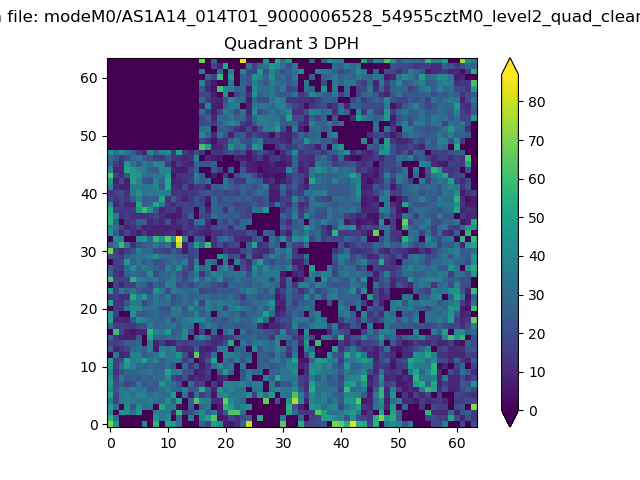 |
 |
Quadrant C |
| Plot type | Count rate plots | Images |
|---|---|---|
| Comparison with Poisson distribution Blue bars denote a histogram of data divided into 1 sec bins. Red curve is a Poisson curve with rate = median count rate of data. |
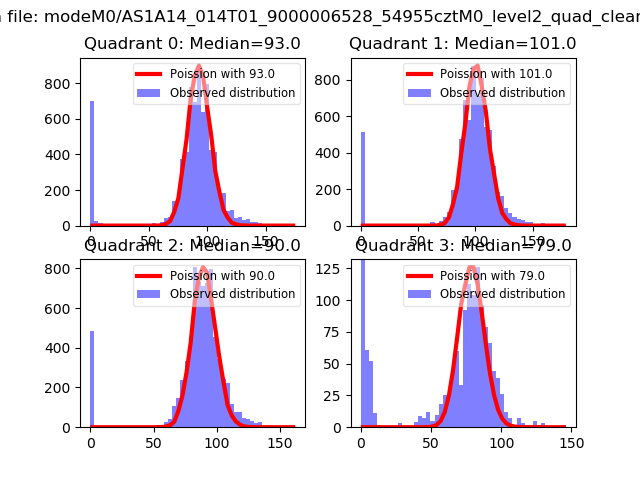 |
 |
| Quadrant-wise count rates Data is divided into 100 sec bins |
 |
|
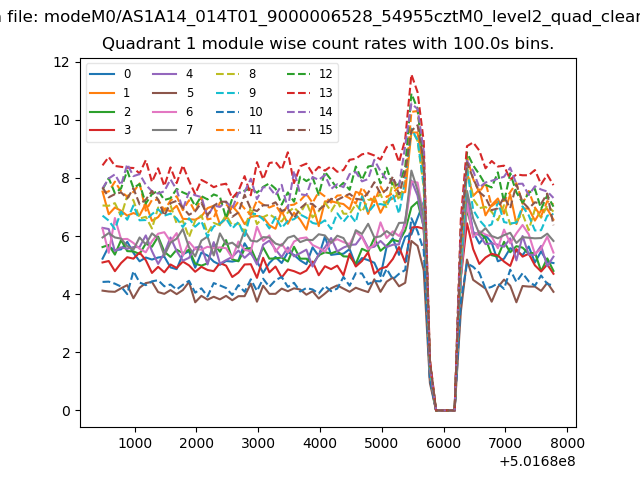
| Module-wise count rates for Quadrant A Data is divided into 100 sec bins |
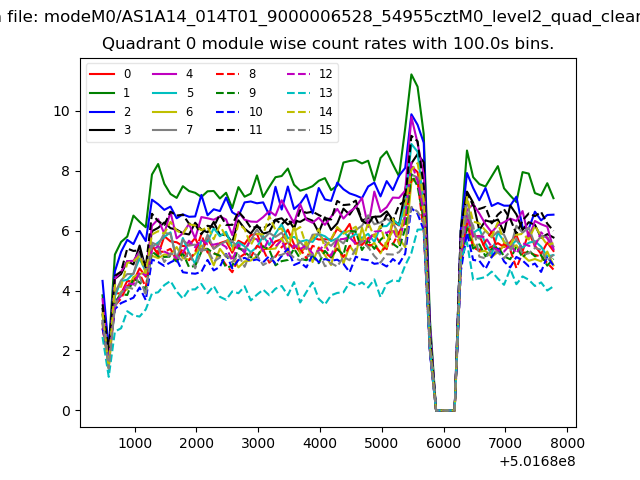 |
 |
| Module-wise count rates for Quadrant B Data is divided into 100 sec bins |
 |
 |
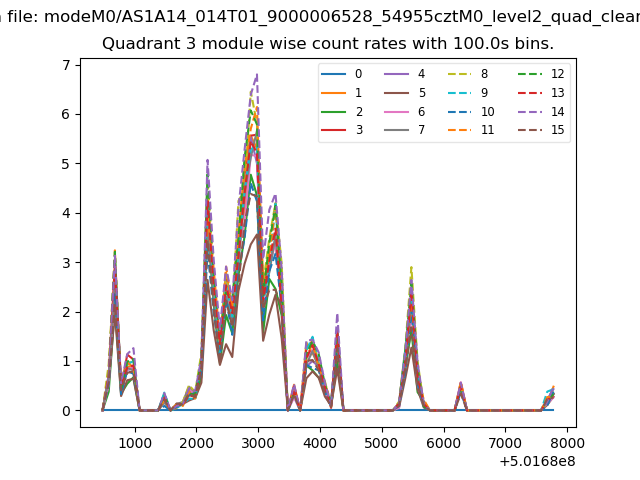
| Module-wise count rates for Quadrant C Data is divided into 100 sec bins |
 |
 |
| Module-wise count rates for Quadrant D Data is divided into 100 sec bins |
 |
 |
| Parameter | Plot |
|---|---|
| CZT HV Monitor | 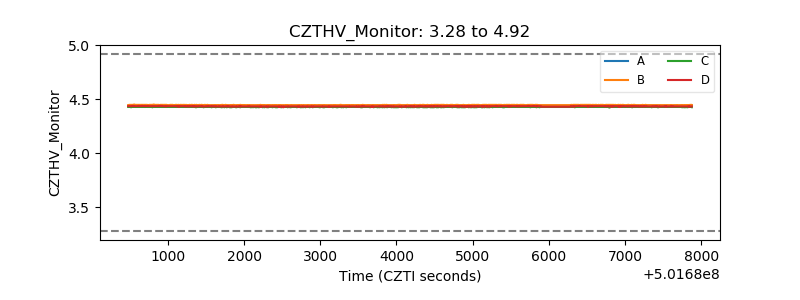 |
| D_VDD | 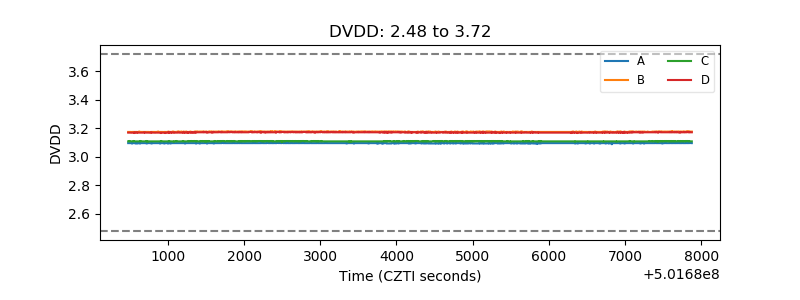 |
| Temperature 1 | 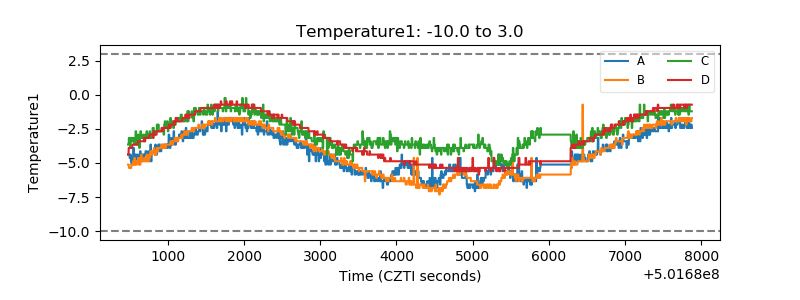 |
| Veto HV Monitor | 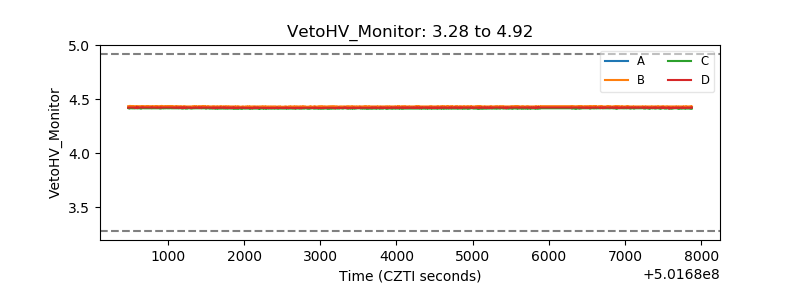 |
| Veto LLD | 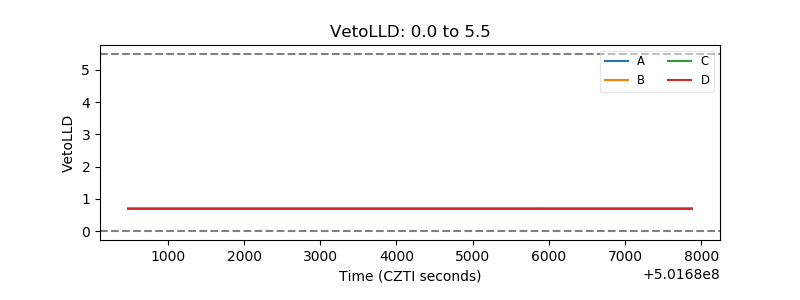 |
| Alpha Counter |  |
| _CPM_Rate | 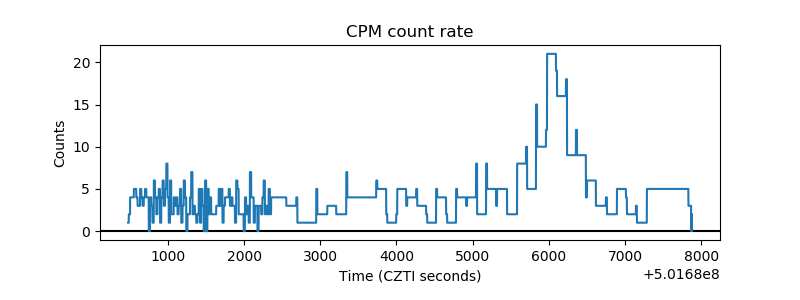 |
| CZT Counter | 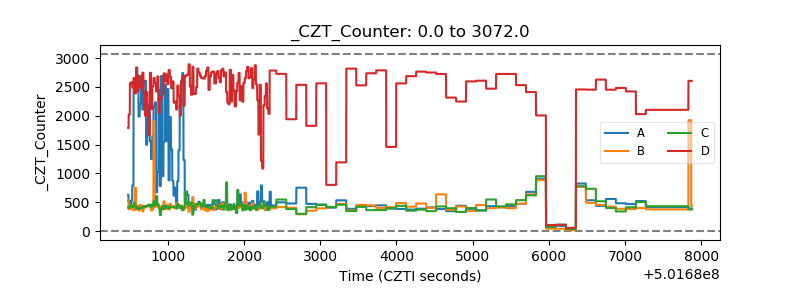 |
| +2.5 Volts monitor |  |
| +5 Volts monitor |  |
| _ROLL_ROT | 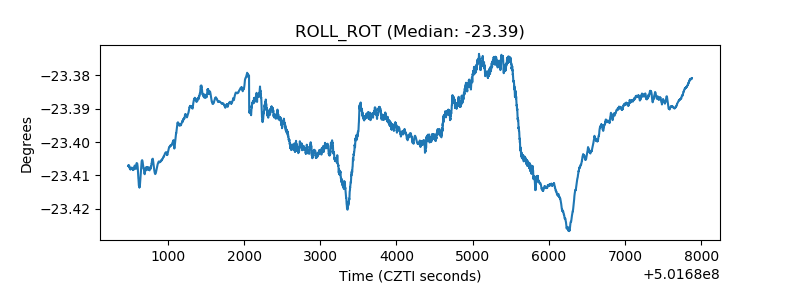 |
| _Roll_DEC | 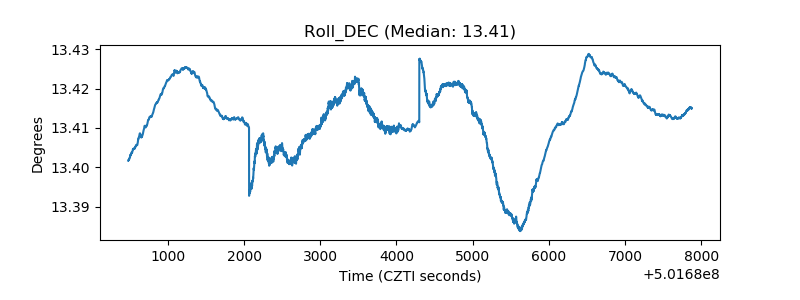 |
| _Roll_RA | 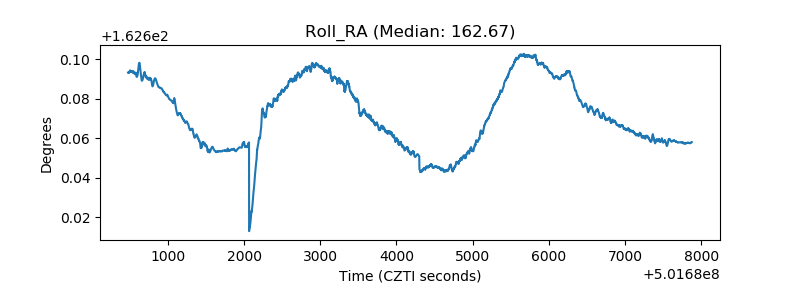 |
| Veto Counter |  |