| Param | Original file | Final file |
|---|---|---|
| Filename | modeM0/AS1A14_014T01_9000006528_54956cztM0_level2.fits | modeM0/AS1A14_014T01_9000006528_54956cztM0_level2_quad_clean.evt |
| Size (bytes) | 803,479,680 | 88,364,160 |
| Size | 766.3 MB | 84.3 MB |
| Events in quadrant A | 3,544,756 | 699,169 |
| Events in quadrant B | 3,315,568 | 751,167 |
| Events in quadrant C | 3,701,386 | 667,527 |
| Events in quadrant D | 18,599,252 | 37,808 |
| Mode M0 | |||
|---|---|---|---|
| Quadrant | BADHDUFLAG | Total packets | Discarded packets |
| A | 0 | 16029 | 3 |
| B | 0 | 15632 | 6 |
| C | 0 | 16356 | 6 |
| D | 0 | 60392 | 23 |
| Mode SS | |||
|---|---|---|---|
| Quadrant | BADHDUFLAG | Total packets | Discarded packets |
| A | 0 | 150 | 0 |
| B | 0 | 150 | 0 |
| C | 0 | 150 | 0 |
| D | 0 | 150 | 0 |
| Quadrant | Total seconds | Saturated seconds | Saturation percentage |
|---|---|---|---|
| A | 7469 | 35 | 0.468604% |
| B | 7468 | 48 | 0.642742% |
| C | 7468 | 39 | 0.522228% |
| D | 7467 | 7058 | 94.522566% |
Noise dominated data is calculated using 1-second bins in cleaned event files. If a bin has >2000 counts, and if more than 50% of those come from <1% of pixels, then it is considered to be noise-dominated and hence unusable.
| Quadrant | # 1 sec bins | Bins with >0 counts | Bins with >2000 counts | High rate bins dominated by noise | Noise dominated (total time) | Noise dominated (detector-on time) | Marked lightcurve |
|---|---|---|---|---|---|---|---|
| A | 7470 | 7470 | 25 | 25 | 0.33% | 0.33% | 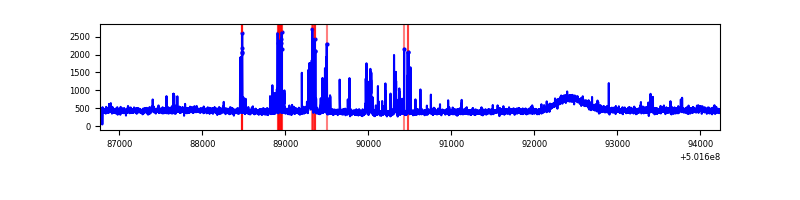 |
| B | 7471 | 7471 | 11 | 11 | 0.15% | 0.15% | 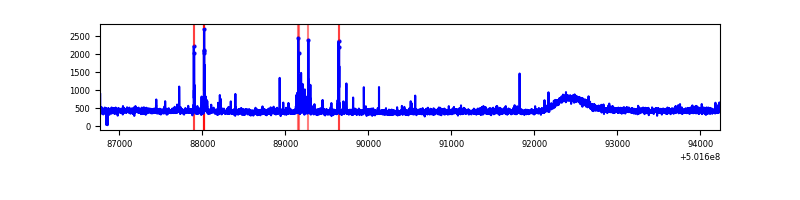 |
| C | 7471 | 7471 | 36 | 36 | 0.48% | 0.48% | 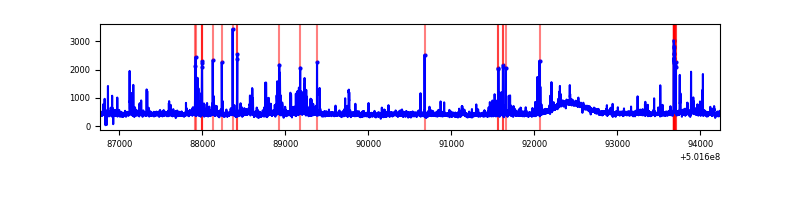 |
| D | 7470 | 7470 | 6619 | 6619 | 88.61% | 88.61% | 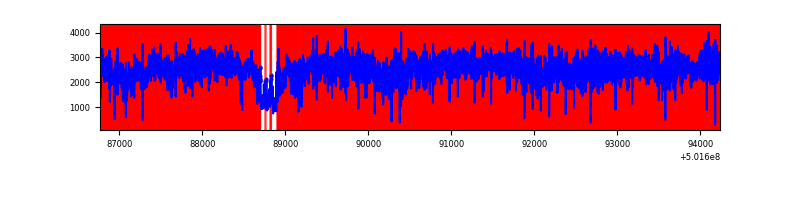 |
Top three noisy pixels from each quadrant. If the there are fewer than three noisy pixels in the level2.evt file, extra rows are filled as -1
| Pixel properties | Quadrant properties | ||||||
|---|---|---|---|---|---|---|---|
| Quadrant | DetID | PixID | Counts | Sigma | Mean | Median | Sigma |
| A | 0 | 8 | 256373 | 1266.27 | 818 | 796 | 201.8 |
| A | 4 | 3 | 50825 | 247.87 | 818 | 796 | 201.8 |
| A | 3 | 14 | 36476 | 176.78 | 818 | 796 | 201.8 |
| B | 7 | 252 | 45548 | 254.21 | 809 | 778 | 176.1 |
| B | 12 | 111 | 21735 | 119.0 | 809 | 778 | 176.1 |
| B | 6 | 239 | 21634 | 118.42 | 809 | 778 | 176.1 |
| C | 1 | 16 | 119220 | 542.52 | 799 | 791 | 218.3 |
| C | 14 | 254 | 113443 | 516.05 | 799 | 791 | 218.3 |
| C | 12 | 252 | 97995 | 445.29 | 799 | 791 | 218.3 |
| D | 15 | 94 | 17418614 | 283708.26 | 211 | 202 | 61.4 |
| D | 2 | 249 | 87157 | 1416.31 | 211 | 202 | 61.4 |
| D | 11 | 129 | 56273 | 913.28 | 211 | 202 | 61.4 |
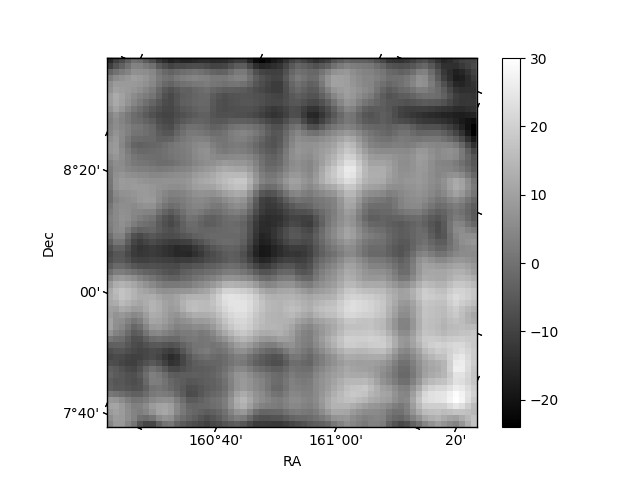
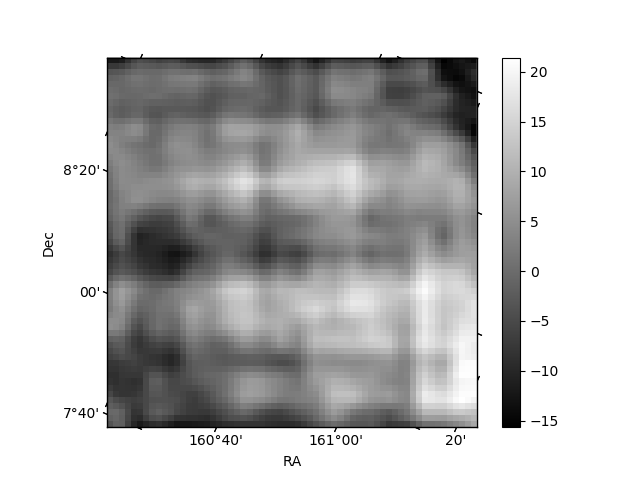
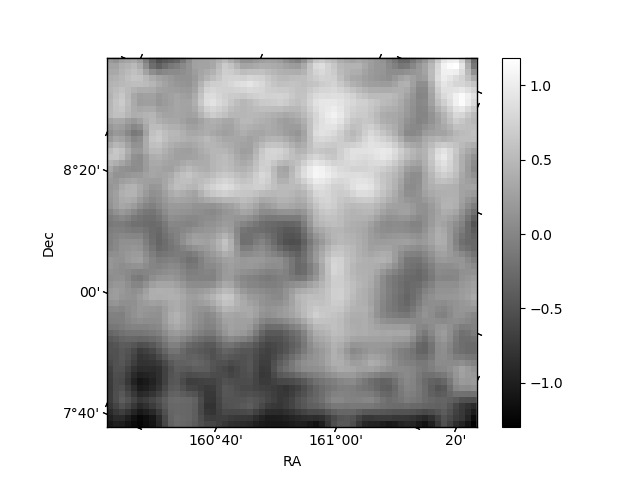
Histogram calculated using DETX and DETY for each event in the final _common_clean file
| Quadrant A | 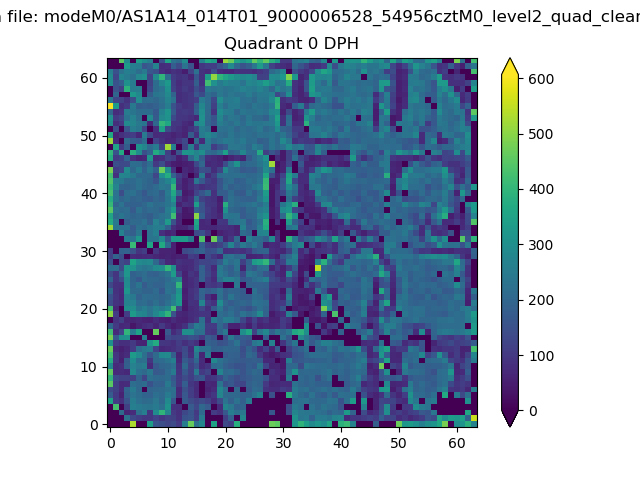 |
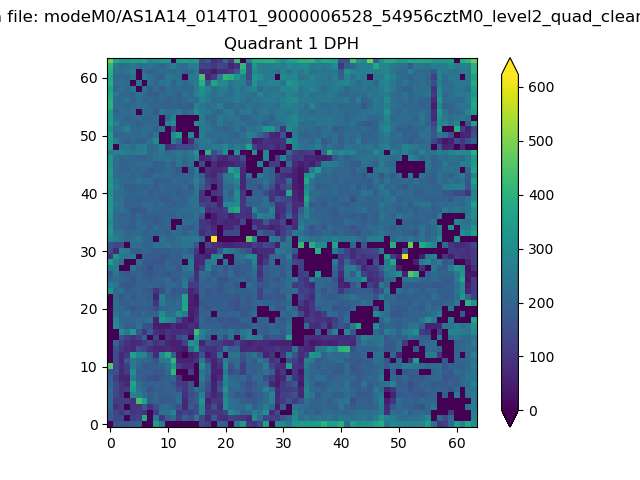 |
Quadrant B |
|---|---|---|---|
| Quadrant D | 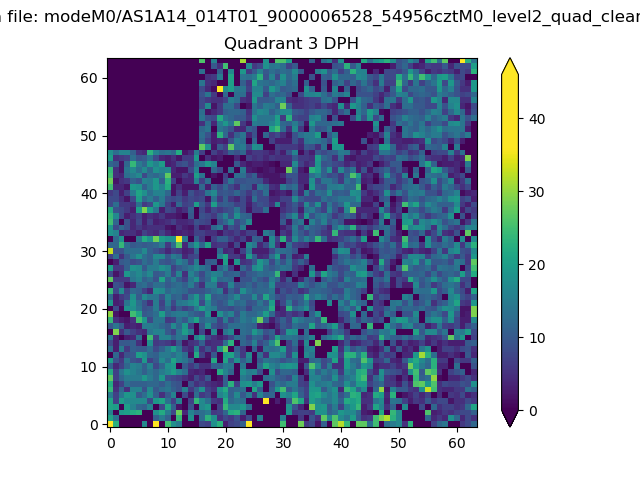 |
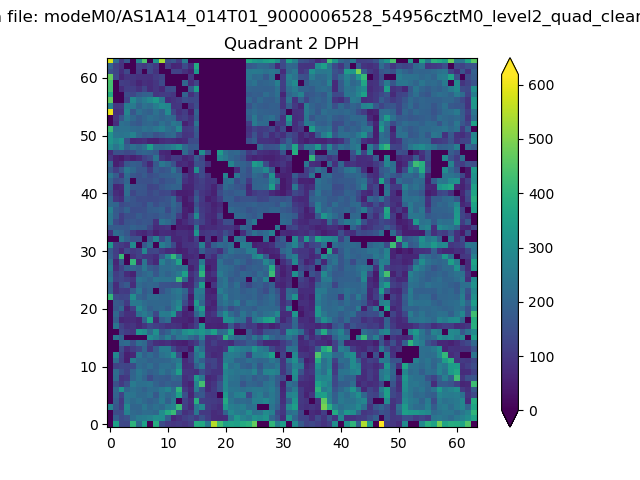 |
Quadrant C |
| Plot type | Count rate plots | Images |
|---|---|---|
| Comparison with Poisson distribution Blue bars denote a histogram of data divided into 1 sec bins. Red curve is a Poisson curve with rate = median count rate of data. |
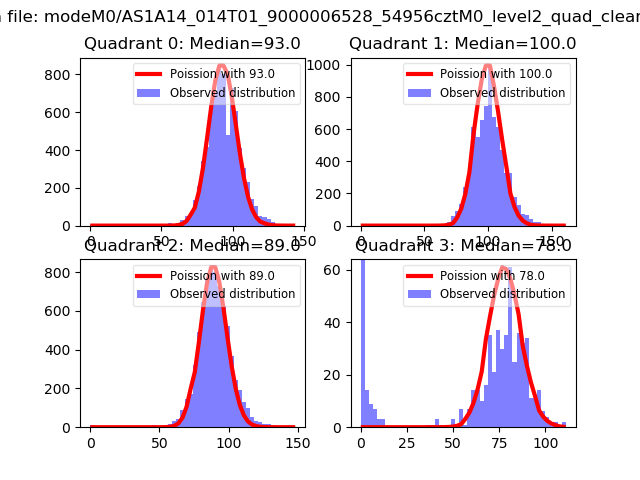 |
 |
| Quadrant-wise count rates Data is divided into 100 sec bins |
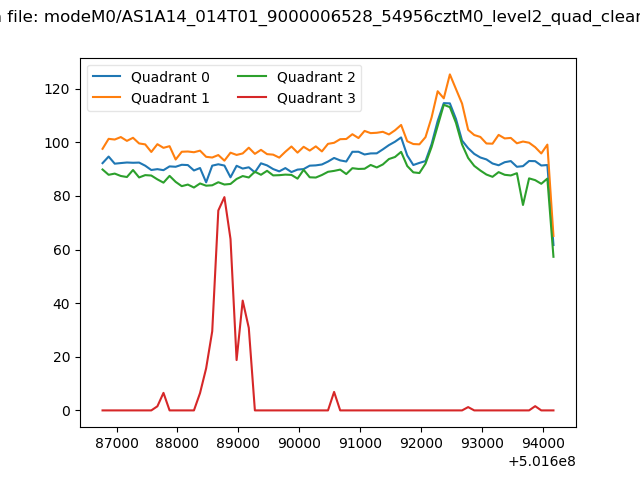 |
|
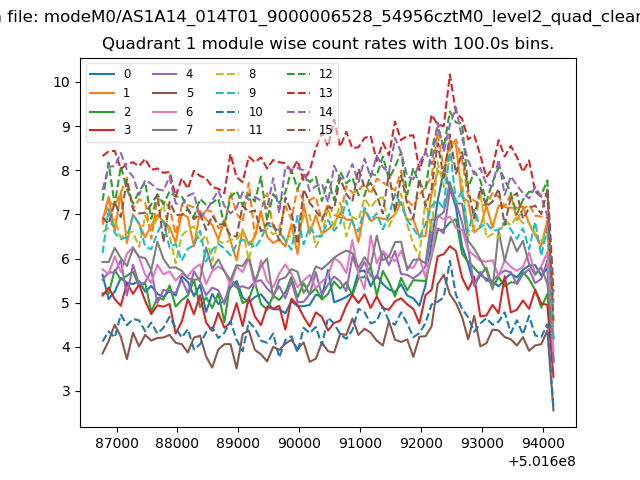
| Module-wise count rates for Quadrant A Data is divided into 100 sec bins |
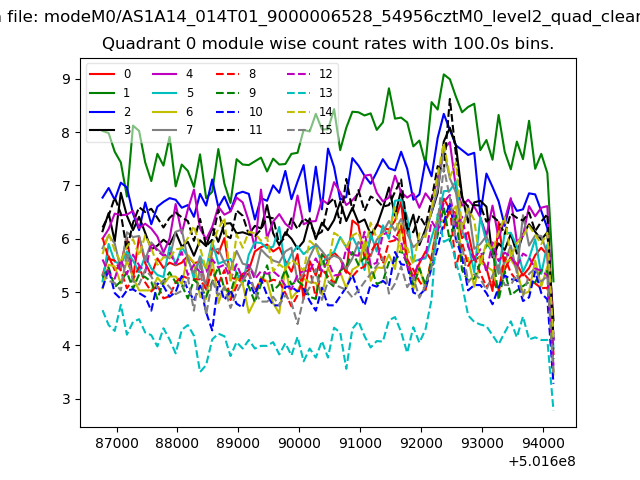 |
 |
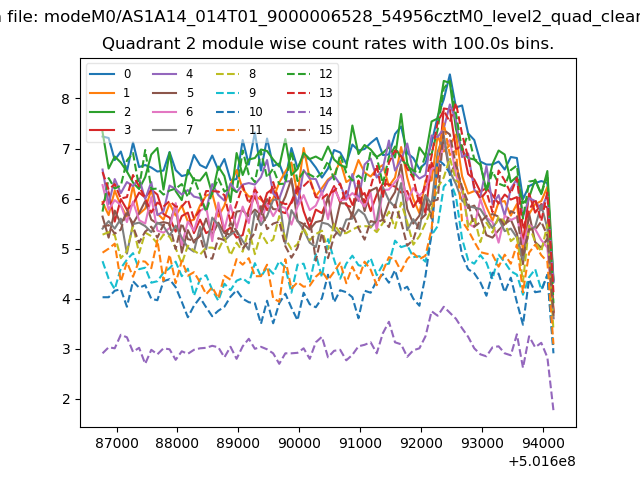
| Module-wise count rates for Quadrant B Data is divided into 100 sec bins |
 |
 |
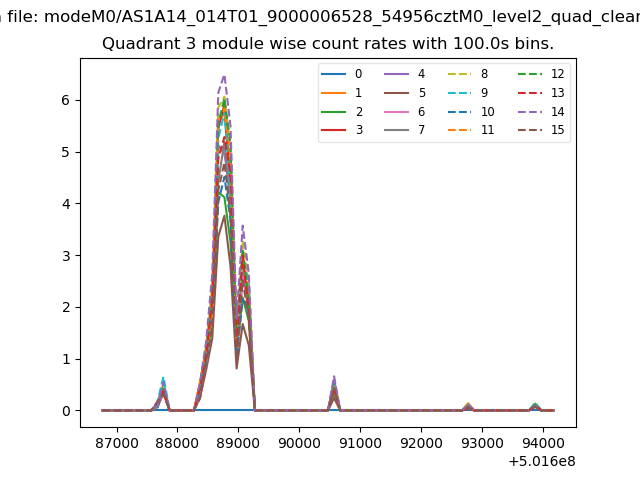
| Module-wise count rates for Quadrant C Data is divided into 100 sec bins |
 |
 |
| Module-wise count rates for Quadrant D Data is divided into 100 sec bins |
 |
 |
| Parameter | Plot |
|---|---|
| CZT HV Monitor | 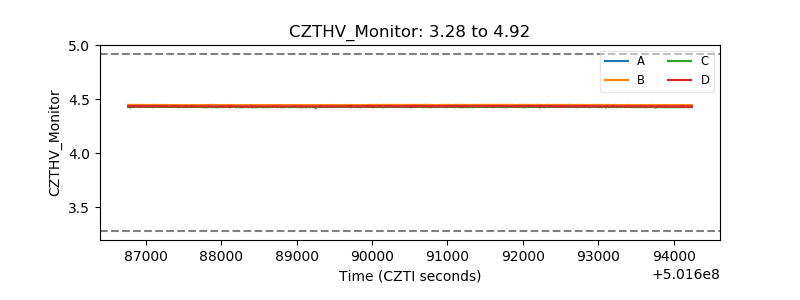 |
| D_VDD | 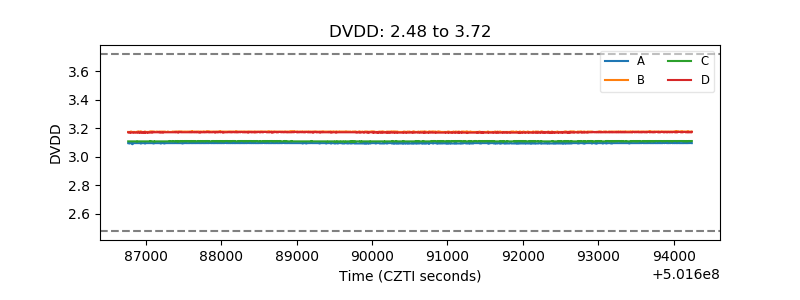 |
| Temperature 1 | 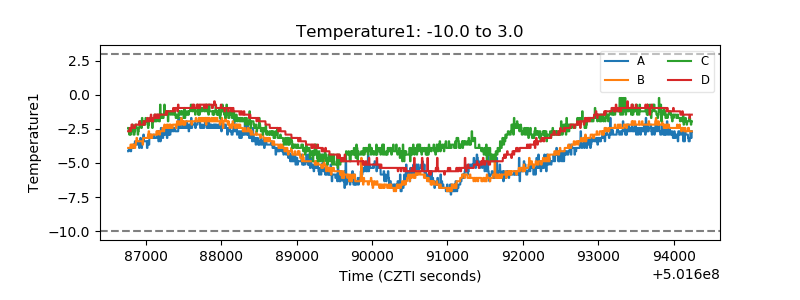 |
| Veto HV Monitor | 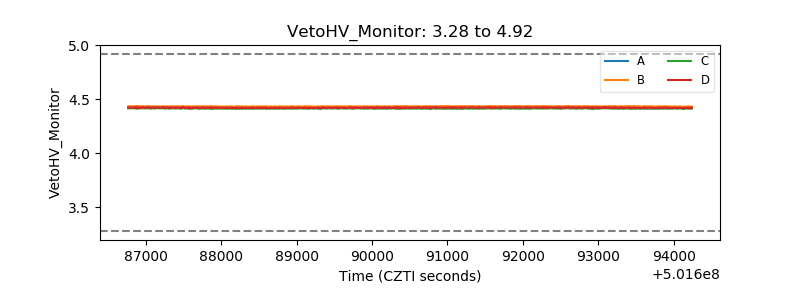 |
| Veto LLD | 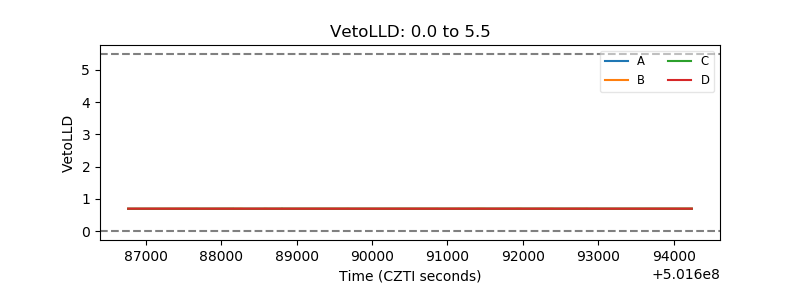 |
| Alpha Counter | 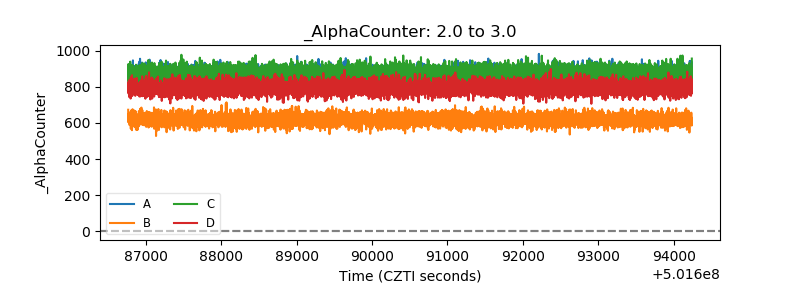 |
| _CPM_Rate | 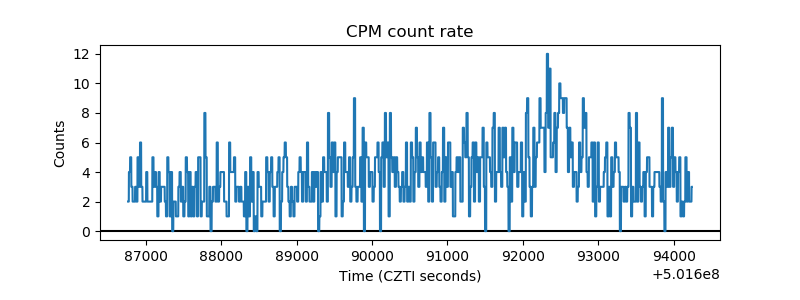 |
| CZT Counter | 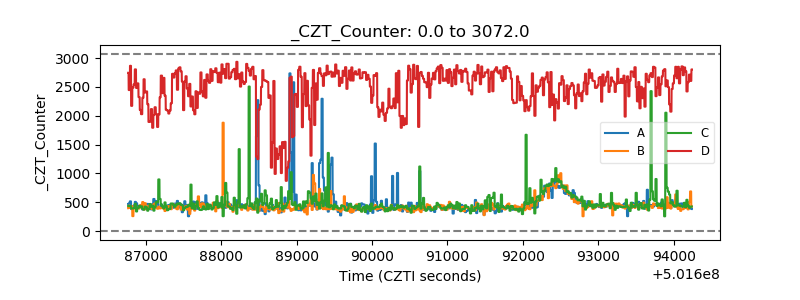 |
| +2.5 Volts monitor |  |
| +5 Volts monitor |  |
| _ROLL_ROT | 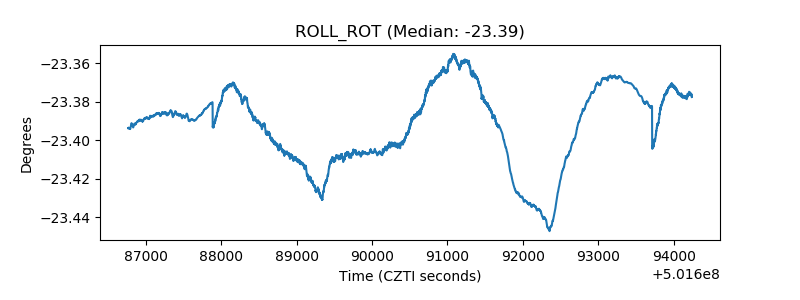 |
| _Roll_DEC | 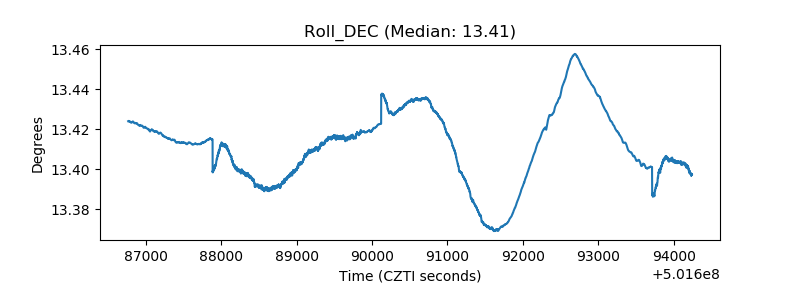 |
| _Roll_RA | 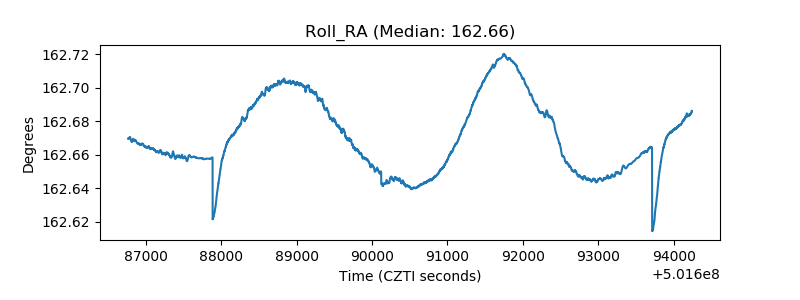 |
| Veto Counter | 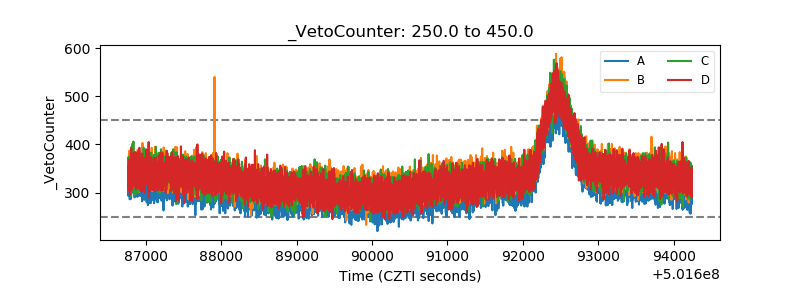 |