| Param | Original file | Final file |
|---|---|---|
| Filename | modeM0/AS1A14_014T01_9000006528_54958cztM0_level2.fits | modeM0/AS1A14_014T01_9000006528_54958cztM0_level2_quad_clean.evt |
| Size (bytes) | 845,861,760 | 90,204,480 |
| Size | 806.7 MB | 86.0 MB |
| Events in quadrant A | 3,998,615 | 706,519 |
| Events in quadrant B | 3,541,414 | 765,846 |
| Events in quadrant C | 4,243,524 | 669,862 |
| Events in quadrant D | 18,935,965 | 59,455 |
| Mode M0 | |||
|---|---|---|---|
| Quadrant | BADHDUFLAG | Total packets | Discarded packets |
| A | 0 | 17390 | 21 |
| B | 0 | 16257 | 12 |
| C | 0 | 18150 | 23 |
| D | 0 | 61731 | 179 |
| Mode SS | |||
|---|---|---|---|
| Quadrant | BADHDUFLAG | Total packets | Discarded packets |
| A | 0 | 152 | 0 |
| B | 0 | 152 | 0 |
| C | 0 | 152 | 0 |
| D | 0 | 152 | 0 |
| Quadrant | Total seconds | Saturated seconds | Saturation percentage |
|---|---|---|---|
| A | 7612 | 144 | 1.891750% |
| B | 7617 | 87 | 1.142182% |
| C | 7611 | 199 | 2.614637% |
| D | 7594 | 6984 | 91.967343% |
Noise dominated data is calculated using 1-second bins in cleaned event files. If a bin has >2000 counts, and if more than 50% of those come from <1% of pixels, then it is considered to be noise-dominated and hence unusable.
| Quadrant | # 1 sec bins | Bins with >0 counts | Bins with >2000 counts | High rate bins dominated by noise | Noise dominated (total time) | Noise dominated (detector-on time) | Marked lightcurve |
|---|---|---|---|---|---|---|---|
| A | 7623 | 7618 | 126 | 126 | 1.65% | 1.65% | 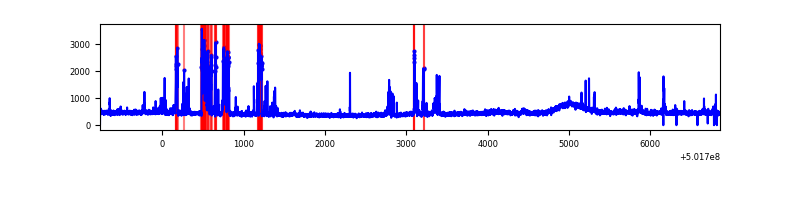 |
| B | 7624 | 7622 | 22 | 22 | 0.29% | 0.29% | 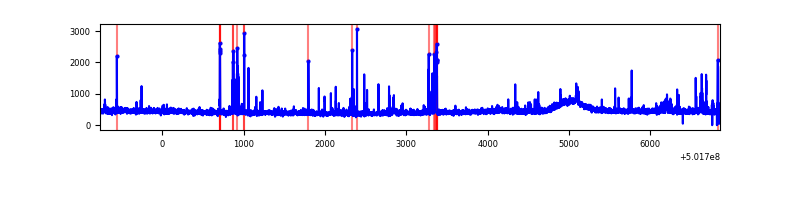 |
| C | 7624 | 7621 | 148 | 148 | 1.94% | 1.94% | 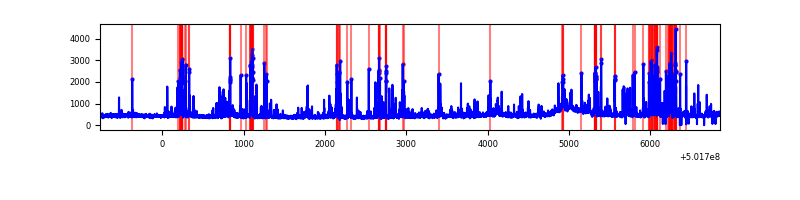 |
| D | 7623 | 7615 | 6643 | 6643 | 87.14% | 87.24% | 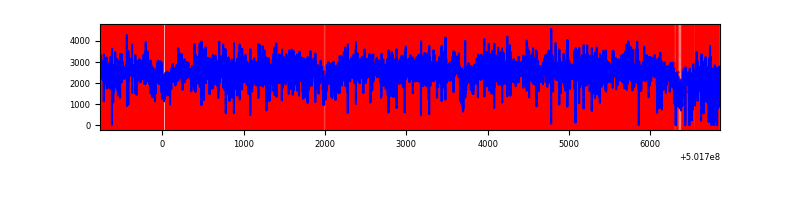 |
Top three noisy pixels from each quadrant. If the there are fewer than three noisy pixels in the level2.evt file, extra rows are filled as -1
| Pixel properties | Quadrant properties | ||||||
|---|---|---|---|---|---|---|---|
| Quadrant | DetID | PixID | Counts | Sigma | Mean | Median | Sigma |
| A | 0 | 8 | 619493 | 3006.71 | 827 | 804 | 205.8 |
| A | 3 | 14 | 75702 | 363.99 | 827 | 804 | 205.8 |
| A | 4 | 3 | 52808 | 252.73 | 827 | 804 | 205.8 |
| B | 7 | 252 | 82149 | 460.65 | 819 | 790 | 176.6 |
| B | 5 | 185 | 65922 | 368.77 | 819 | 790 | 176.6 |
| B | 2 | 249 | 54239 | 302.62 | 819 | 790 | 176.6 |
| C | 4 | 5 | 460811 | 2083.82 | 803 | 797 | 220.8 |
| C | 15 | 147 | 218288 | 985.21 | 803 | 797 | 220.8 |
| C | 14 | 254 | 74026 | 331.72 | 803 | 797 | 220.8 |
| D | 15 | 94 | 16760479 | 204570.34 | 285 | 272 | 81.9 |
| D | 2 | 249 | 291603 | 3555.9 | 285 | 272 | 81.9 |
| D | 15 | 201 | 180928 | 2205.04 | 285 | 272 | 81.9 |
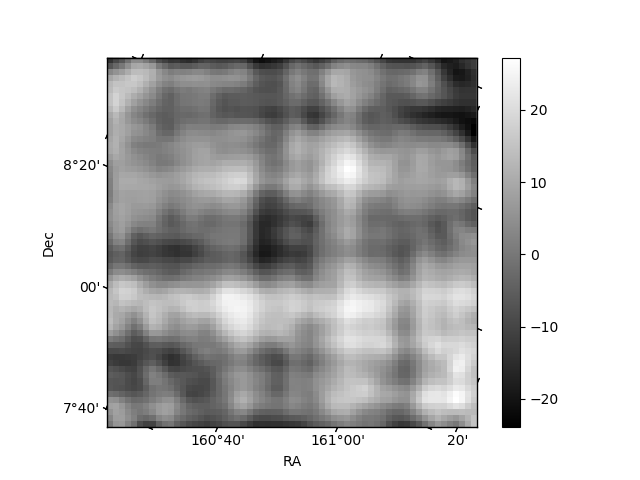
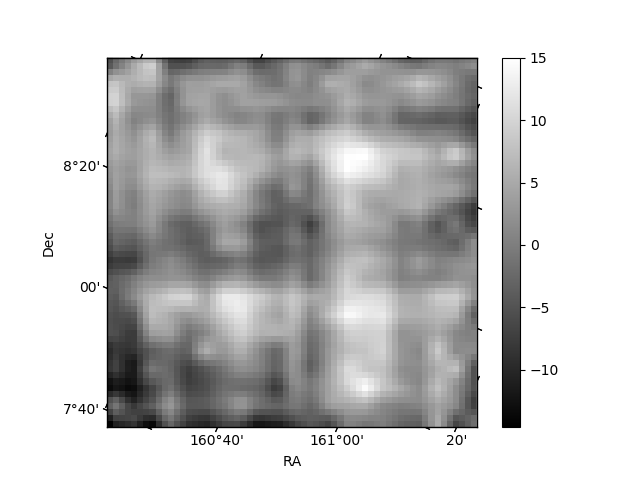
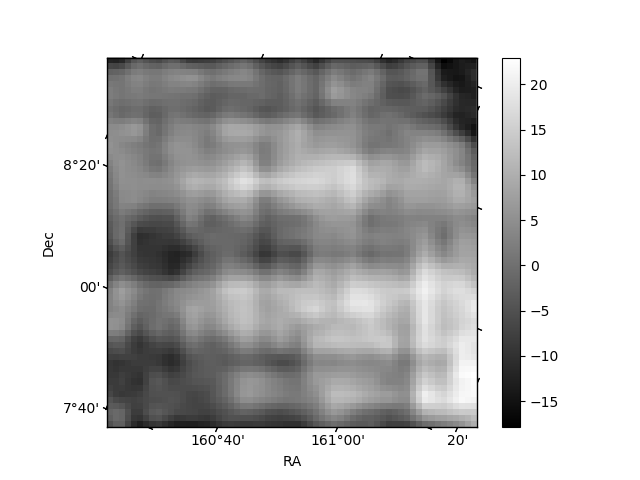
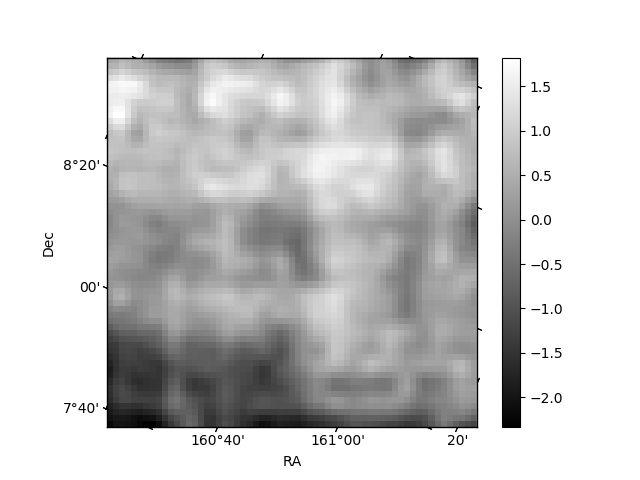
Histogram calculated using DETX and DETY for each event in the final _common_clean file
| Quadrant A | 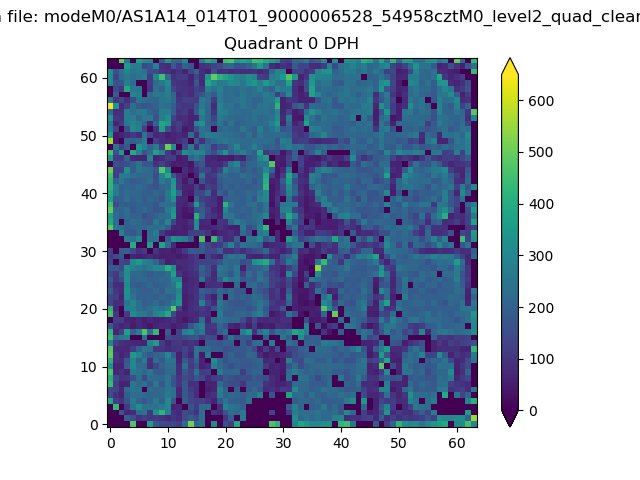 |
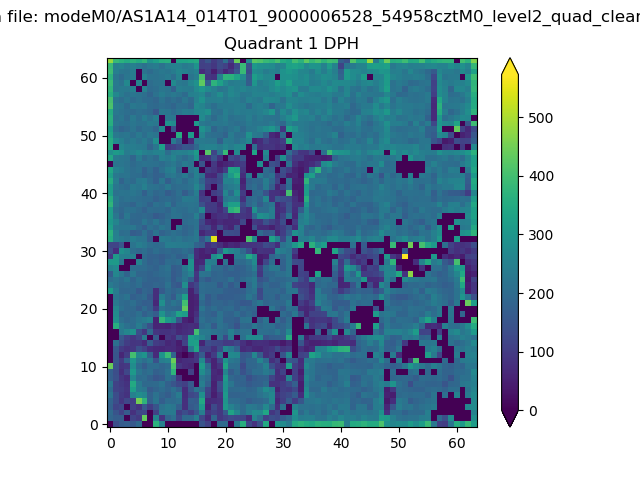 |
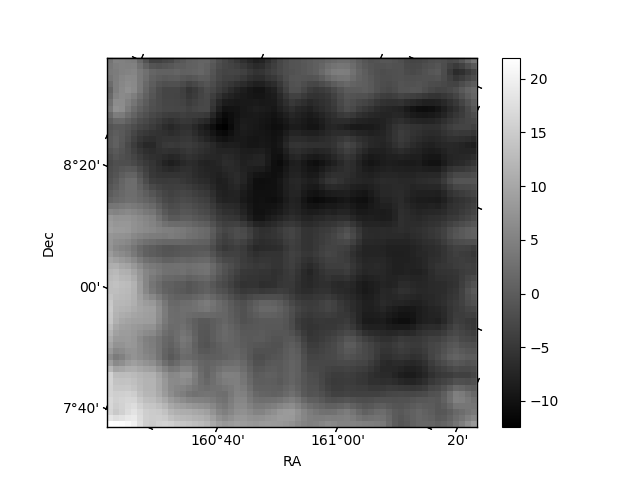
Quadrant B |
|---|---|---|---|
| Quadrant D | 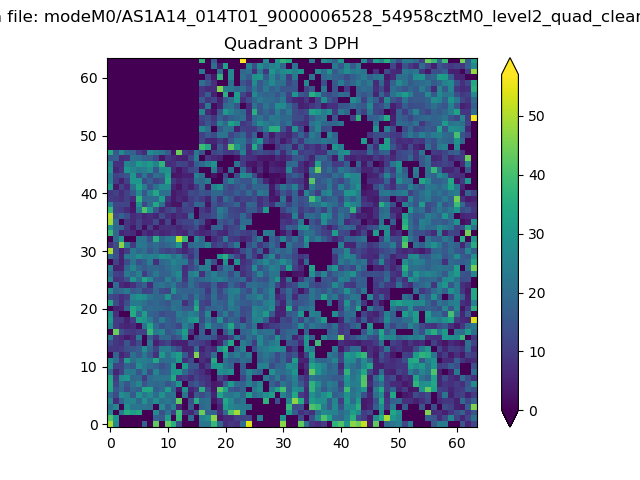 |
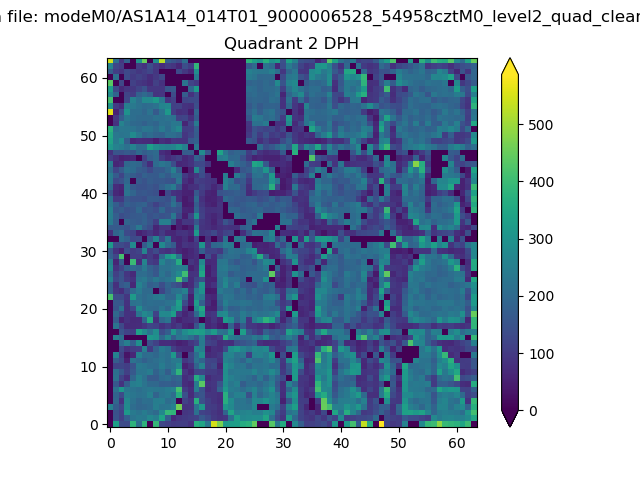 |
Quadrant C |
| Plot type | Count rate plots | Images |
|---|---|---|
| Comparison with Poisson distribution Blue bars denote a histogram of data divided into 1 sec bins. Red curve is a Poisson curve with rate = median count rate of data. |
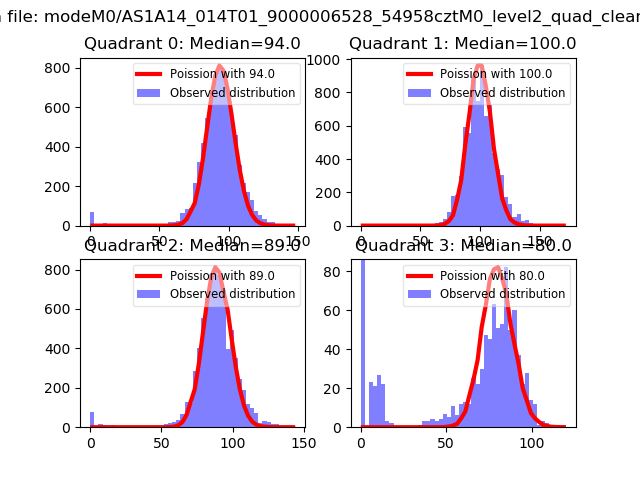 |
 |
| Quadrant-wise count rates Data is divided into 100 sec bins |
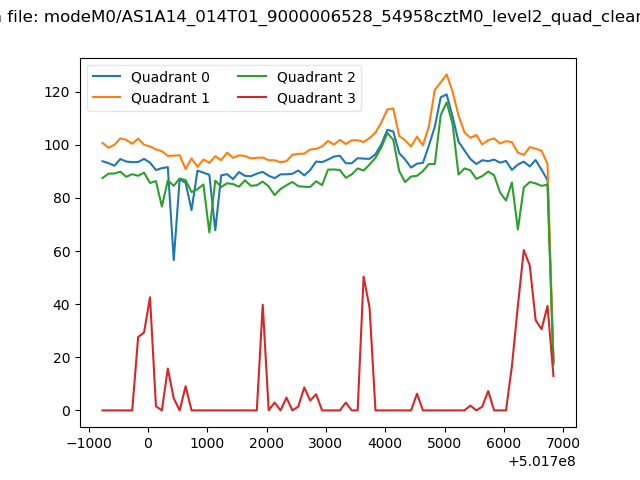 |
|
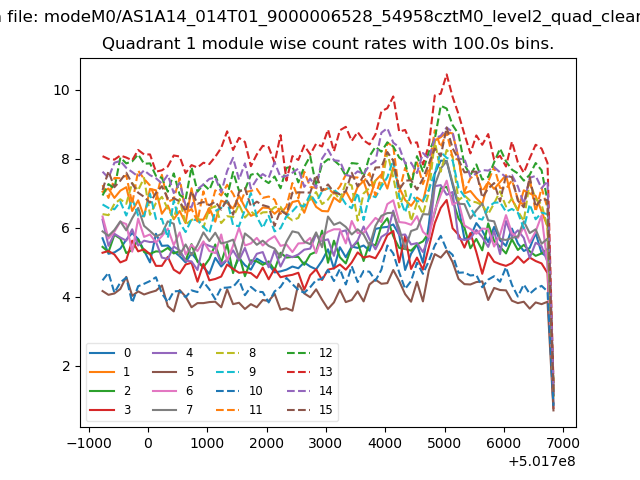
| Module-wise count rates for Quadrant A Data is divided into 100 sec bins |
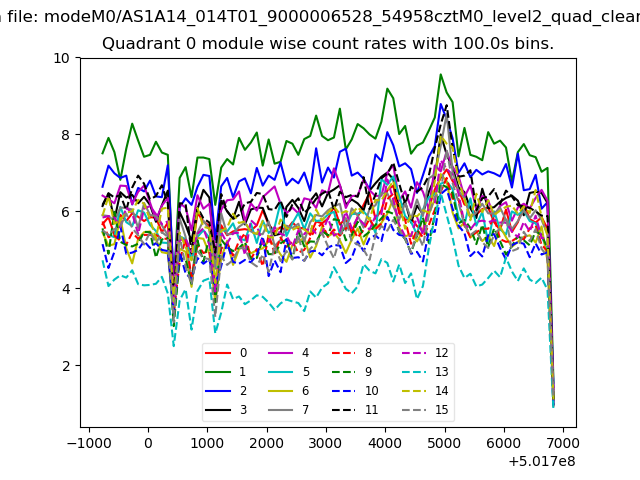 |
 |
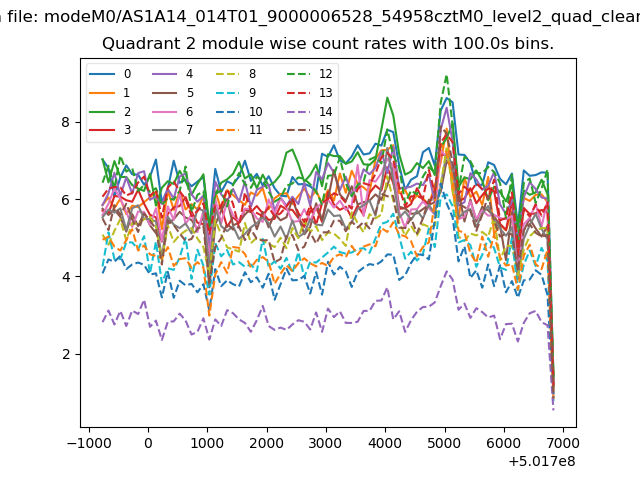
| Module-wise count rates for Quadrant B Data is divided into 100 sec bins |
 |
 |
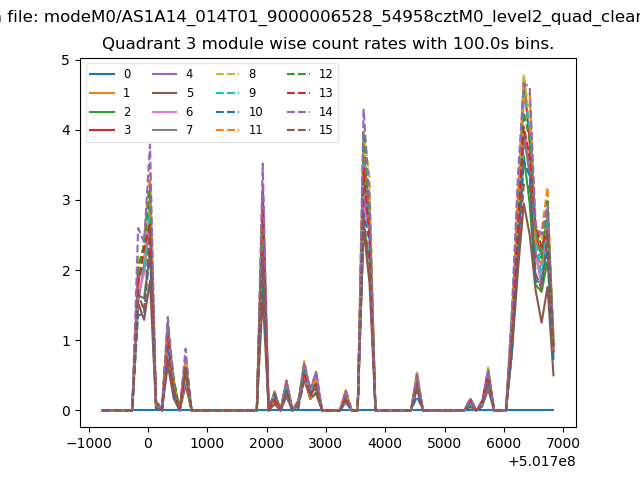
| Module-wise count rates for Quadrant C Data is divided into 100 sec bins |
 |
 |
| Module-wise count rates for Quadrant D Data is divided into 100 sec bins |
 |
 |
| Parameter | Plot |
|---|---|
| CZT HV Monitor | 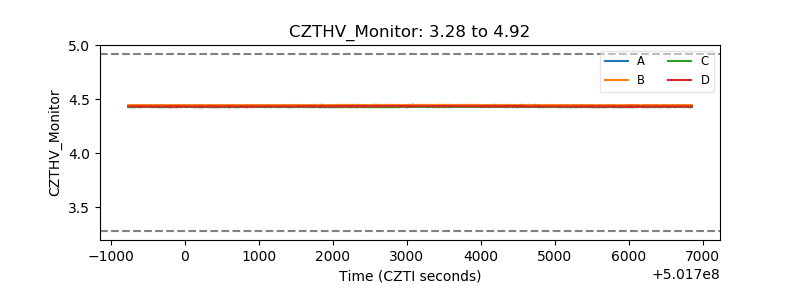 |
| D_VDD | 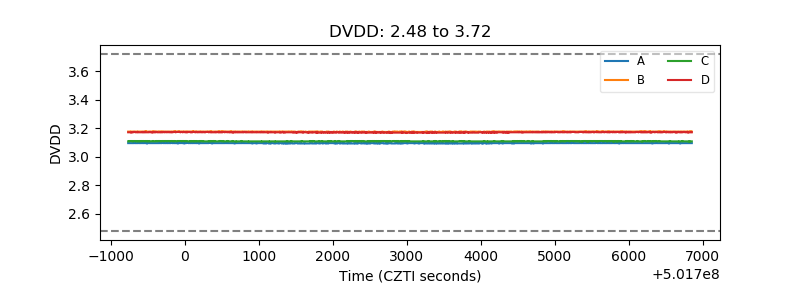 |
| Temperature 1 | 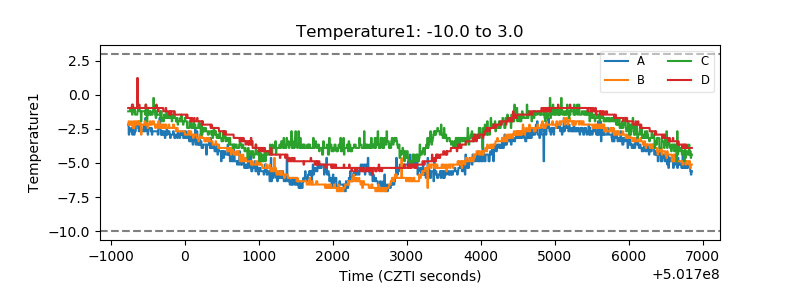 |
| Veto HV Monitor | 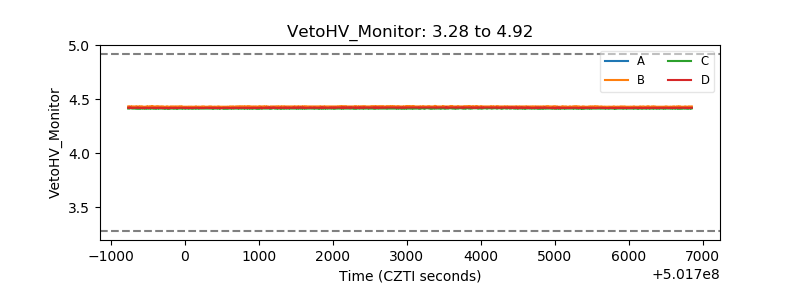 |
| Veto LLD | 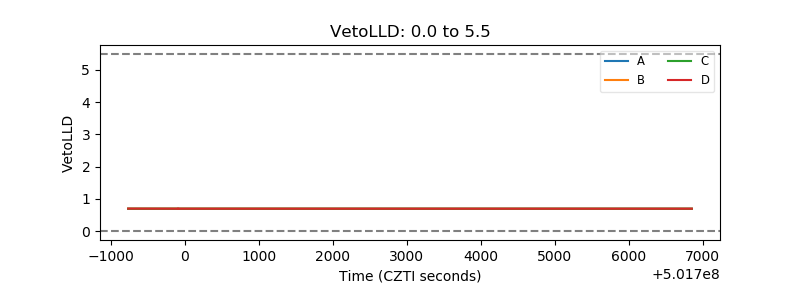 |
| Alpha Counter | 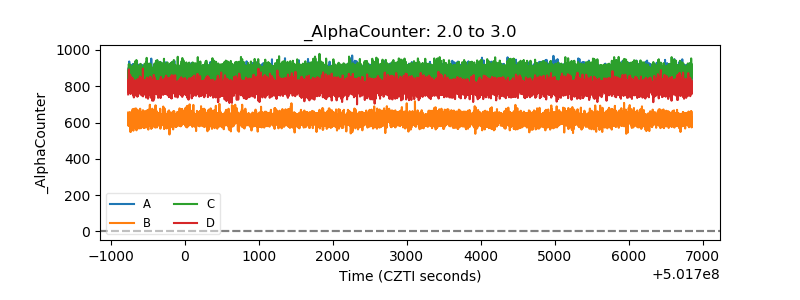 |
| _CPM_Rate | 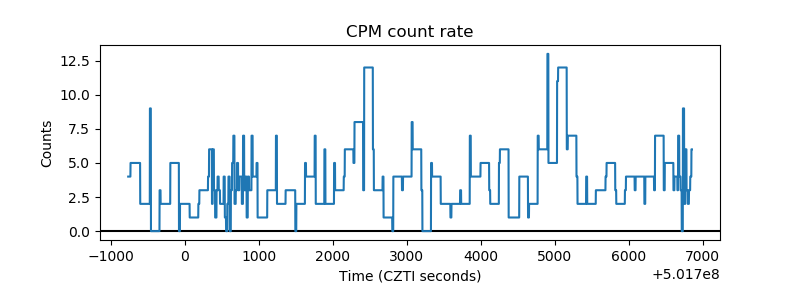 |
| CZT Counter | 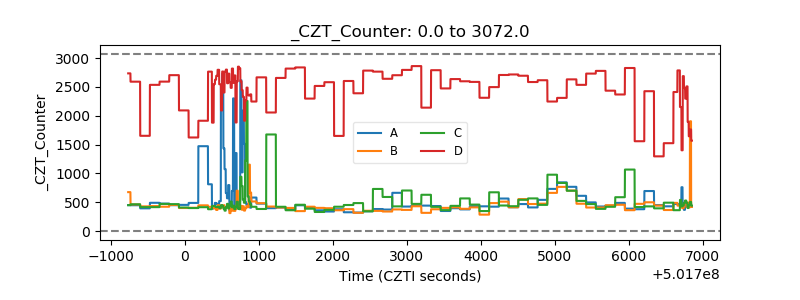 |
| +2.5 Volts monitor |  |
| +5 Volts monitor | 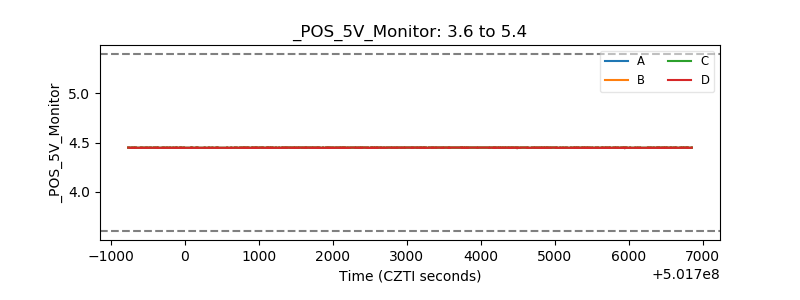 |
| _ROLL_ROT | 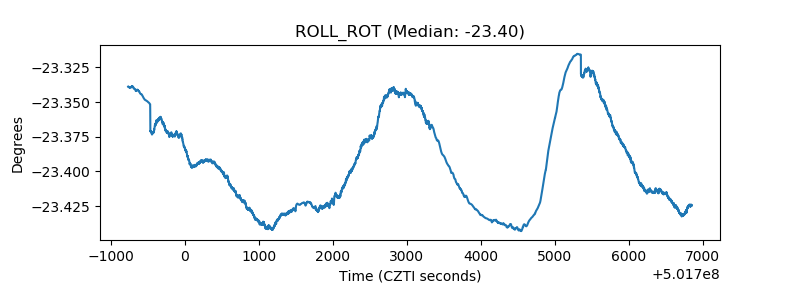 |
| _Roll_DEC | 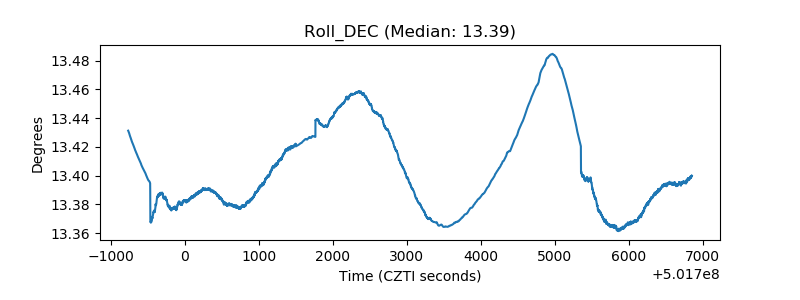 |
| _Roll_RA | 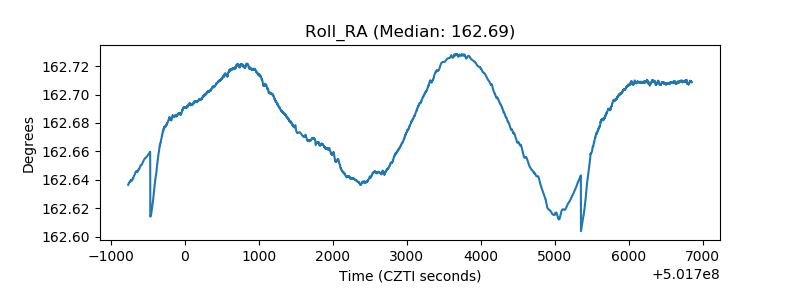 |
| Veto Counter | 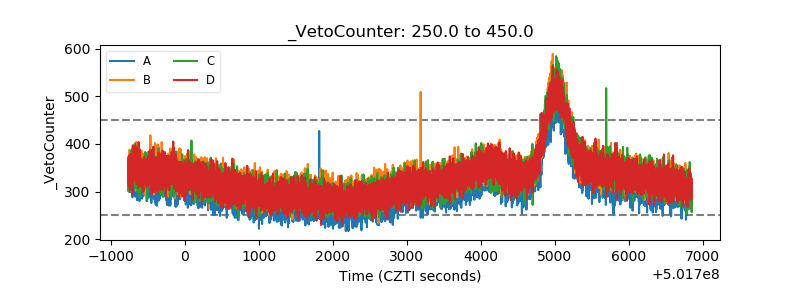 |