| Param | Original file | Final file |
|---|---|---|
| Filename | modeM0/AS1A14_014T01_9000006528_54964cztM0_level2.fits | modeM0/AS1A14_014T01_9000006528_54964cztM0_level2_quad_clean.evt |
| Size (bytes) | 4,655,928,960 | 501,857,280 |
| Size | 4.3 GB | 478.6 MB |
| Events in quadrant A | 23,583,968 | 3,830,155 |
| Events in quadrant B | 19,441,951 | 4,249,943 |
| Events in quadrant C | 22,053,364 | 3,761,813 |
| Events in quadrant D | 103,996,850 | 448,256 |
| Mode M0 | |||
|---|---|---|---|
| Quadrant | BADHDUFLAG | Total packets | Discarded packets |
| A | 0 | 101507 | 5 |
| B | 0 | 90177 | 5 |
| C | 0 | 96617 | 5 |
| D | 0 | 338088 | 7 |
| Mode SS | |||
|---|---|---|---|
| Quadrant | BADHDUFLAG | Total packets | Discarded packets |
| A | 0 | 852 | 0 |
| B | 0 | 852 | 0 |
| C | 0 | 852 | 0 |
| D | 0 | 852 | 0 |
| Mode M9 | |||
|---|---|---|---|
| Quadrant | BADHDUFLAG | Total packets | Discarded packets |
| A | 0 | 28 | 0 |
| B | 0 | 28 | 0 |
| C | 0 | 28 | 0 |
| D | 0 | 28 | 0 |
| Quadrant | Total seconds | Saturated seconds | Saturation percentage |
|---|---|---|---|
| A | 42295 | 1657 | 3.917721% |
| B | 42297 | 459 | 1.085183% |
| C | 42297 | 621 | 1.468189% |
| D | 42296 | 37664 | 89.048610% |
Noise dominated data is calculated using 1-second bins in cleaned event files. If a bin has >2000 counts, and if more than 50% of those come from <1% of pixels, then it is considered to be noise-dominated and hence unusable.
| Quadrant | # 1 sec bins | Bins with >0 counts | Bins with >2000 counts | High rate bins dominated by noise | Noise dominated (total time) | Noise dominated (detector-on time) | Marked lightcurve |
|---|---|---|---|---|---|---|---|
| A | 50328 | 42301 | 1360 | 1360 | 2.70% | 3.22% | 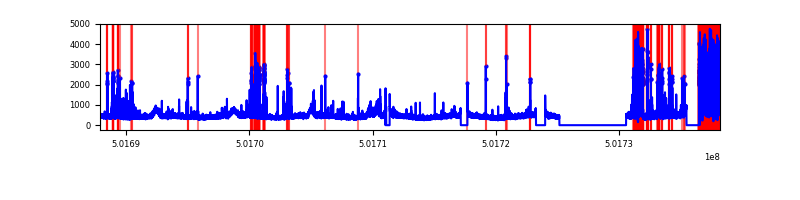 |
| B | 50329 | 42302 | 155 | 155 | 0.31% | 0.37% | 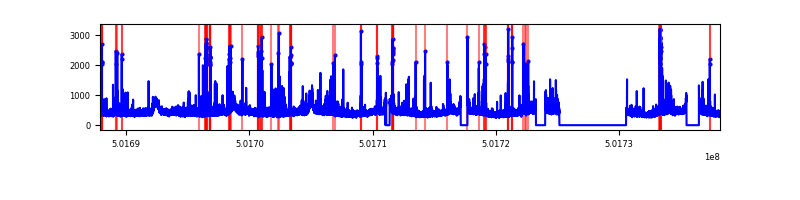 |
| C | 50329 | 42302 | 461 | 461 | 0.92% | 1.09% | 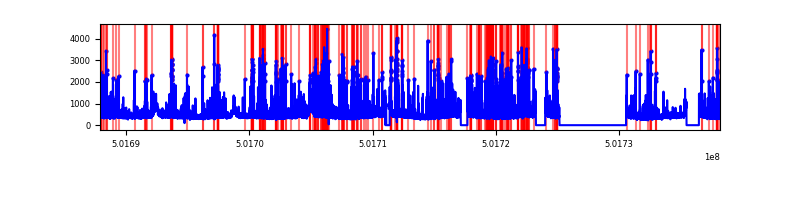 |
| D | 50329 | 42301 | 36126 | 36126 | 71.78% | 85.40% | 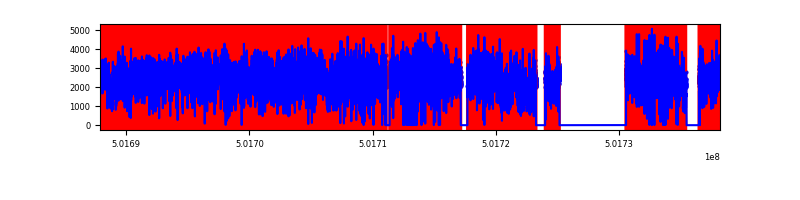 |
Top three noisy pixels from each quadrant. If the there are fewer than three noisy pixels in the level2.evt file, extra rows are filled as -1
| Pixel properties | Quadrant properties | ||||||
|---|---|---|---|---|---|---|---|
| Quadrant | DetID | PixID | Counts | Sigma | Mean | Median | Sigma |
| A | 15 | 32 | 4133425 | 3806.32 | 4432 | 4324 | 1084.8 |
| A | 0 | 8 | 1061983 | 974.98 | 4432 | 4324 | 1084.8 |
| A | 4 | 3 | 323117 | 293.87 | 4432 | 4324 | 1084.8 |
| B | 5 | 185 | 670740 | 699.15 | 4467 | 4292 | 953.2 |
| B | 5 | 172 | 285703 | 295.22 | 4467 | 4292 | 953.2 |
| B | 7 | 252 | 196215 | 201.34 | 4467 | 4292 | 953.2 |
| C | 4 | 5 | 1767745 | 1453.87 | 4396 | 4360 | 1212.9 |
| C | 12 | 252 | 646721 | 529.61 | 4396 | 4360 | 1212.9 |
| C | 14 | 254 | 624428 | 511.23 | 4396 | 4360 | 1212.9 |
| D | 15 | 94 | 93318474 | 192231.2 | 1694 | 1618 | 485.4 |
| D | 2 | 249 | 1026763 | 2111.78 | 1694 | 1618 | 485.4 |
| D | 3 | 12 | 657756 | 1351.63 | 1694 | 1618 | 485.4 |
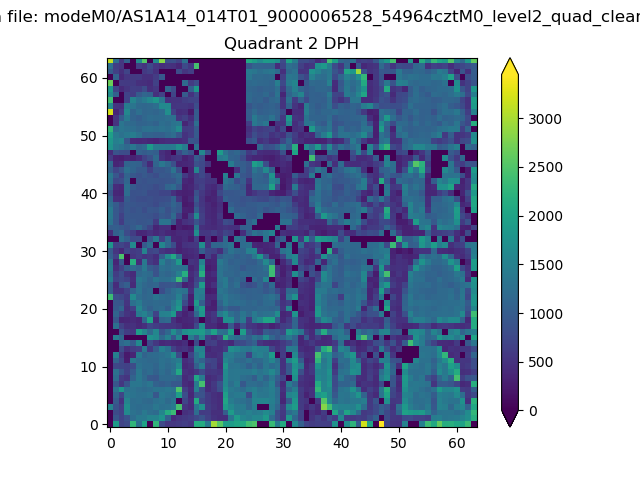
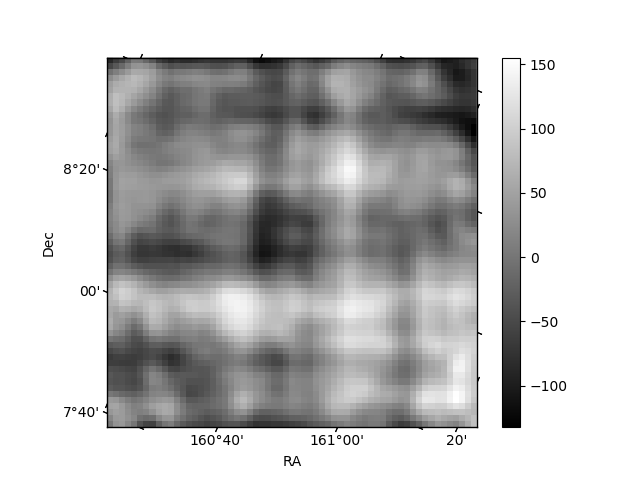
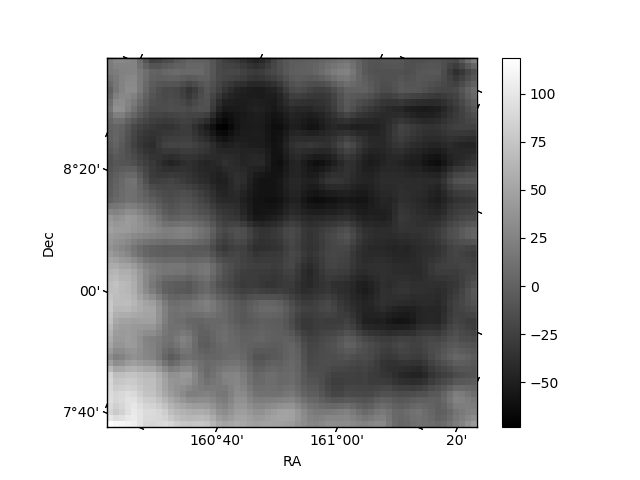
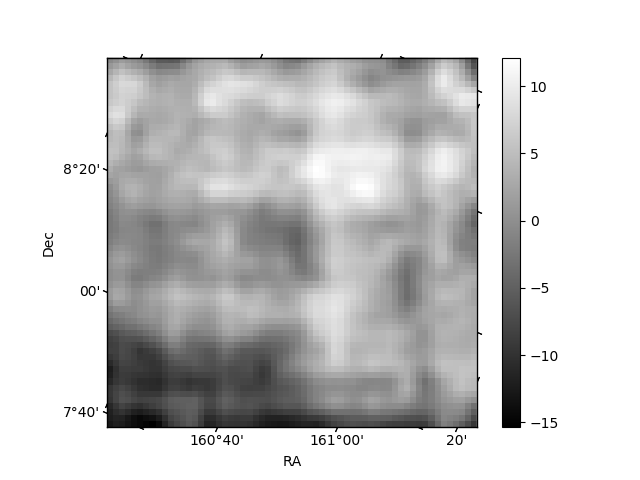
Histogram calculated using DETX and DETY for each event in the final _common_clean file
| Quadrant A | 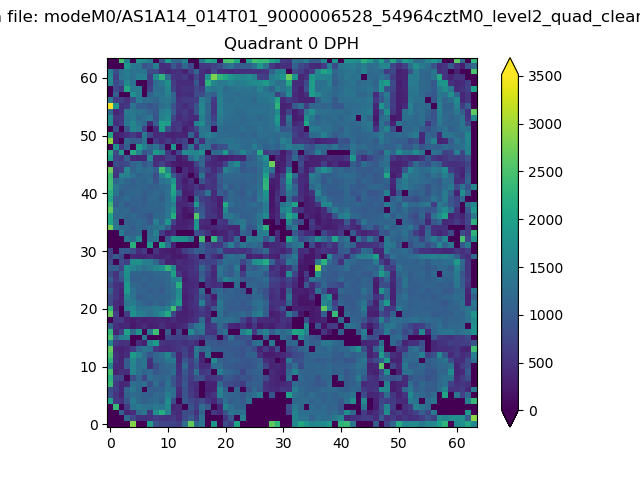 |
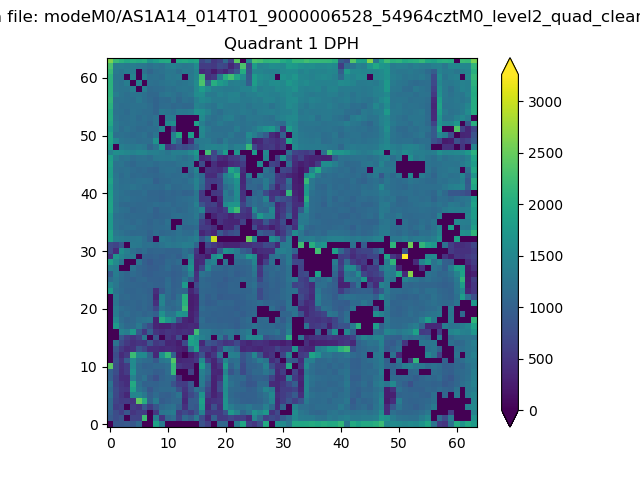 |
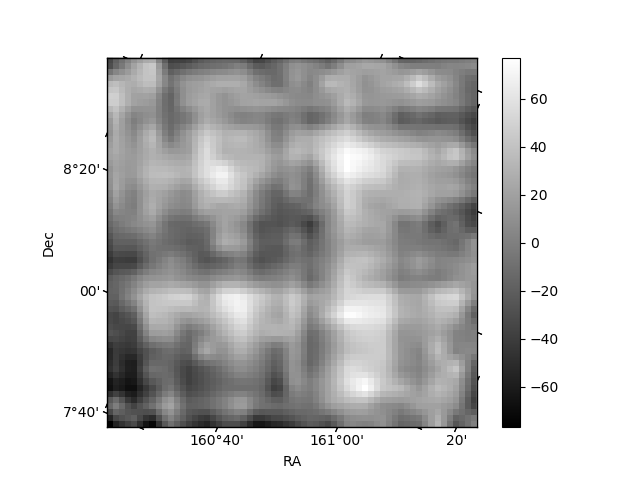
Quadrant B |
|---|---|---|---|
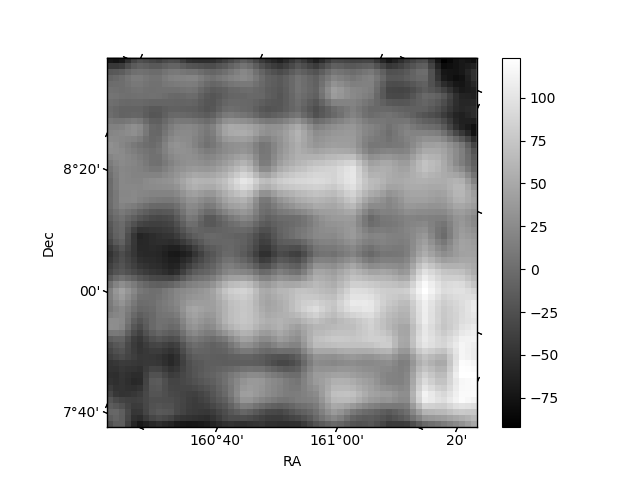
| Quadrant D | 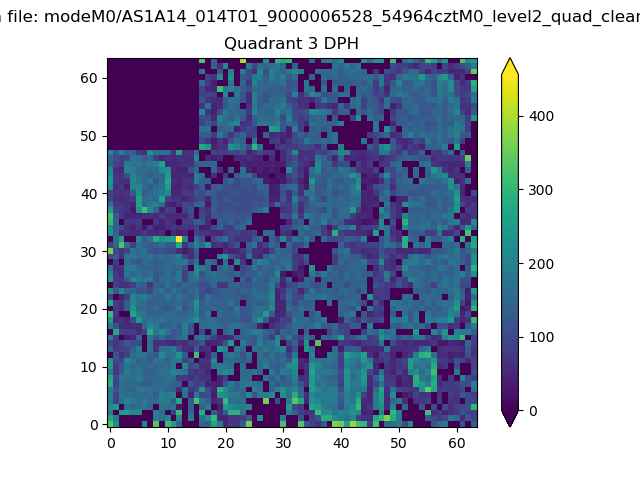 |
 |
Quadrant C |
| Plot type | Count rate plots | Images |
|---|---|---|
| Comparison with Poisson distribution Blue bars denote a histogram of data divided into 1 sec bins. Red curve is a Poisson curve with rate = median count rate of data. |
 |
 |
| Quadrant-wise count rates Data is divided into 100 sec bins |
 |
|
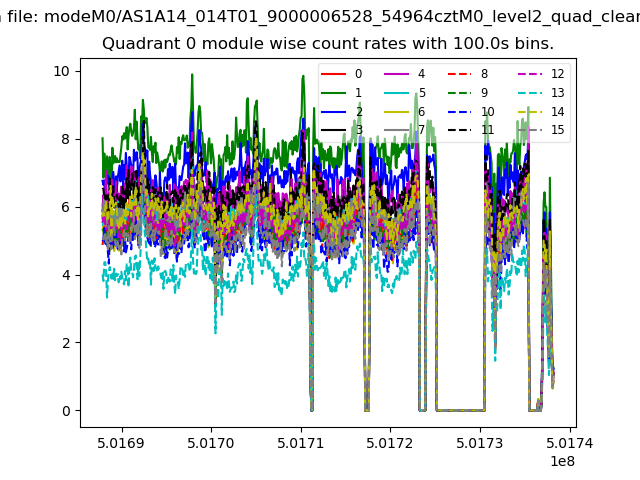
| Module-wise count rates for Quadrant A Data is divided into 100 sec bins |
 |
 |
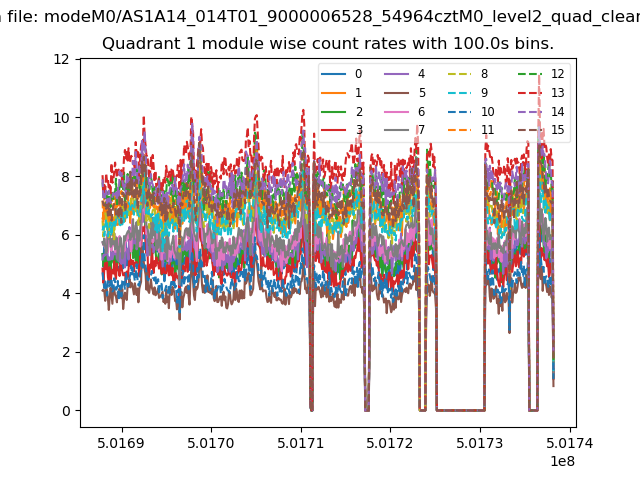
| Module-wise count rates for Quadrant B Data is divided into 100 sec bins |
 |
 |
| Module-wise count rates for Quadrant C Data is divided into 100 sec bins |
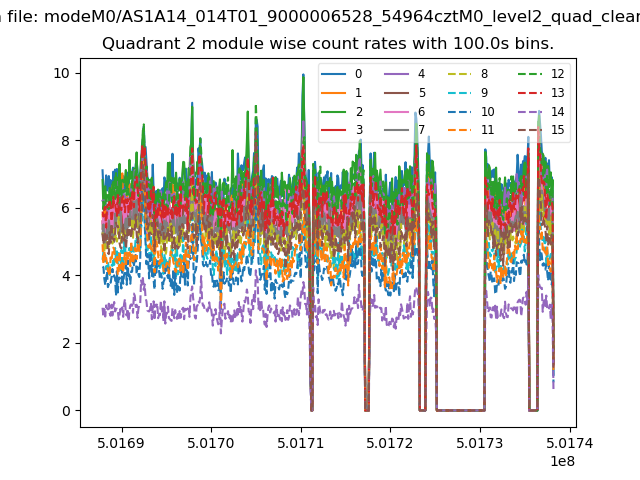 |
 |
| Module-wise count rates for Quadrant D Data is divided into 100 sec bins |
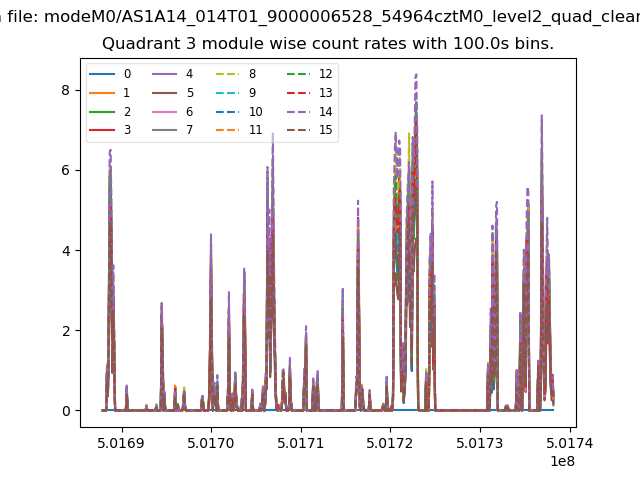 |
 |
| Parameter | Plot |
|---|---|
| CZT HV Monitor | 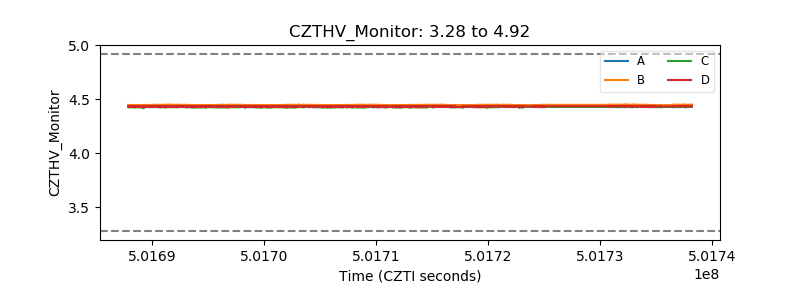 |
| D_VDD | 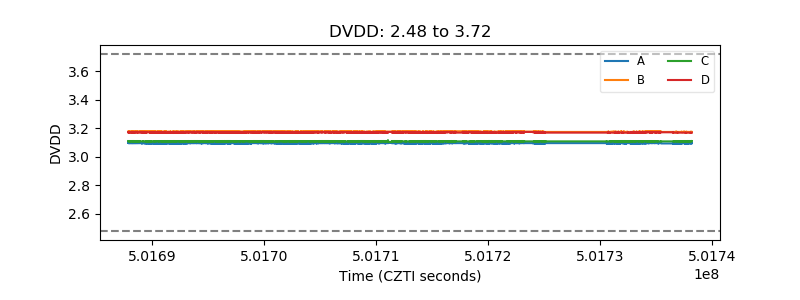 |
| Temperature 1 | 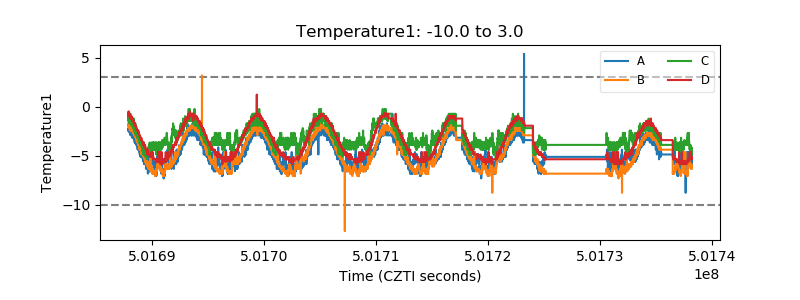 |
| Veto HV Monitor | 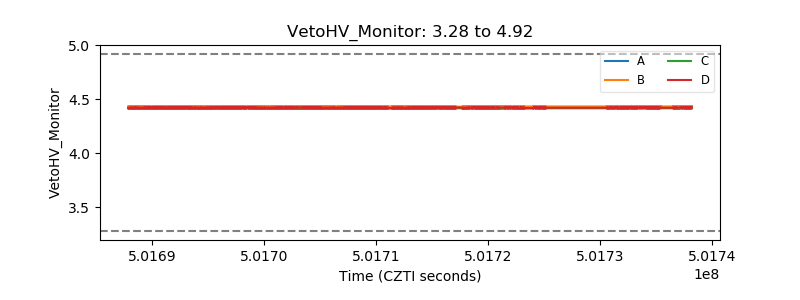 |
| Veto LLD | 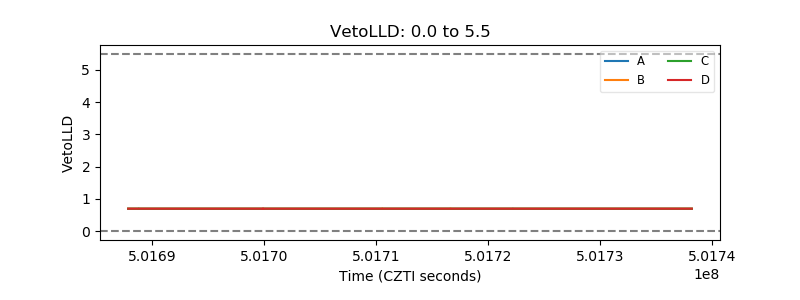 |
| Alpha Counter | 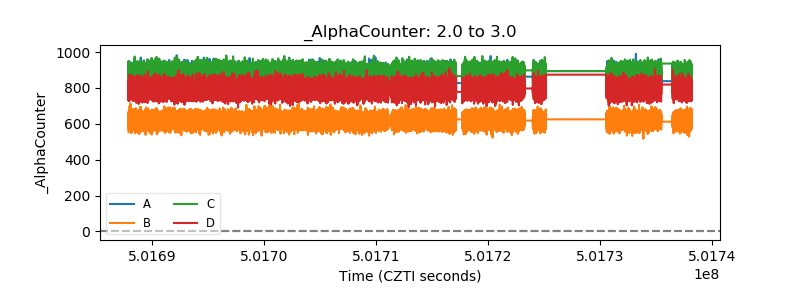 |
| _CPM_Rate | 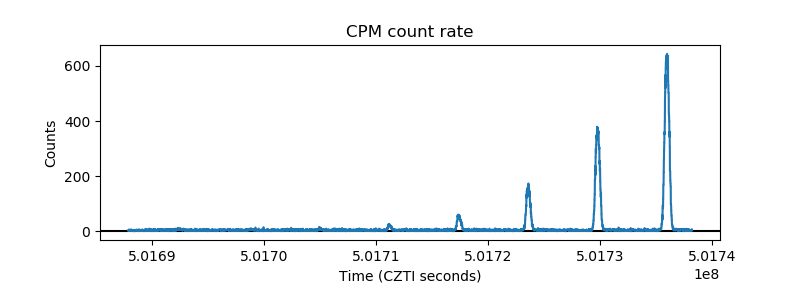 |
| CZT Counter | 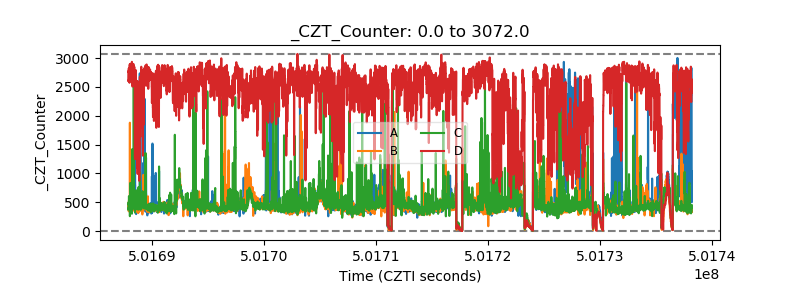 |
| +2.5 Volts monitor |  |
| +5 Volts monitor |  |
| _ROLL_ROT | 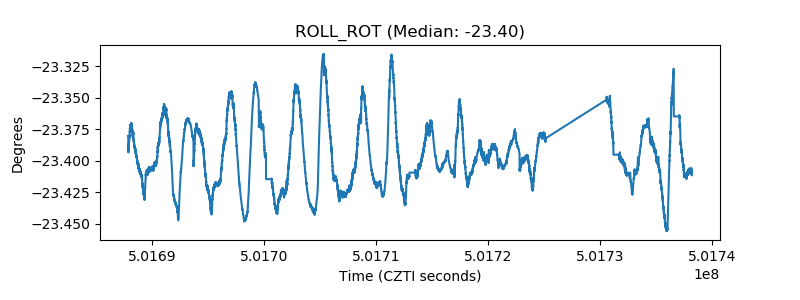 |
| _Roll_DEC | 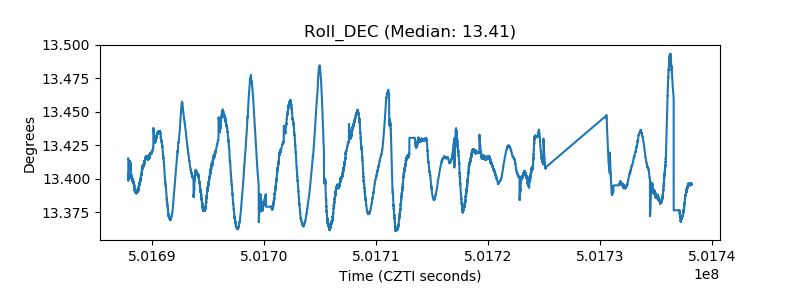 |
| _Roll_RA | 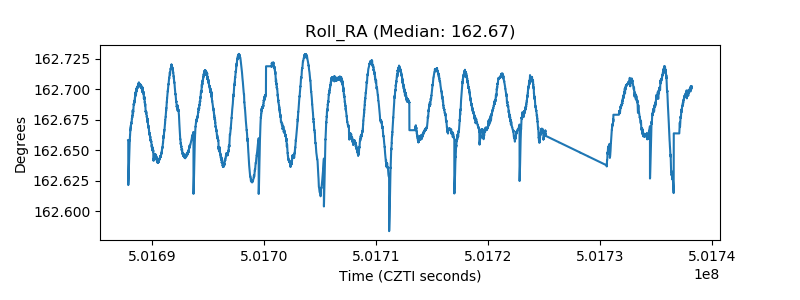 |
| Veto Counter | 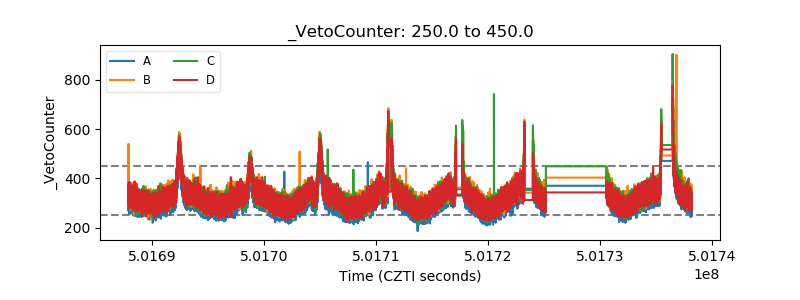 |