| Param | Original file | Final file |
|---|---|---|
| Filename | modeM0/AS1A14_014T01_9000006528_54965cztM0_level2.fits | modeM0/AS1A14_014T01_9000006528_54965cztM0_level2_quad_clean.evt |
| Size (bytes) | 728,138,880 | 74,802,240 |
| Size | 694.4 MB | 71.3 MB |
| Events in quadrant A | 4,990,546 | 543,331 |
| Events in quadrant B | 2,651,049 | 651,229 |
| Events in quadrant C | 3,123,163 | 570,088 |
| Events in quadrant D | 15,704,758 | 66,109 |
| Mode M0 | |||
|---|---|---|---|
| Quadrant | BADHDUFLAG | Total packets | Discarded packets |
| A | 0 | 19171 | 1 |
| B | 0 | 12752 | 1 |
| C | 0 | 14005 | 1 |
| D | 0 | 50966 | 1 |
| Mode SS | |||
|---|---|---|---|
| Quadrant | BADHDUFLAG | Total packets | Discarded packets |
| A | 0 | 126 | 0 |
| B | 0 | 126 | 0 |
| C | 0 | 126 | 0 |
| D | 0 | 126 | 0 |
| Mode M9 | |||
|---|---|---|---|
| Quadrant | BADHDUFLAG | Total packets | Discarded packets |
| A | 0 | 11 | 0 |
| B | 0 | 11 | 0 |
| C | 0 | 11 | 0 |
| D | 0 | 11 | 0 |
| Quadrant | Total seconds | Saturated seconds | Saturation percentage |
|---|---|---|---|
| A | 6221 | 684 | 10.995017% |
| B | 6222 | 37 | 0.594664% |
| C | 6222 | 106 | 1.703632% |
| D | 6222 | 5569 | 89.504982% |
Noise dominated data is calculated using 1-second bins in cleaned event files. If a bin has >2000 counts, and if more than 50% of those come from <1% of pixels, then it is considered to be noise-dominated and hence unusable.
| Quadrant | # 1 sec bins | Bins with >0 counts | Bins with >2000 counts | High rate bins dominated by noise | Noise dominated (total time) | Noise dominated (detector-on time) | Marked lightcurve |
|---|---|---|---|---|---|---|---|
| A | 7311 | 6222 | 606 | 606 | 8.29% | 9.74% | 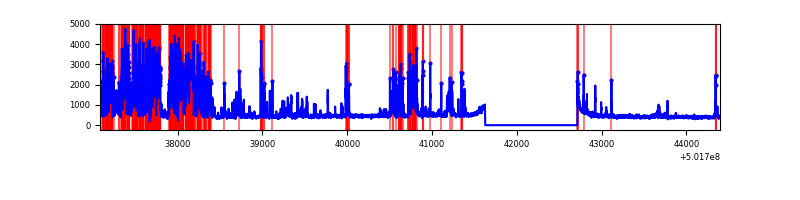 |
| B | 7312 | 6223 | 3 | 3 | 0.04% | 0.05% |  |
| C | 7312 | 6223 | 78 | 78 | 1.07% | 1.25% | 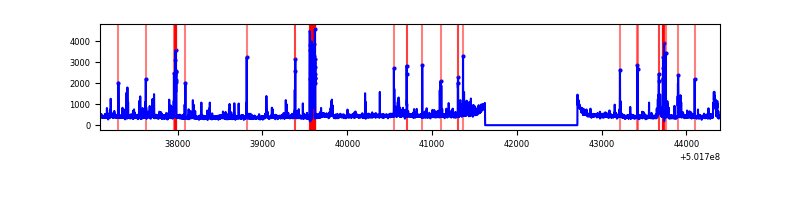 |
| D | 7312 | 6222 | 5551 | 5551 | 75.92% | 89.22% | 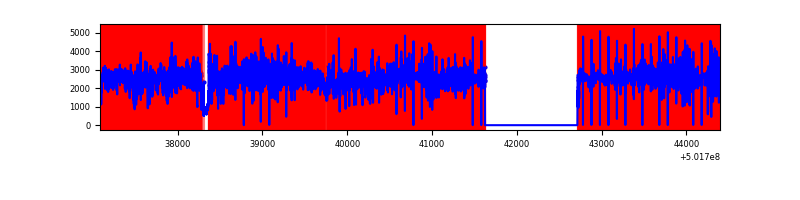 |
Top three noisy pixels from each quadrant. If the there are fewer than three noisy pixels in the level2.evt file, extra rows are filled as -1
| Pixel properties | Quadrant properties | ||||||
|---|---|---|---|---|---|---|---|
| Quadrant | DetID | PixID | Counts | Sigma | Mean | Median | Sigma |
| A | 15 | 32 | 2021638 | 12880.79 | 628 | 612 | 156.9 |
| A | 0 | 8 | 305245 | 1941.55 | 628 | 612 | 156.9 |
| A | 3 | 14 | 86310 | 546.19 | 628 | 612 | 156.9 |
| B | 4 | 141 | 34206 | 236.35 | 655 | 633 | 142.0 |
| B | 12 | 111 | 17070 | 115.72 | 655 | 633 | 142.0 |
| B | 11 | 111 | 15913 | 107.57 | 655 | 633 | 142.0 |
| C | 14 | 254 | 161058 | 915.81 | 637 | 632 | 175.2 |
| C | 4 | 5 | 134835 | 766.11 | 637 | 632 | 175.2 |
| C | 15 | 199 | 122969 | 698.37 | 637 | 632 | 175.2 |
| D | 15 | 94 | 13772544 | 165541.39 | 285 | 272 | 83.2 |
| D | 3 | 12 | 297963 | 3578.21 | 285 | 272 | 83.2 |
| D | 2 | 249 | 244568 | 2936.41 | 285 | 272 | 83.2 |
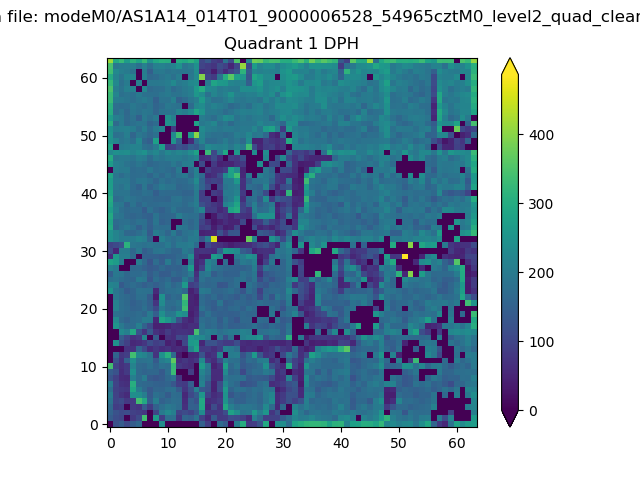
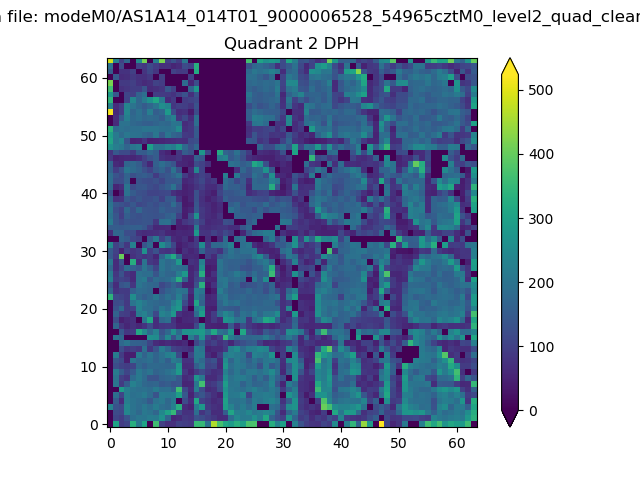
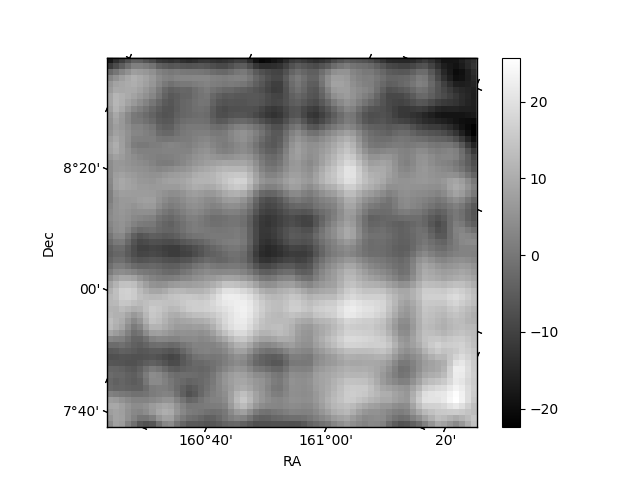
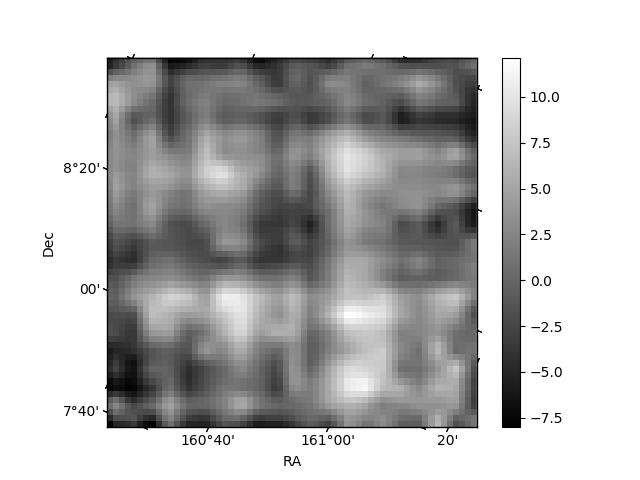
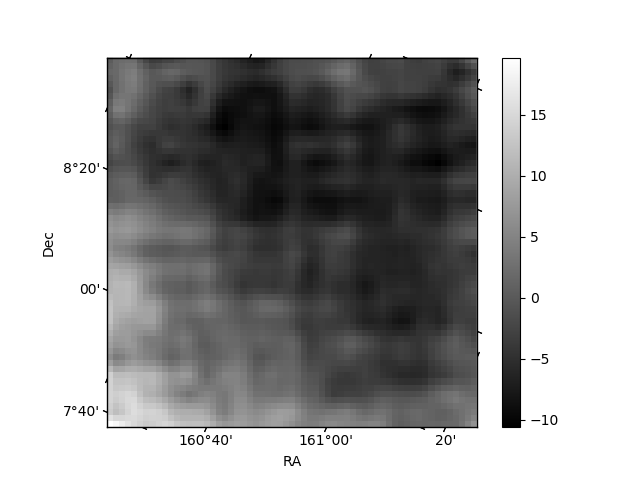
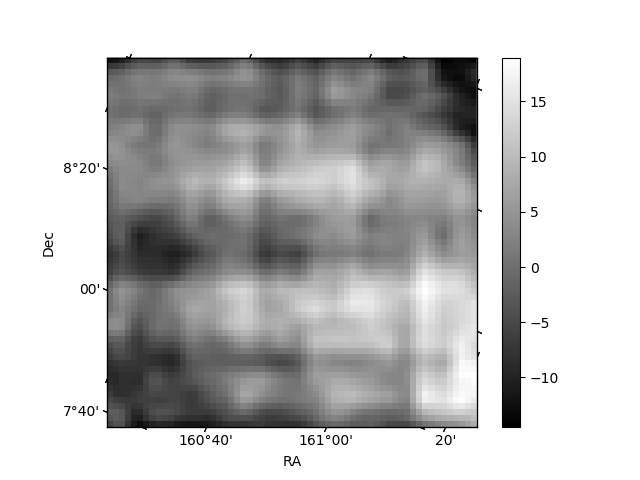
Histogram calculated using DETX and DETY for each event in the final _common_clean file
| Quadrant A | 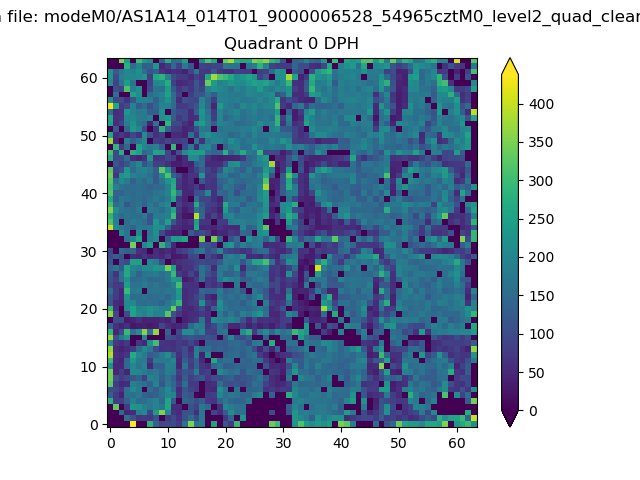 |
 |
Quadrant B |
|---|---|---|---|
| Quadrant D | 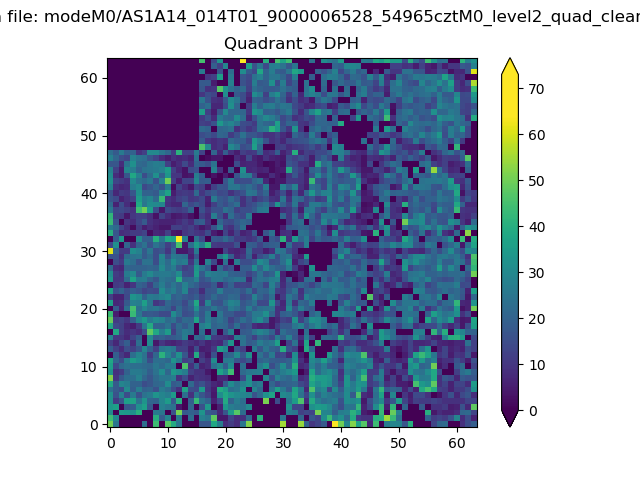 |
 |
Quadrant C |
| Plot type | Count rate plots | Images |
|---|---|---|
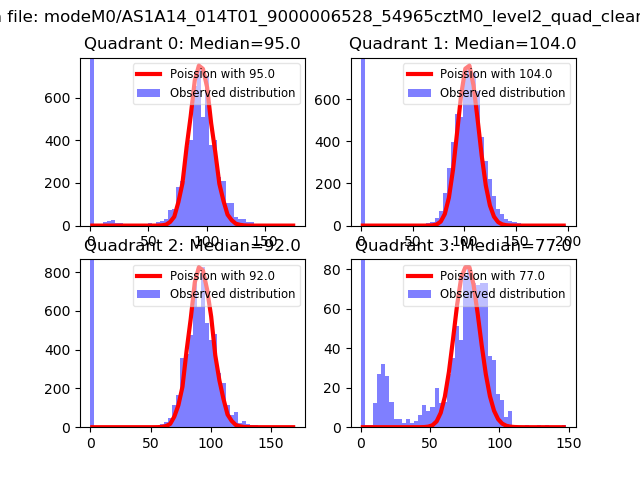
| Comparison with Poisson distribution Blue bars denote a histogram of data divided into 1 sec bins. Red curve is a Poisson curve with rate = median count rate of data. |
 |
 |
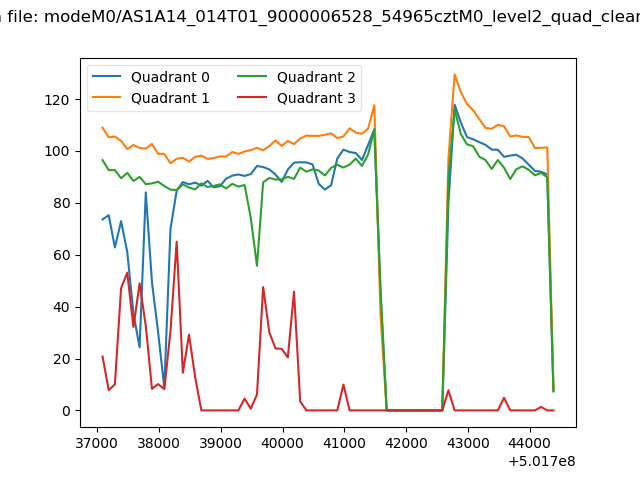
| Quadrant-wise count rates Data is divided into 100 sec bins |
 |
|
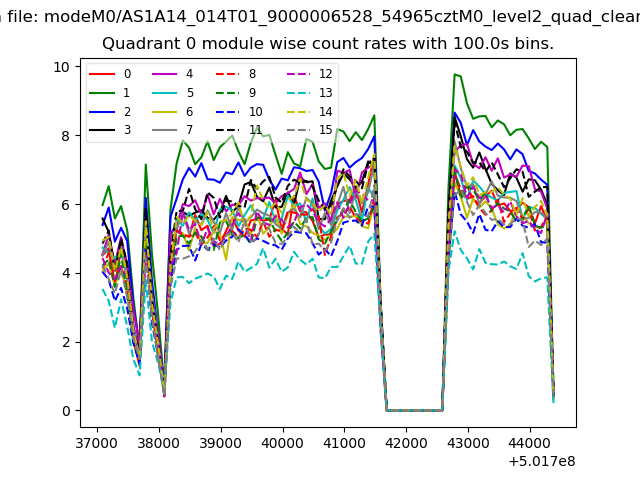
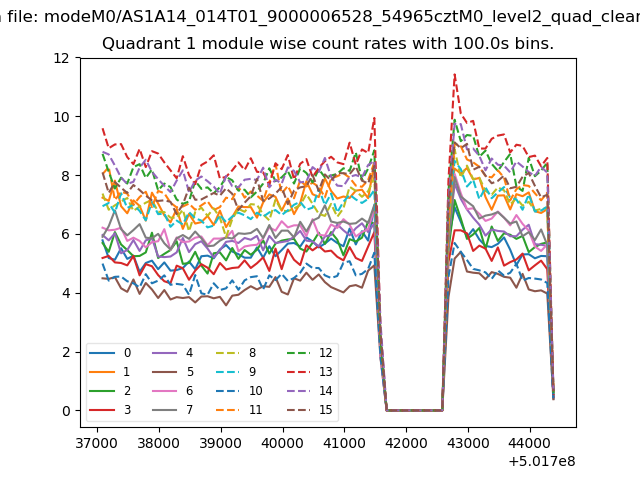
| Module-wise count rates for Quadrant A Data is divided into 100 sec bins |
 |
 |
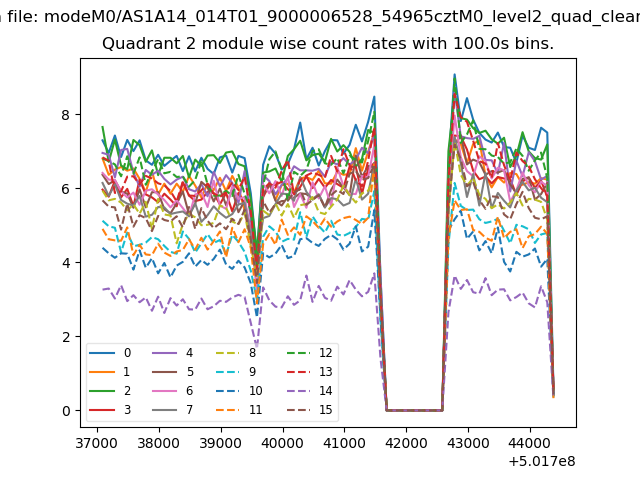
| Module-wise count rates for Quadrant B Data is divided into 100 sec bins |
 |
 |
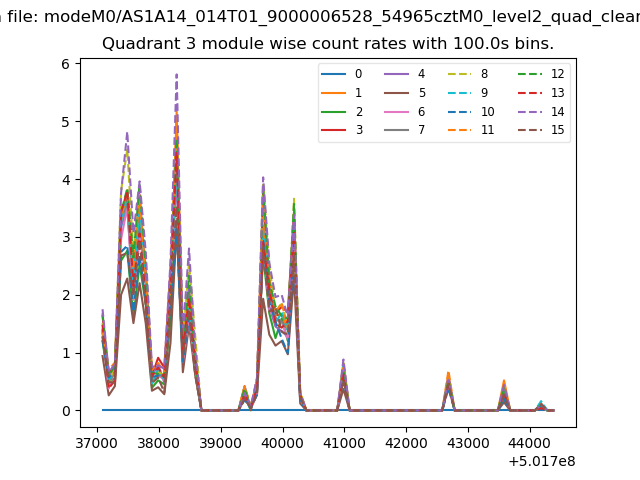
| Module-wise count rates for Quadrant C Data is divided into 100 sec bins |
 |
 |
| Module-wise count rates for Quadrant D Data is divided into 100 sec bins |
 |
 |
| Parameter | Plot |
|---|---|
| CZT HV Monitor | 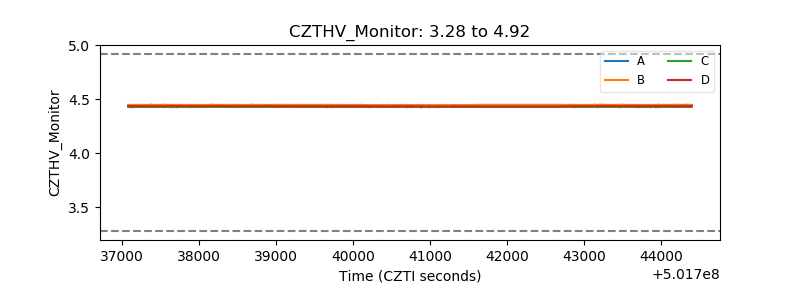 |
| D_VDD | 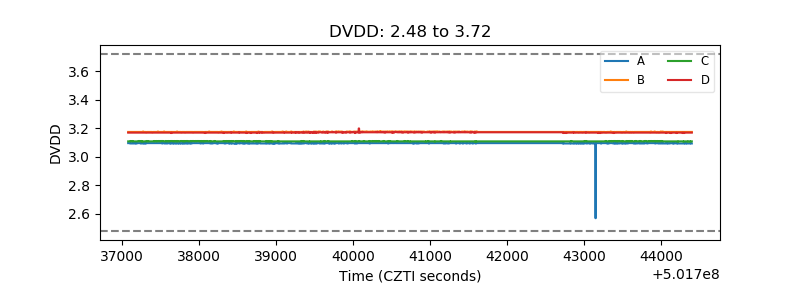 |
| Temperature 1 | 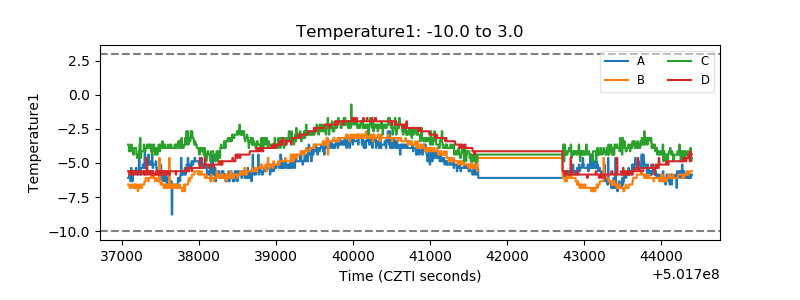 |
| Veto HV Monitor | 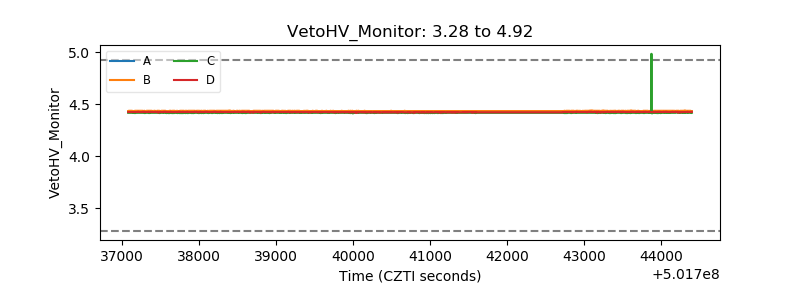 |
| Veto LLD | 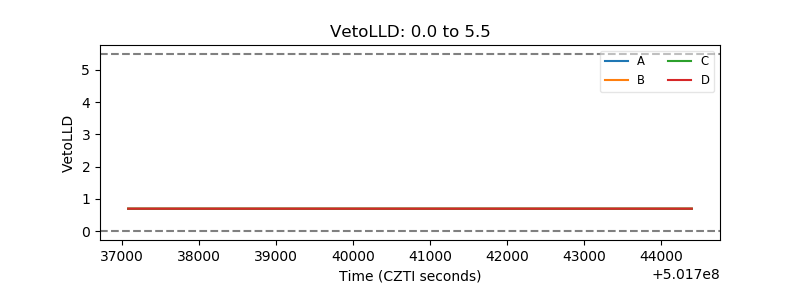 |
| Alpha Counter | 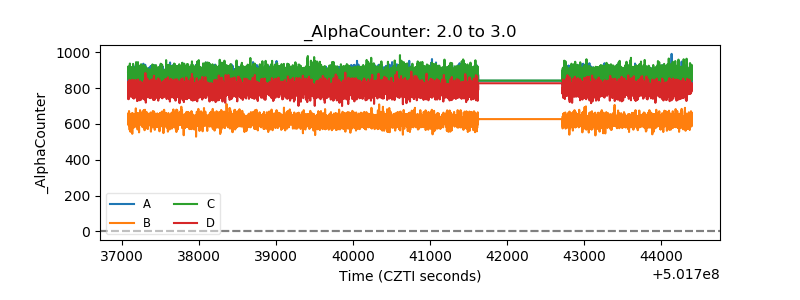 |
| _CPM_Rate | 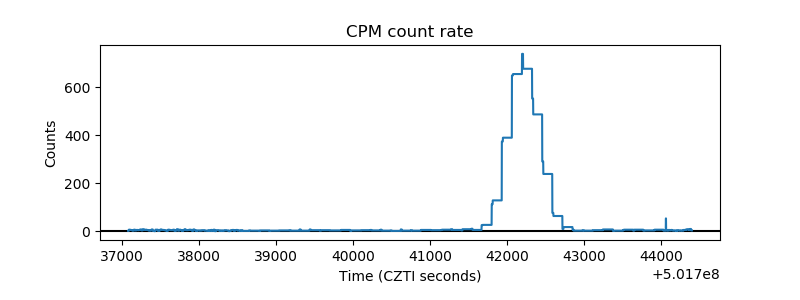 |
| CZT Counter | 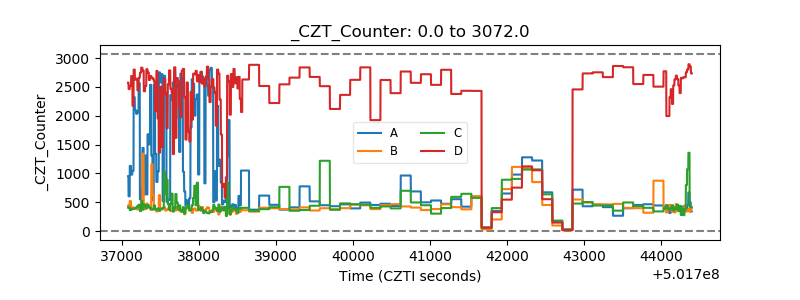 |
| +2.5 Volts monitor |  |
| +5 Volts monitor |  |
| _ROLL_ROT | 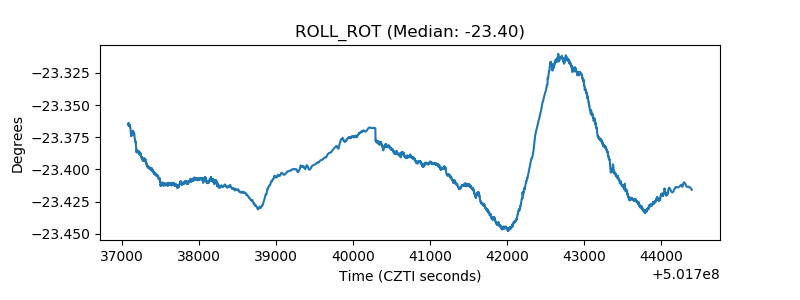 |
| _Roll_DEC | 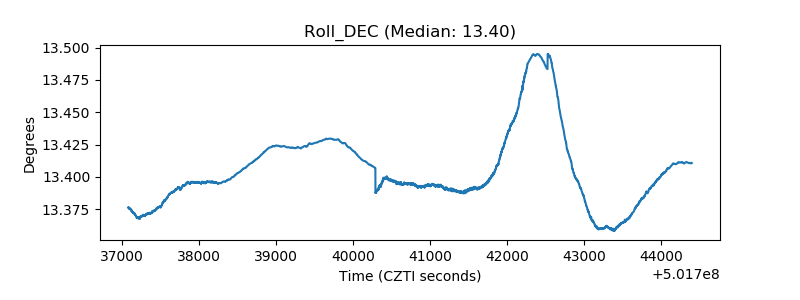 |
| _Roll_RA |  |
| Veto Counter | 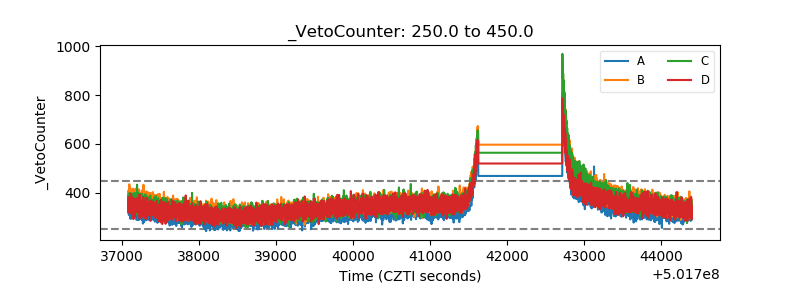 |