| Param | Original file | Final file |
|---|---|---|
| Filename | modeM0/AS1A14_014T01_9000006528_54966cztM0_level2.fits | modeM0/AS1A14_014T01_9000006528_54966cztM0_level2_quad_clean.evt |
| Size (bytes) | 653,955,840 | 72,463,680 |
| Size | 623.7 MB | 69.1 MB |
| Events in quadrant A | 3,132,342 | 566,692 |
| Events in quadrant B | 2,712,193 | 623,508 |
| Events in quadrant C | 3,644,722 | 542,397 |
| Events in quadrant D | 14,257,388 | 48,534 |
| Mode M0 | |||
|---|---|---|---|
| Quadrant | BADHDUFLAG | Total packets | Discarded packets |
| A | 0 | 13636 | 1 |
| B | 0 | 12435 | 1 |
| C | 0 | 15072 | 1 |
| D | 0 | 46457 | 1 |
| Mode SS | |||
|---|---|---|---|
| Quadrant | BADHDUFLAG | Total packets | Discarded packets |
| A | 0 | 120 | 0 |
| B | 0 | 120 | 0 |
| C | 0 | 120 | 0 |
| D | 0 | 120 | 0 |
| Mode M9 | |||
|---|---|---|---|
| Quadrant | BADHDUFLAG | Total packets | Discarded packets |
| A | 0 | 11 | 0 |
| B | 0 | 11 | 0 |
| C | 0 | 11 | 0 |
| D | 0 | 11 | 0 |
| Quadrant | Total seconds | Saturated seconds | Saturation percentage |
|---|---|---|---|
| A | 5912 | 181 | 3.061570% |
| B | 5912 | 86 | 1.454668% |
| C | 5912 | 213 | 3.602842% |
| D | 5912 | 5430 | 91.847091% |
Noise dominated data is calculated using 1-second bins in cleaned event files. If a bin has >2000 counts, and if more than 50% of those come from <1% of pixels, then it is considered to be noise-dominated and hence unusable.
| Quadrant | # 1 sec bins | Bins with >0 counts | Bins with >2000 counts | High rate bins dominated by noise | Noise dominated (total time) | Noise dominated (detector-on time) | Marked lightcurve |
|---|---|---|---|---|---|---|---|
| A | 7012 | 5913 | 82 | 82 | 1.17% | 1.39% | 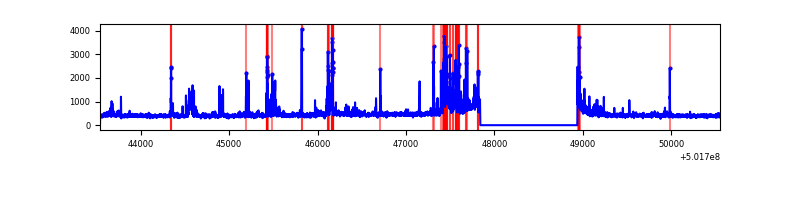 |
| B | 7012 | 5913 | 0 | 0 | 0.00% | 0.00% | 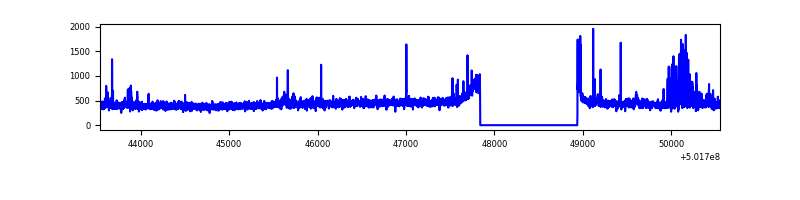 |
| C | 7012 | 5913 | 132 | 132 | 1.88% | 2.23% | 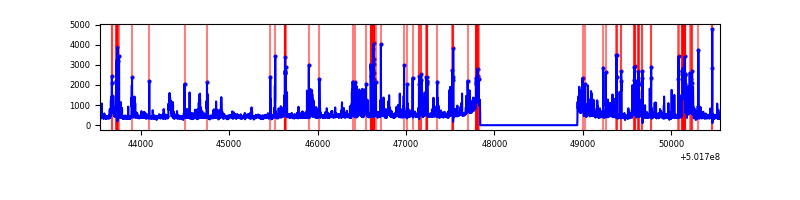 |
| D | 7012 | 5913 | 5085 | 5085 | 72.52% | 86.00% | 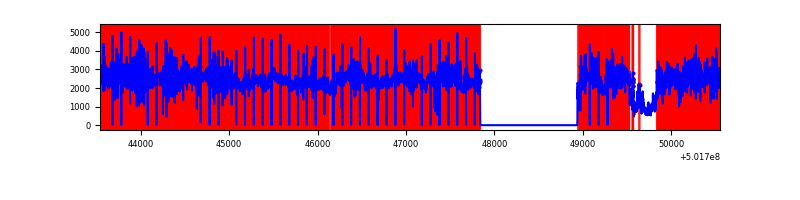 |
Top three noisy pixels from each quadrant. If the there are fewer than three noisy pixels in the level2.evt file, extra rows are filled as -1
| Pixel properties | Quadrant properties | ||||||
|---|---|---|---|---|---|---|---|
| Quadrant | DetID | PixID | Counts | Sigma | Mean | Median | Sigma |
| A | 15 | 32 | 506697 | 3202.79 | 639 | 621 | 158.0 |
| A | 0 | 8 | 92339 | 580.45 | 639 | 621 | 158.0 |
| A | 4 | 3 | 36518 | 227.18 | 639 | 621 | 158.0 |
| B | 5 | 172 | 134583 | 984.87 | 636 | 614 | 136.0 |
| B | 5 | 185 | 24661 | 176.78 | 636 | 614 | 136.0 |
| B | 12 | 111 | 16528 | 116.99 | 636 | 614 | 136.0 |
| C | 4 | 5 | 797399 | 4692.33 | 620 | 613 | 169.8 |
| C | 12 | 252 | 115874 | 678.78 | 620 | 613 | 169.8 |
| C | 6 | 223 | 110127 | 644.94 | 620 | 613 | 169.8 |
| D | 15 | 94 | 13269878 | 241968.49 | 188 | 179 | 54.8 |
| D | 3 | 12 | 66165 | 1203.23 | 188 | 179 | 54.8 |
| D | 3 | 224 | 59075 | 1073.95 | 188 | 179 | 54.8 |
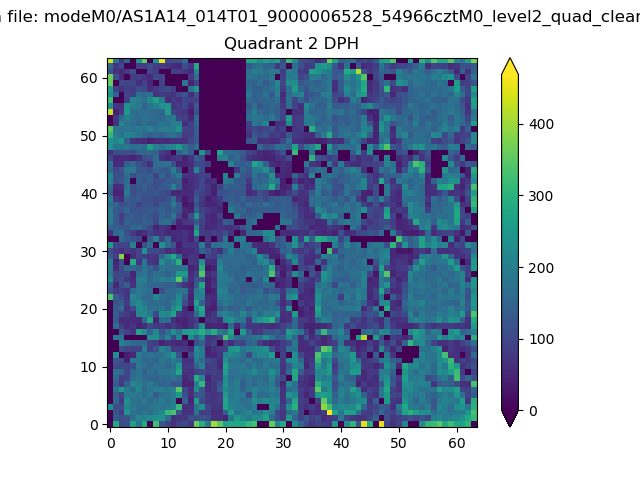
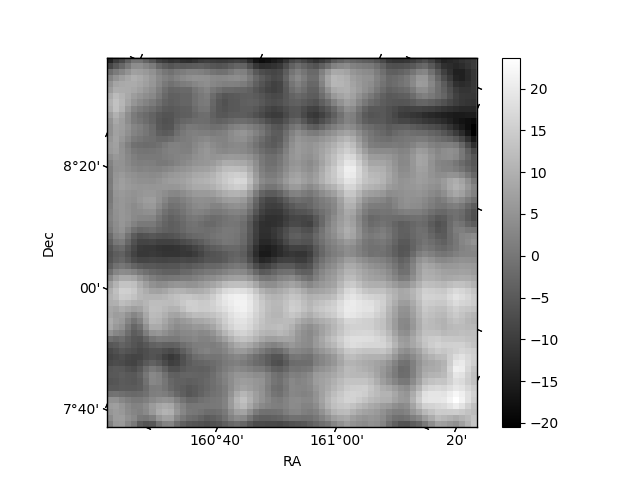
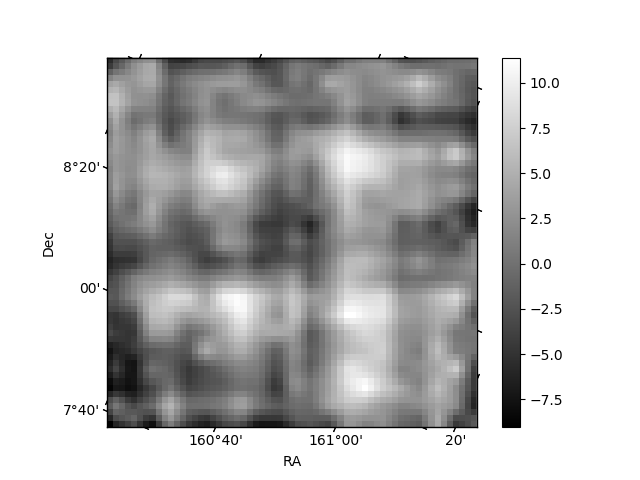
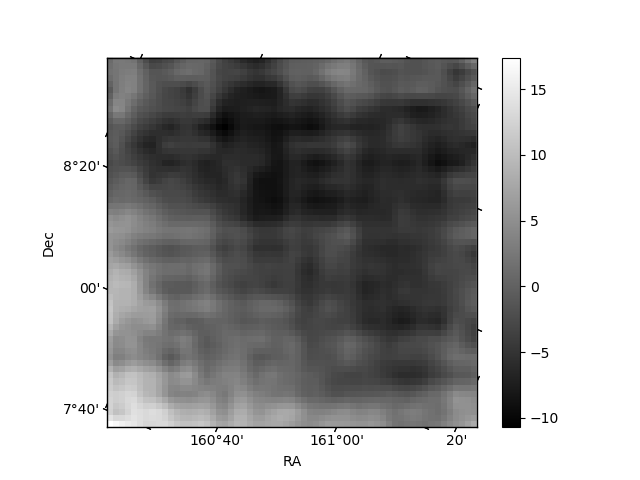
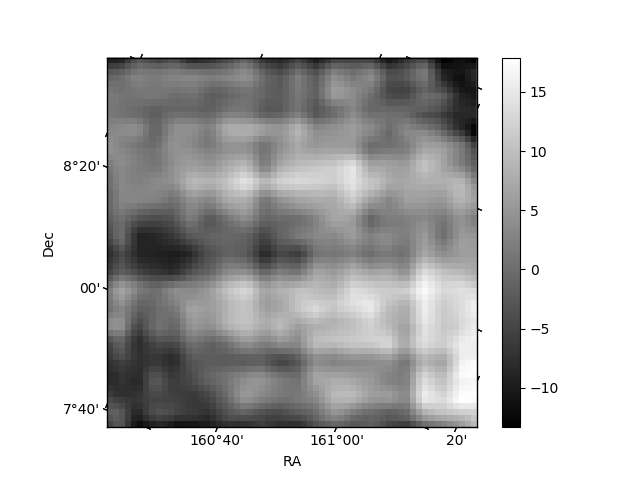
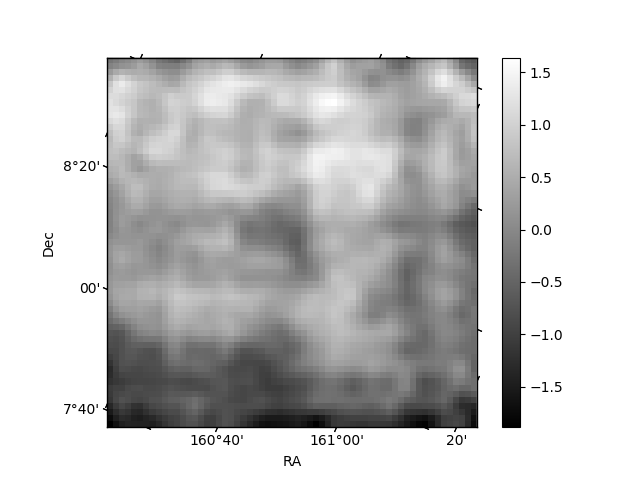
Histogram calculated using DETX and DETY for each event in the final _common_clean file
| Quadrant A | 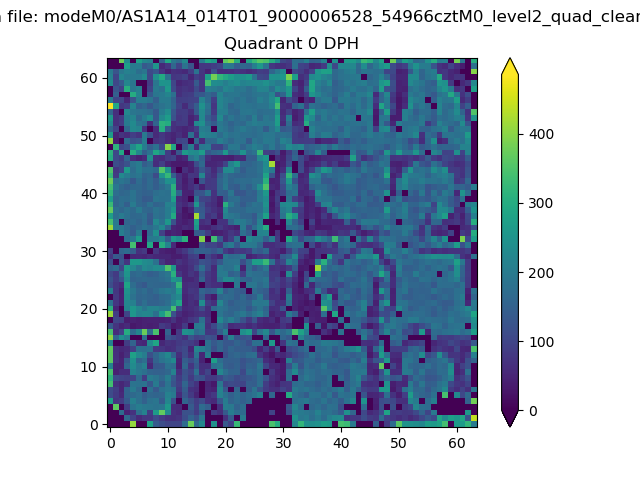 |
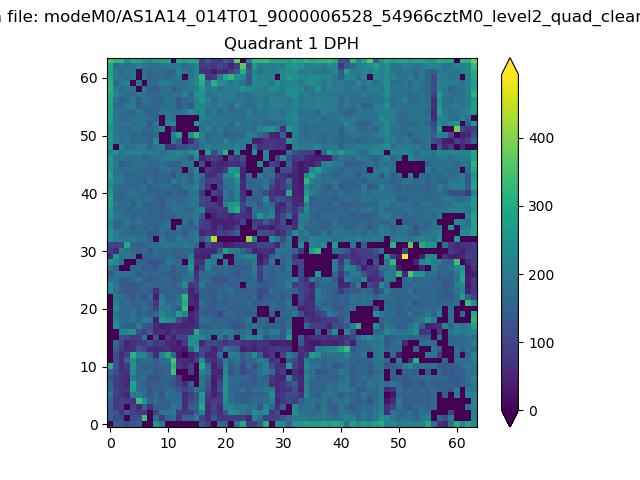 |
Quadrant B |
|---|---|---|---|
| Quadrant D | 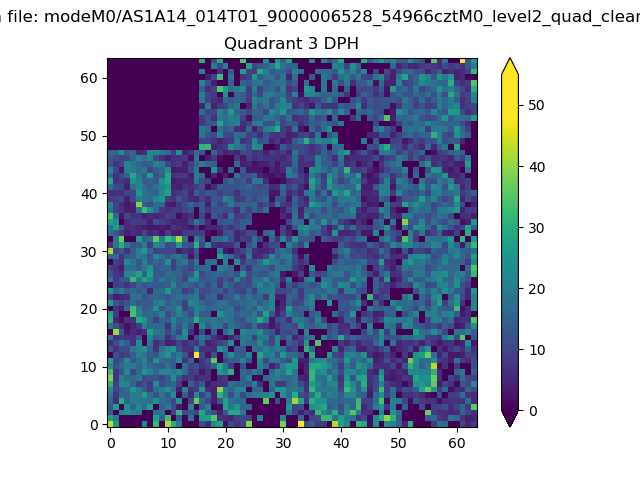 |
 |
Quadrant C |
| Plot type | Count rate plots | Images |
|---|---|---|
| Comparison with Poisson distribution Blue bars denote a histogram of data divided into 1 sec bins. Red curve is a Poisson curve with rate = median count rate of data. |
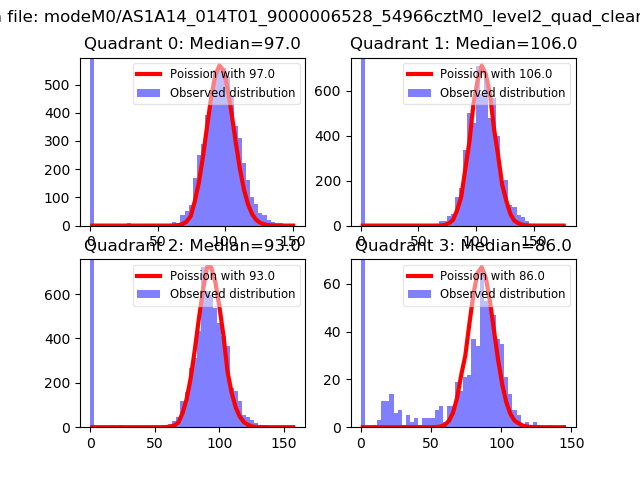 |
 |
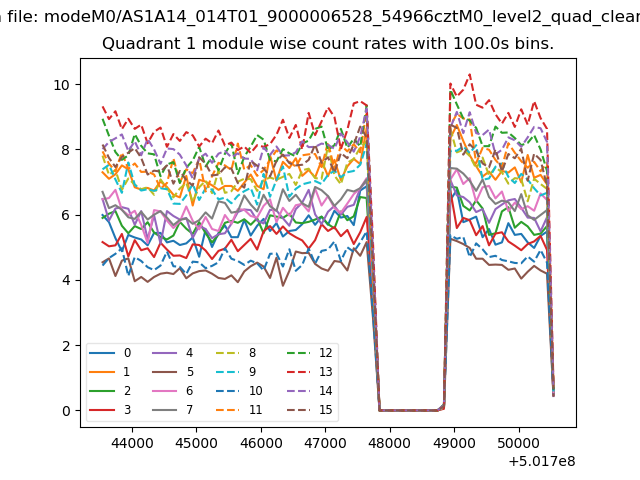
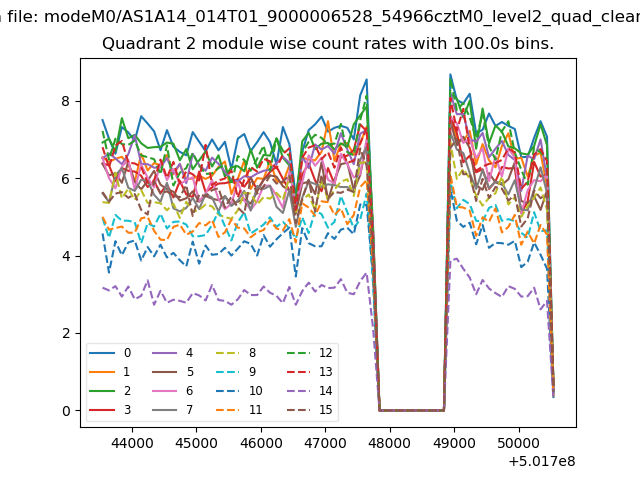
| Quadrant-wise count rates Data is divided into 100 sec bins |
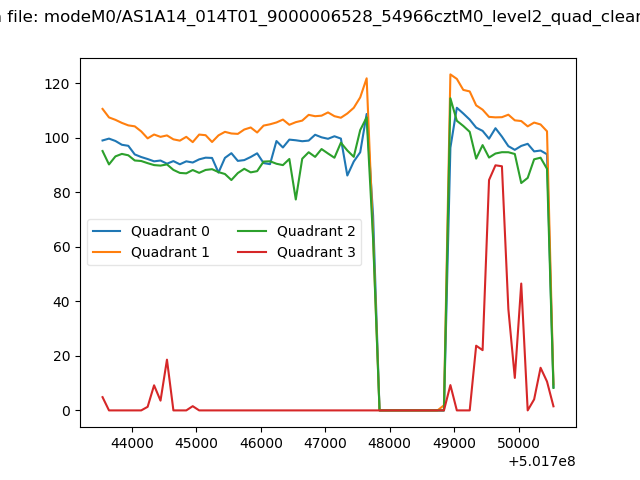 |
|
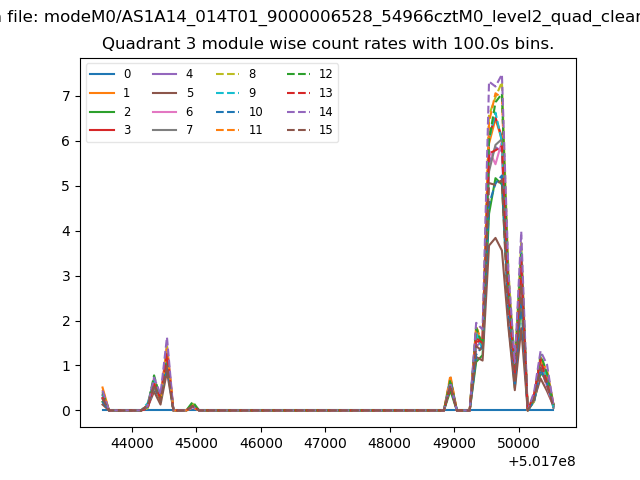
| Module-wise count rates for Quadrant A Data is divided into 100 sec bins |
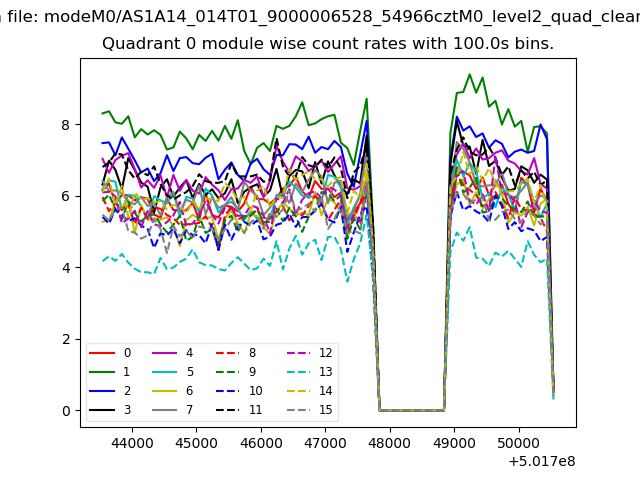 |
 |
| Module-wise count rates for Quadrant B Data is divided into 100 sec bins |
 |
 |
| Module-wise count rates for Quadrant C Data is divided into 100 sec bins |
 |
 |
| Module-wise count rates for Quadrant D Data is divided into 100 sec bins |
 |
 |
| Parameter | Plot |
|---|---|
| CZT HV Monitor | 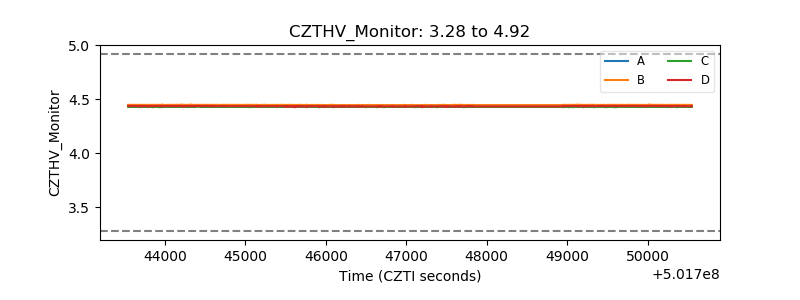 |
| D_VDD | 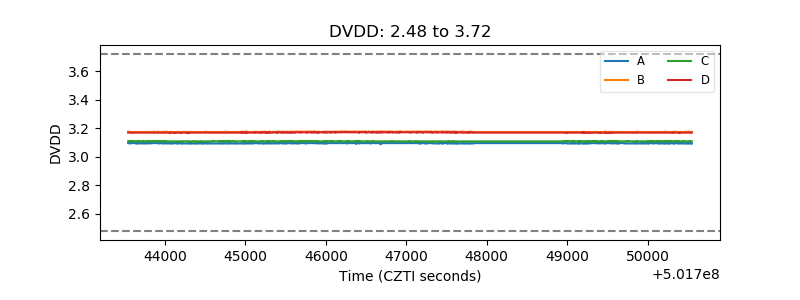 |
| Temperature 1 | 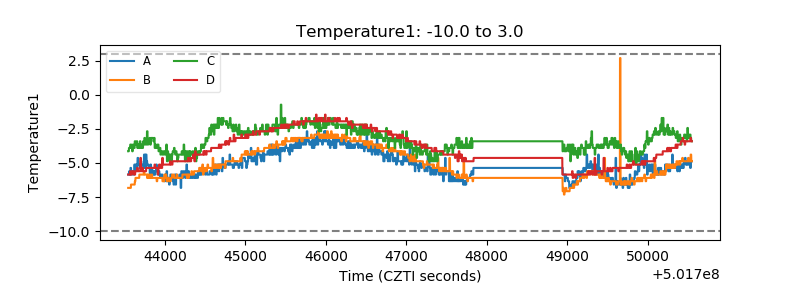 |
| Veto HV Monitor | 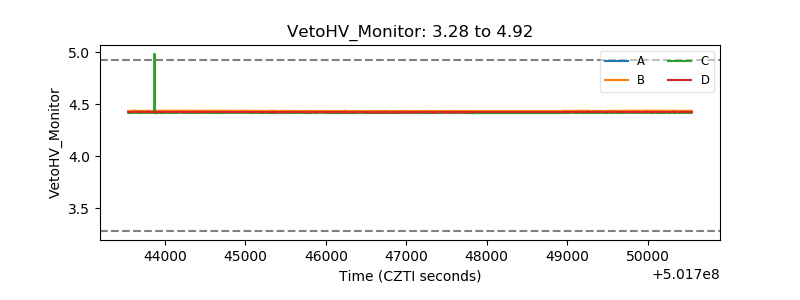 |
| Veto LLD | 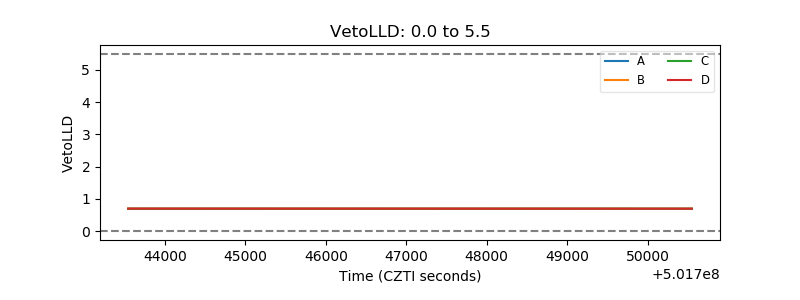 |
| Alpha Counter | 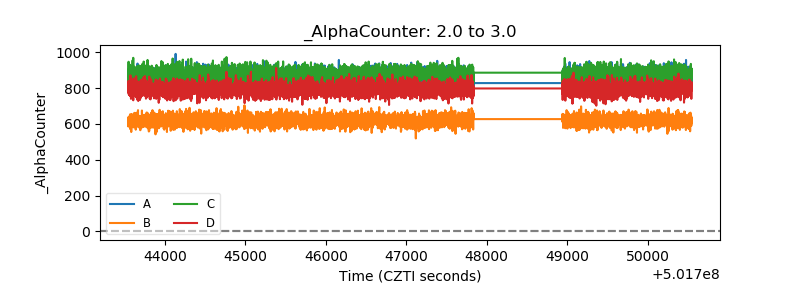 |
| _CPM_Rate | 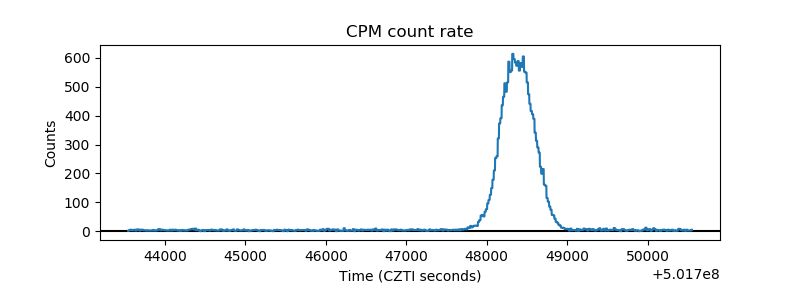 |
| CZT Counter | 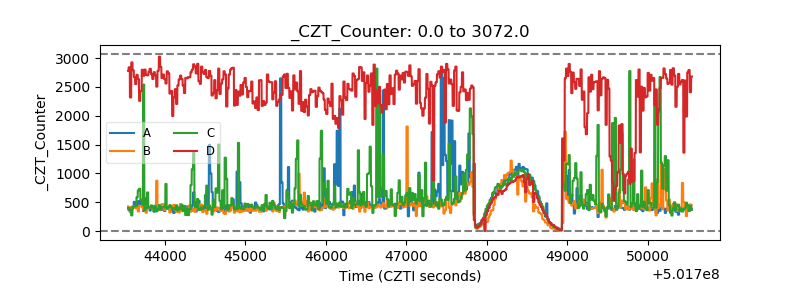 |
| +2.5 Volts monitor |  |
| +5 Volts monitor |  |
| _ROLL_ROT | 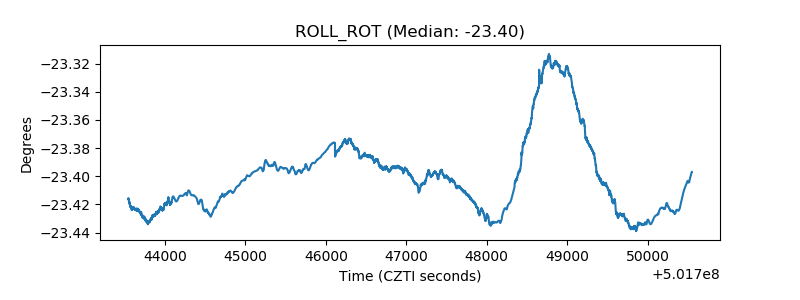 |
| _Roll_DEC | 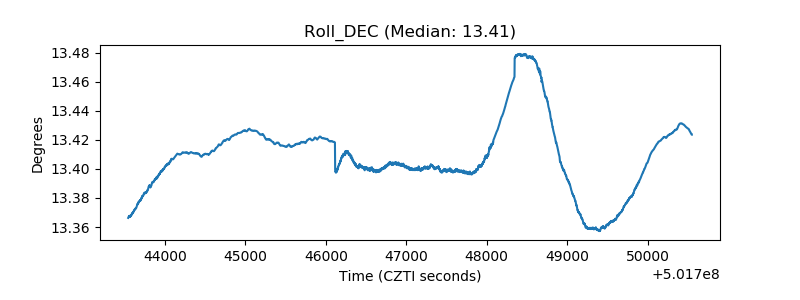 |
| _Roll_RA | 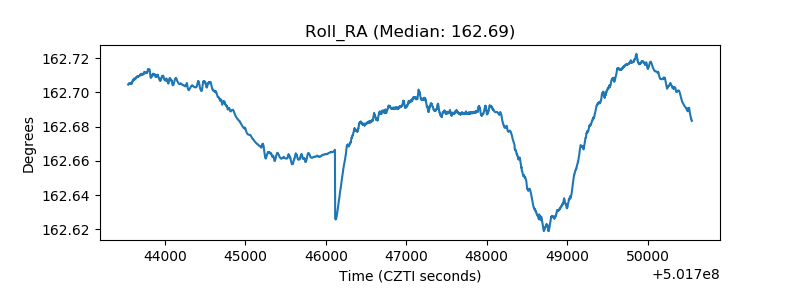 |
| Veto Counter | 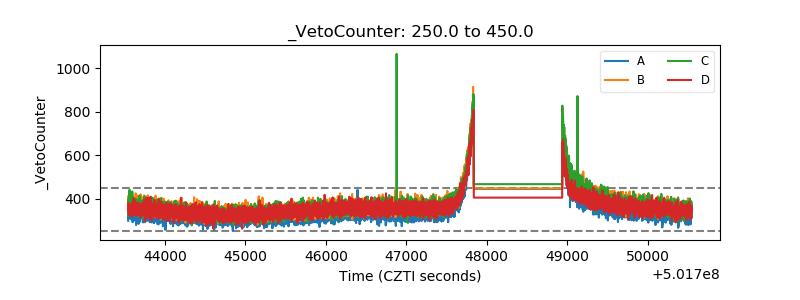 |