| Param | Original file | Final file |
|---|---|---|
| Filename | modeM0/AS1A14_014T01_9000006528_54967cztM0_level2.fits | modeM0/AS1A14_014T01_9000006528_54967cztM0_level2_quad_clean.evt |
| Size (bytes) | 655,608,960 | 88,891,200 |
| Size | 625.2 MB | 84.8 MB |
| Events in quadrant A | 3,658,570 | 623,800 |
| Events in quadrant B | 3,142,524 | 703,061 |
| Events in quadrant C | 4,249,416 | 610,024 |
| Events in quadrant D | 12,703,174 | 292,347 |
| Mode M0 | |||
|---|---|---|---|
| Quadrant | BADHDUFLAG | Total packets | Discarded packets |
| A | 0 | 15724 | 2 |
| B | 0 | 14120 | 2 |
| C | 0 | 17393 | 2 |
| D | 0 | 42405 | 3 |
| Mode SS | |||
|---|---|---|---|
| Quadrant | BADHDUFLAG | Total packets | Discarded packets |
| A | 0 | 136 | 0 |
| B | 0 | 136 | 0 |
| C | 0 | 136 | 0 |
| D | 0 | 136 | 0 |
| Mode M9 | |||
|---|---|---|---|
| Quadrant | BADHDUFLAG | Total packets | Discarded packets |
| A | 0 | 10 | 0 |
| B | 0 | 10 | 0 |
| C | 0 | 10 | 0 |
| D | 0 | 10 | 0 |
| Quadrant | Total seconds | Saturated seconds | Saturation percentage |
|---|---|---|---|
| A | 6629 | 313 | 4.721677% |
| B | 6629 | 101 | 1.523608% |
| C | 6629 | 264 | 3.982501% |
| D | 6628 | 3416 | 51.538926% |
Noise dominated data is calculated using 1-second bins in cleaned event files. If a bin has >2000 counts, and if more than 50% of those come from <1% of pixels, then it is considered to be noise-dominated and hence unusable.
| Quadrant | # 1 sec bins | Bins with >0 counts | Bins with >2000 counts | High rate bins dominated by noise | Noise dominated (total time) | Noise dominated (detector-on time) | Marked lightcurve |
|---|---|---|---|---|---|---|---|
| A | 7704 | 6630 | 140 | 140 | 1.82% | 2.11% | 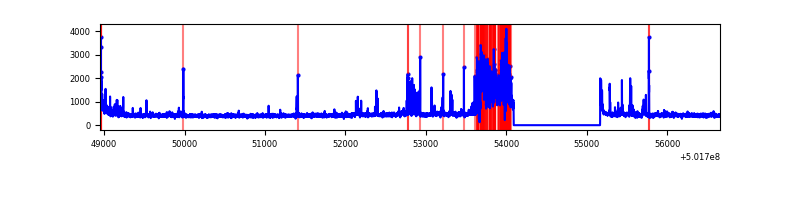 |
| B | 7704 | 6630 | 4 | 4 | 0.05% | 0.06% | 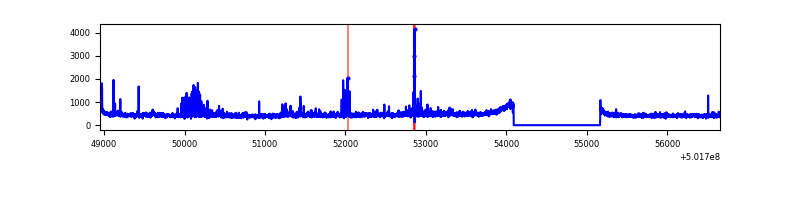 |
| C | 7704 | 6630 | 167 | 167 | 2.17% | 2.52% | 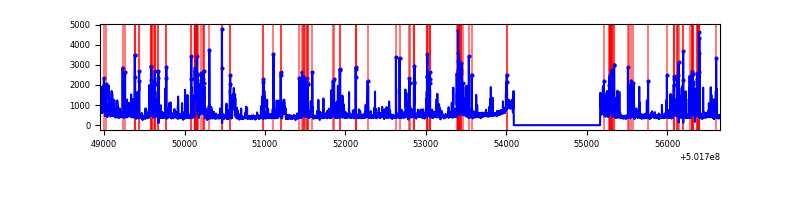 |
| D | 7703 | 6629 | 3425 | 3425 | 44.46% | 51.67% | 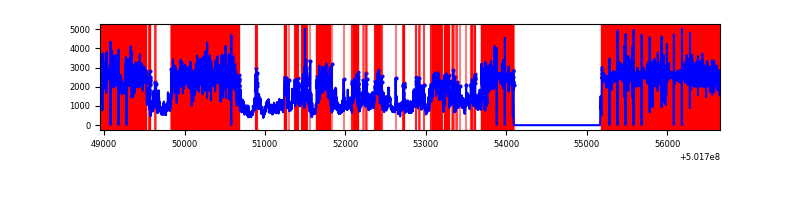 |
Top three noisy pixels from each quadrant. If the there are fewer than three noisy pixels in the level2.evt file, extra rows are filled as -1
| Pixel properties | Quadrant properties | ||||||
|---|---|---|---|---|---|---|---|
| Quadrant | DetID | PixID | Counts | Sigma | Mean | Median | Sigma |
| A | 15 | 32 | 672961 | 3847.08 | 714 | 696 | 174.7 |
| A | 13 | 248 | 119064 | 677.37 | 714 | 696 | 174.7 |
| A | 4 | 3 | 35572 | 199.58 | 714 | 696 | 174.7 |
| B | 5 | 172 | 199336 | 1273.35 | 723 | 698 | 156.0 |
| B | 5 | 185 | 48801 | 308.36 | 723 | 698 | 156.0 |
| B | 12 | 111 | 18772 | 115.86 | 723 | 698 | 156.0 |
| C | 4 | 5 | 1293672 | 6684.5 | 705 | 699 | 193.4 |
| C | 14 | 254 | 50870 | 259.38 | 705 | 699 | 193.4 |
| C | 6 | 223 | 41924 | 213.13 | 705 | 699 | 193.4 |
| D | 15 | 94 | 10261857 | 75806.11 | 476 | 455 | 135.4 |
| D | 2 | 249 | 141034 | 1038.53 | 476 | 455 | 135.4 |
| D | 6 | 239 | 100646 | 740.16 | 476 | 455 | 135.4 |
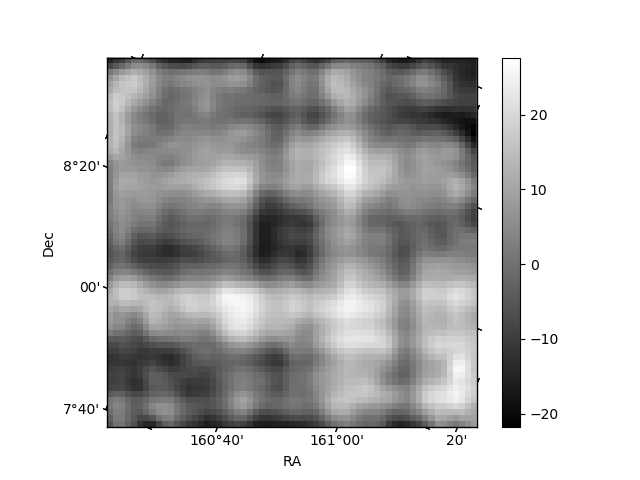
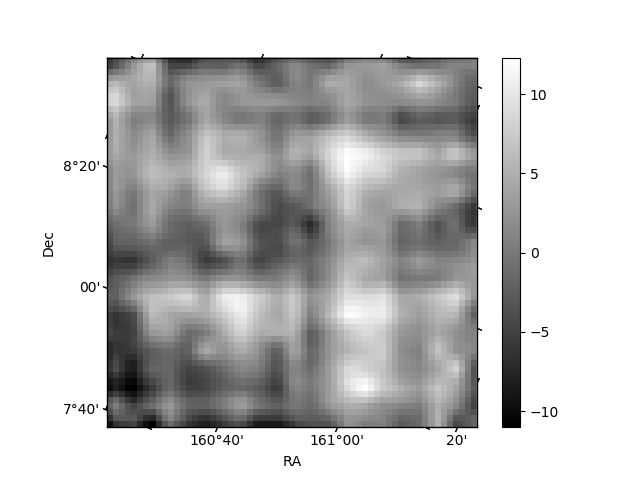
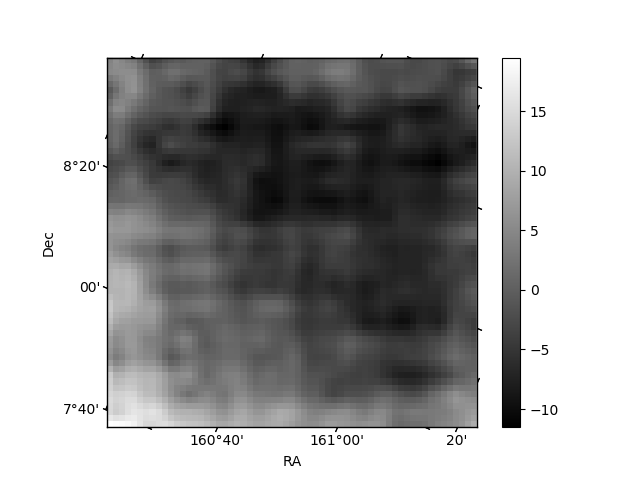
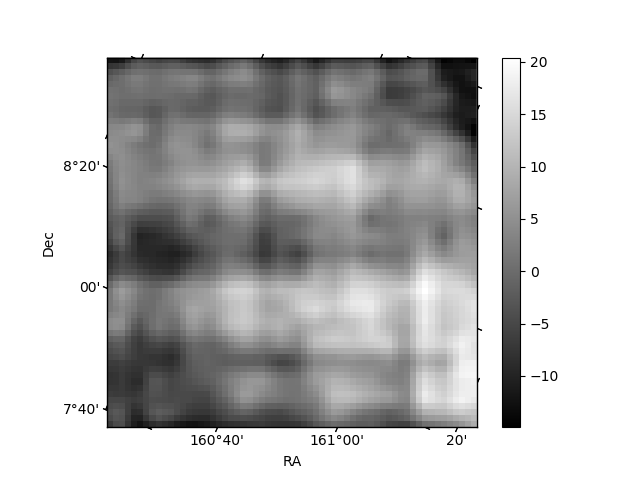
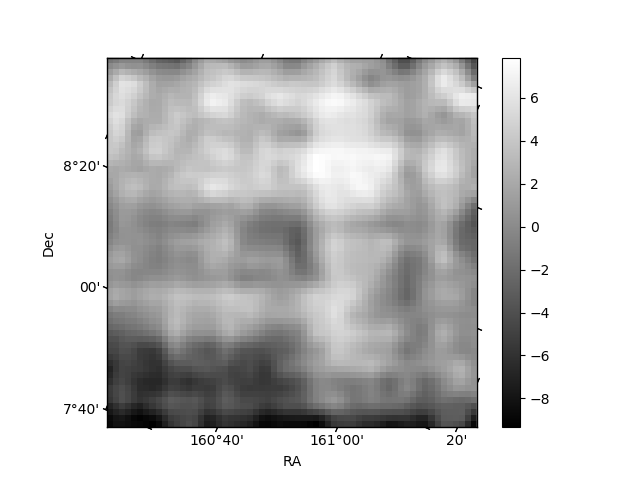
Histogram calculated using DETX and DETY for each event in the final _common_clean file
| Quadrant A | 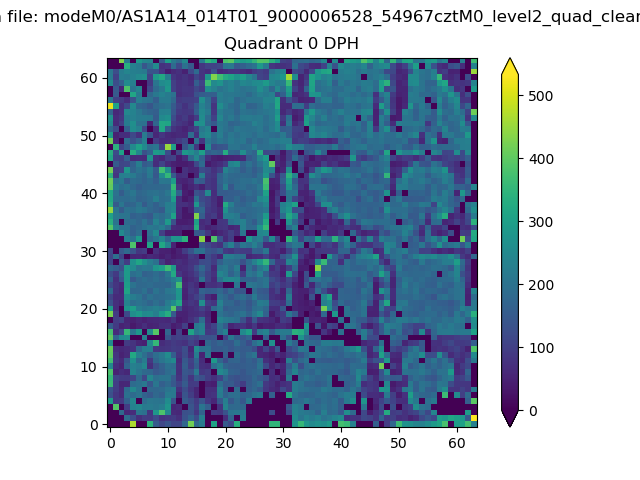 |
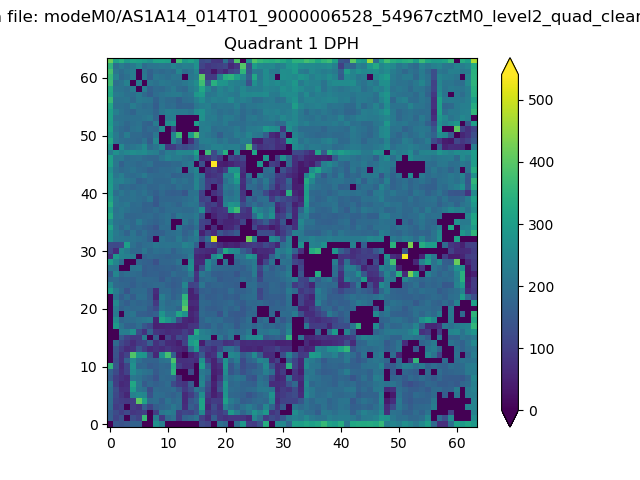 |
Quadrant B |
|---|---|---|---|
| Quadrant D | 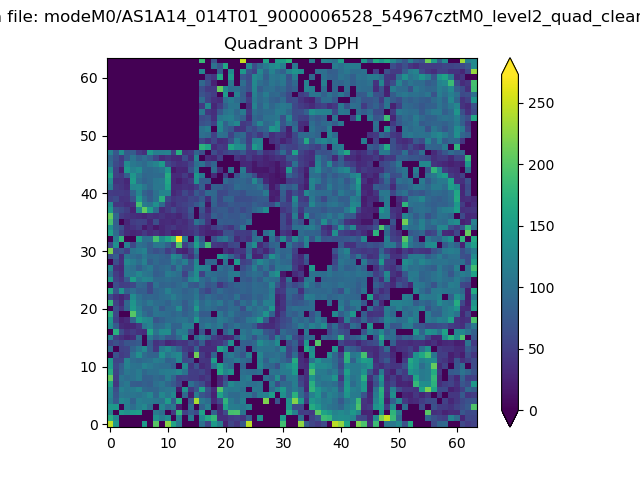 |
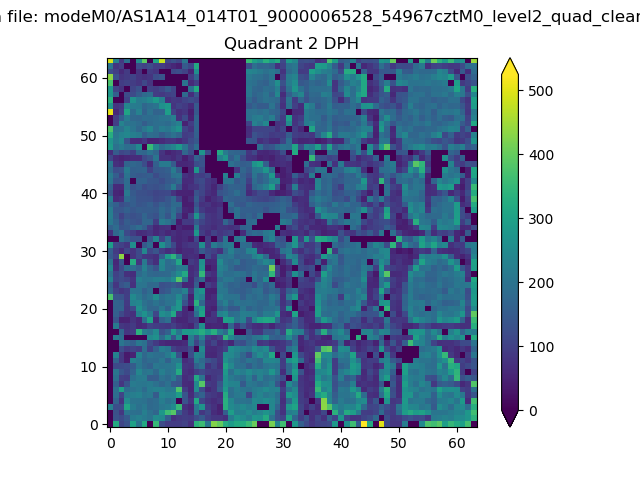 |
Quadrant C |
| Plot type | Count rate plots | Images |
|---|---|---|
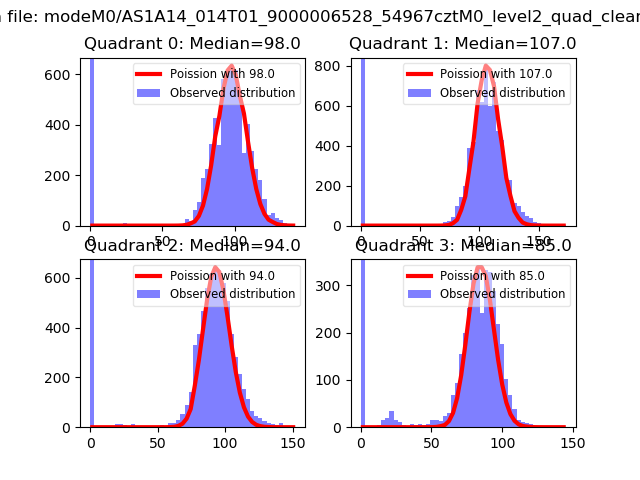
| Comparison with Poisson distribution Blue bars denote a histogram of data divided into 1 sec bins. Red curve is a Poisson curve with rate = median count rate of data. |
 |
 |
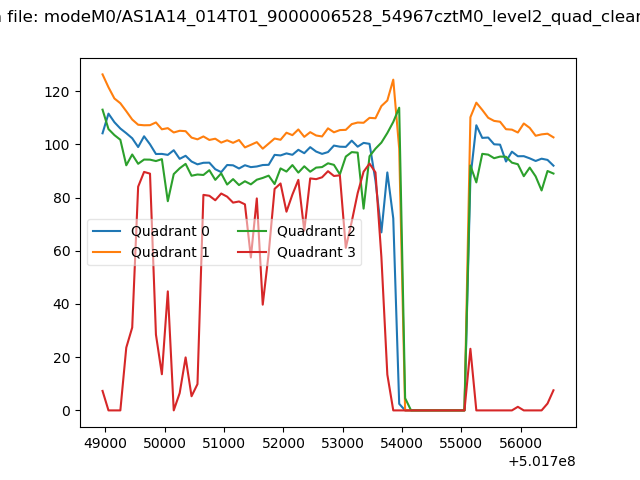
| Quadrant-wise count rates Data is divided into 100 sec bins |
 |
|
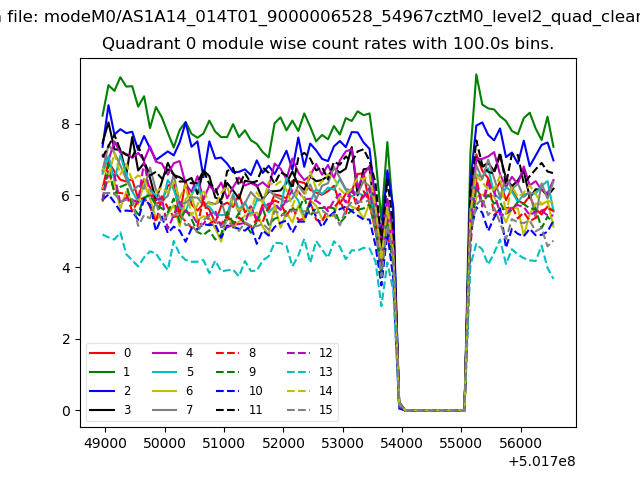
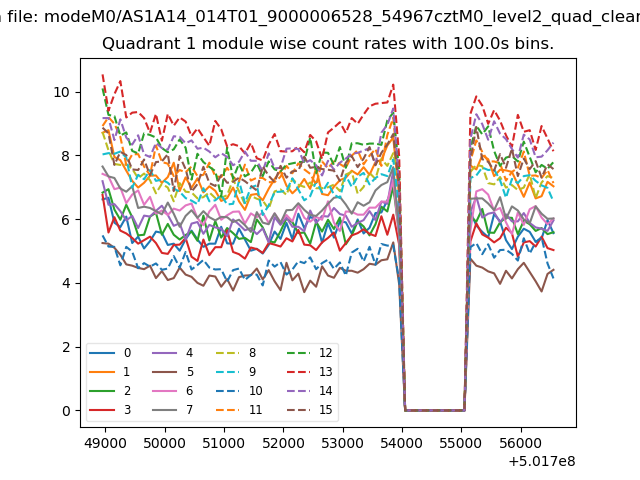
| Module-wise count rates for Quadrant A Data is divided into 100 sec bins |
 |
 |
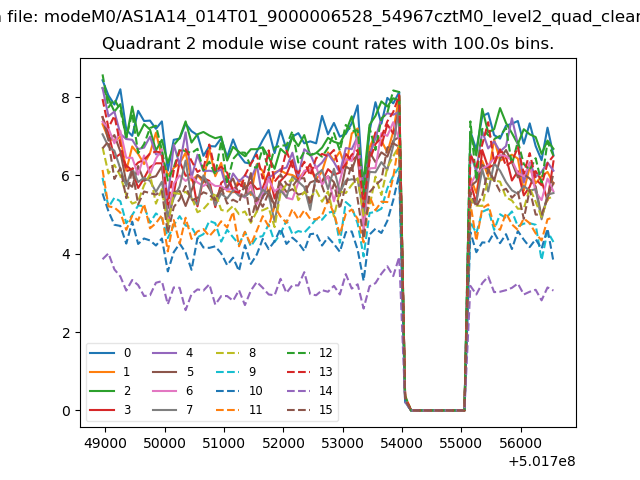
| Module-wise count rates for Quadrant B Data is divided into 100 sec bins |
 |
 |
| Module-wise count rates for Quadrant C Data is divided into 100 sec bins |
 |
 |
| Module-wise count rates for Quadrant D Data is divided into 100 sec bins |
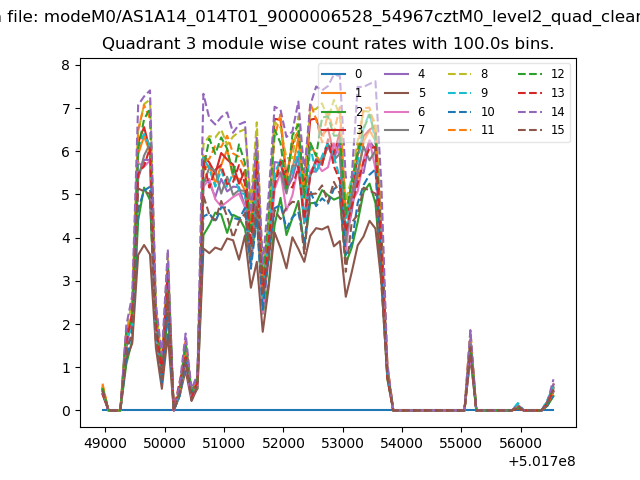 |
 |
| Parameter | Plot |
|---|---|
| CZT HV Monitor | 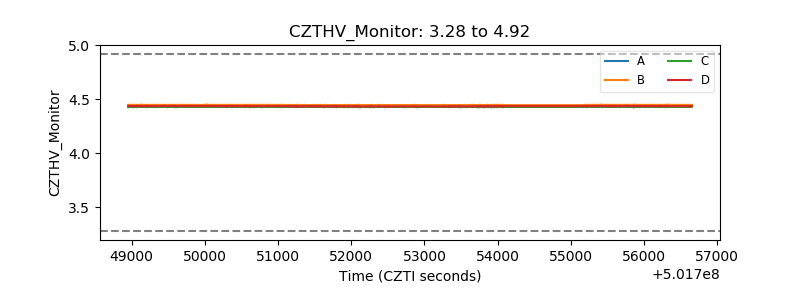 |
| D_VDD | 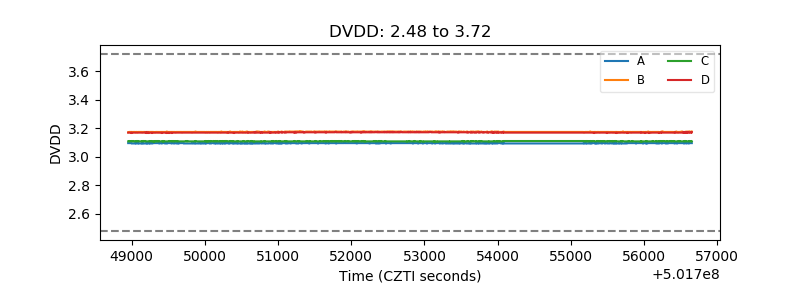 |
| Temperature 1 | 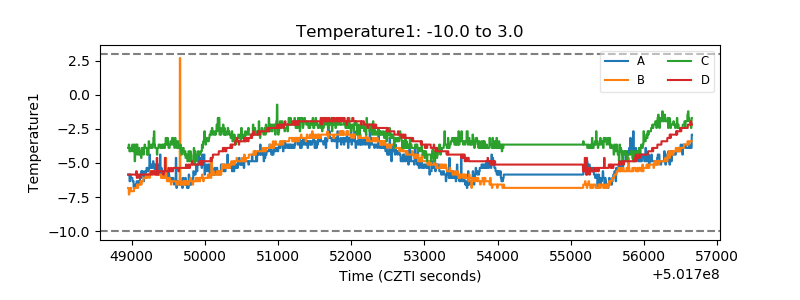 |
| Veto HV Monitor | 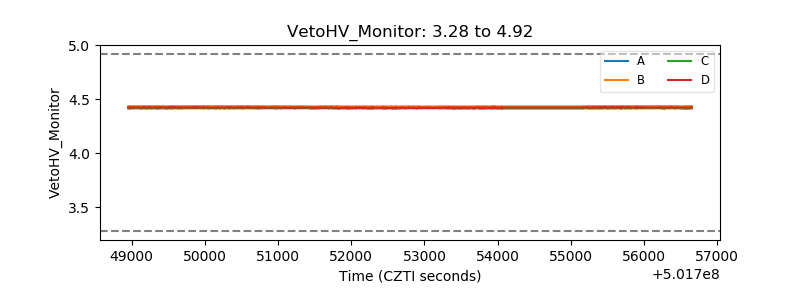 |
| Veto LLD | 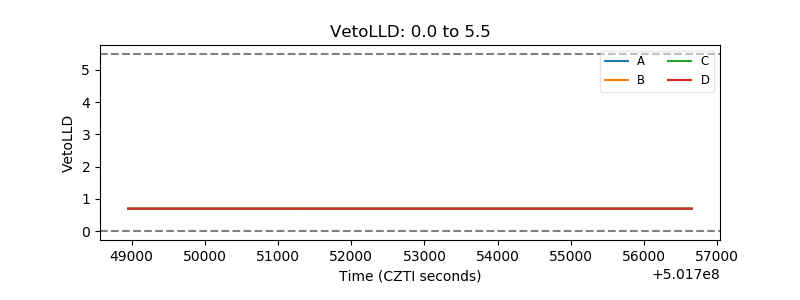 |
| Alpha Counter | 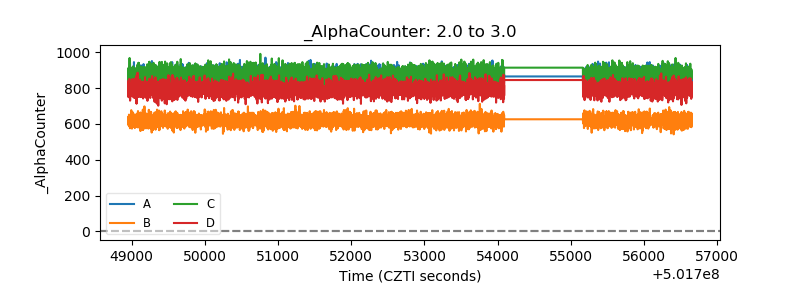 |
| _CPM_Rate | 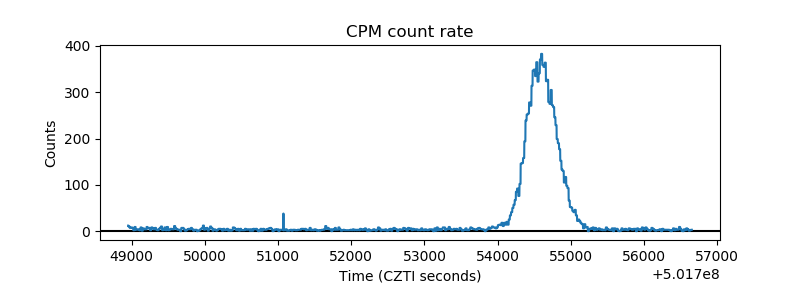 |
| CZT Counter | 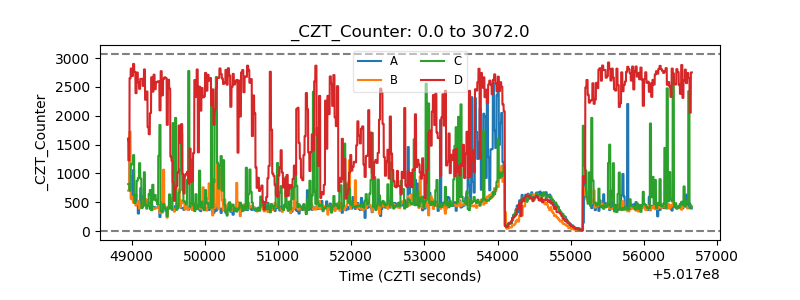 |
| +2.5 Volts monitor |  |
| +5 Volts monitor |  |
| _ROLL_ROT | 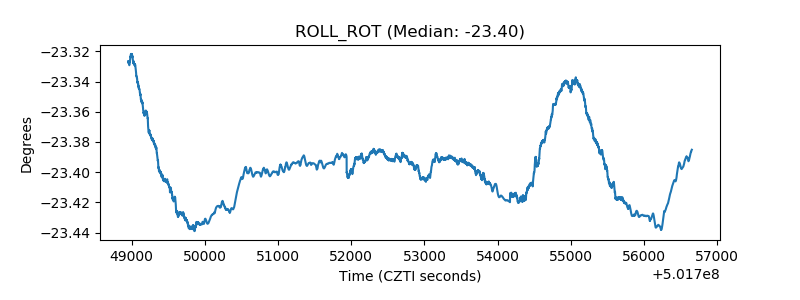 |
| _Roll_DEC | 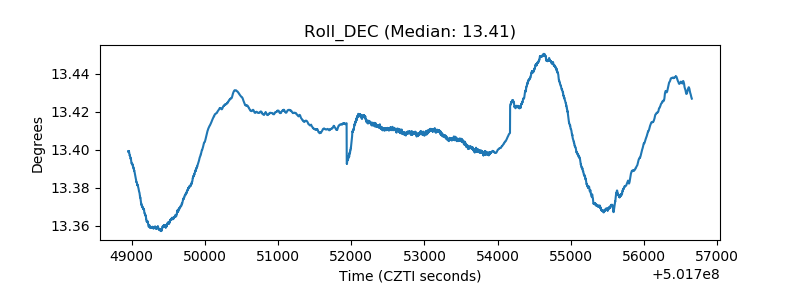 |
| _Roll_RA | 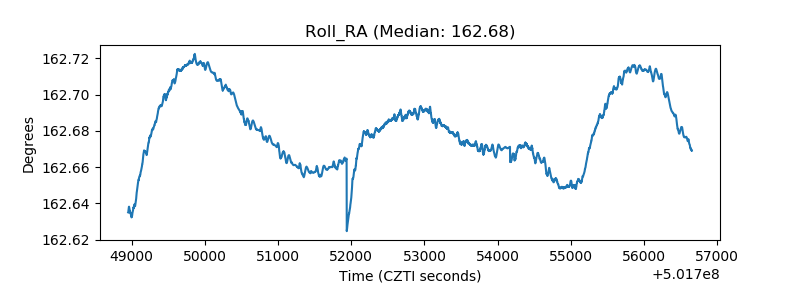 |
| Veto Counter | 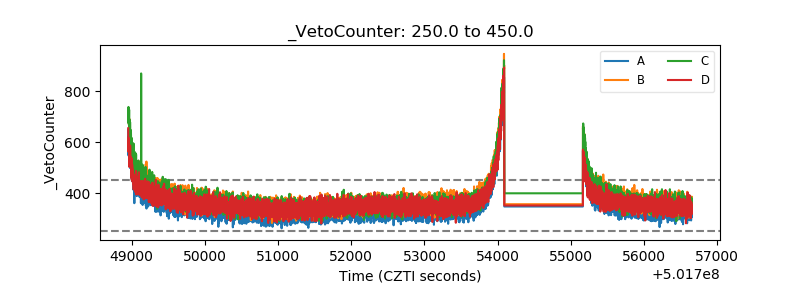 |